528-F Transactions of the American Fisheries Society 135:1493–1498, 2006 Ó Copyright by the American Fisheries Society 2006 DOI: 10.1577/T05-063.1
[Note]
Ontogenetic Changes in Prey Preference and Foraging Ability of Yellow Perch: Insights Based on Relative Energetic Return of Prey BRIAN D. S. GRAEB* Center for Aquatic Ecology, Illinois Natural History Survey, and Department of Natural Resources and Environmental Sciences, University of Illinois, 607 East Peabody Drive, Champaign, Illinois 61820, USA, and Department of Wildlife and Fisheries Sciences, South Dakota State University, Brookings, South Dakota 57007, USA
MATTHEW T. MANGAN
AND
JEFFREY C. JOLLEY
Department of Wildlife and Fisheries Sciences, South Dakota State University, Brookings, South Dakota 57007, USA
DAVID H. WAHL
AND
JOHN M. DETTMERS1
Center for Aquatic Ecology, Illinois Natural History Survey, and Department of Natural Resources and Environmental Sciences, University of Illinois, 607 East Peabody Drive, Champaign, Illinois 61820, USA Abstract.—Ontogenetic diet shifts are an important component of the early life history of many fishes. Successfully shifting diets affects not only individuals but also populations and communities. We experimentally quantified prey selection and feeding behavior of age-0 yellow perch Perca flavescens to determine the sizes at which diet shifts occur and identify potential mechanisms driving these shifts. Yellow perch were provided three prey types (zooplankton, benthic invertebrates, and fish) at high- and low-density combinations. Small yellow perch (20 mm total length [TL]) positively selected zooplankton, but intermediate-sized fish (40 and 60 mm TL) shifted to benthic invertebrates. At 80 mm TL, yellow perch positively selected benthic invertebrate and fish prey, indicating the onset of piscivory. Relative densities of prey items did not influence prey selection patterns. Diet shifts from zooplankton to benthic invertebrates to fish prey were supported by an increased energetic gain and decreased foraging costs for each prey type as age-0 yellow perch size increased. Quantifying prey selection and foraging behavior under various prey densities can be used to better understand mechanisms governing ontogenetic diet shifts in fishes.
Ontogenetic diet shifts are common among many predators and can play an important role in determining growth and survival of individuals, population interactions, and community structure (Werner and Gilliam 1984). These shifts are often mediated by gape limitation, particularly during the larval stage (Bremi* Corresponding author:
[email protected] 1 Present address: Great Lakes Fishery Commission, 2100 Commonwealth Boulevard, Suite 100, Ann Arbor, Michigan 48105,USA Received February 18, 2005; accepted June 15, 2006 Published online November 2, 2006
gan and Stein 1994). Other factors such as predation risk (Werner and Hall 1988), foraging efficiency (Wu and Culver 1992; Hjelm et al. 2003), and food availability and prey size (Hansen and Wahl 1981) also can influence diet shifts. Food habits determined from field studies of yellow perch Perca flavescens are readily available (e.g., Keast 1985; Fullhart et al. 2002), but prey selection patterns and the mechanisms determining diet shifts are poorly understood. Based on field studies, yellow perch experience an ontogenetic diet shift during their first year of life (Whiteside et al. 1985). Yellow perch initially feed on small zooplankton and gradually shift to larger zooplankton as fish size increases (Mills et al. 1989; Graeb et al. 2004). Yellow perch gradually shift to feeding on benthic invertebrates after reaching a total length of about 40 mm (Pycha and Smith 1955; Ney and Smith 1975). As yellow perch grow (total length [TL] . 150 mm), they shift to a diet of fish (Keast 1985; Fullhart et al. 2002). The shift by yellow perch from zooplankton to benthic invertebrates has been validated in the laboratory by examining prey selection in controlled experiments (Wu and Culver 1992). However, selection patterns with fish included as prey were not quantified. Although ontogenetic diet shifts by yellow perch have been demonstrated in field and laboratory settings, factors influencing these shifts (e.g., relative foraging efficiencies) have not been fully examined. Furthermore, prey selection incorporating the full range of prey types of yellow perch has not been quantified. To better understand ontogenetic diet shifts by yellow perch and identify possible mechanisms
1493
1494
GRAEB ET AL.
influencing these shifts, we quantified prey selection and foraging behavior for several size-classes of yellow perch in laboratory experiments. These experiments incorporated varying densities of zooplankton, benthic invertebrates, and fish as available prey to determine which factors affected prey selection and ultimately diet shifts. Given previous studies on food habits, we predicted that small size-classes of yellow perch would positively select zooplankton prey and forage more efficiently on this prey type than on other prey types. As yellow perch size increased, we expected yellow perch to shift to positively select benthic invertebrates and ultimately fish. Further, we predicted these shifts would be facilitated by increased foraging efficiency and energetic gain. Methods To test our predictions, we designed laboratory experiments to quantify size-specific prey selection and foraging behavior of yellow perch. Both variables were quantified for yellow perch when offered three prey types (fish, zooplankton, and benthic invertebrates) at two prey densities (high and low). All experiments were conducted during 2000–2001 at the Kaskaskia Biological Station, Illinois Natural History Survey, Sullivan, Illinois. We conducted experiments using 20-, 40-, 60-, and 80-mm size-classes of yellow perch. Predators used in each size-class were within 2 mm of the target size (i.e., for the 20-mm size-class, we used 18–22-mm predators). Predators were randomly drawn from a large pool (.200 individuals) of experimental fish that were routinely fed prey types used in our experiments. Predators were not used more than once for any trial. In general, we designed our experiment to relate to yellow perch in field conditions. As such, we increased fish prey length with predator length but held zooplankton and invertebrate length constant (Galarowicz and Wahl 2005). Age-0 bluegills Lepomis macrochirus were used as fish prey at 20–25% of the TL of the predator. Chironomid larvae were used as benthic invertebrate prey (mean length ¼ 11 mm, SE ¼ 0.33) and daphnids as zooplankton prey (mean length ¼ 1.7 mm, SE ¼ 0.02). At least 20 individuals of each prey taxon were measured to determine mean length. All prey items were within the gape limits of predators. Prey selection.—We quantified prey selection by observing a single predator foraging on prey items in a rectangular 500-L glass arena (see Einfalt and Wahl 1997). Fish, benthic invertebrate, and zooplankton prey were offered to yellow perch in all combinations of high and low densities, for a total of eight different prey assemblage combinations. Low densities for prey were fish (10 individuals/m3), benthic invertebrates (25 individuals/m2), and zooplankton (2.5 individuals/L),
whereas high densities were fish (100 individuals/m3), benthic invertebrates (500 individuals/m2), and zooplankton (25 individuals/L). Prey densities used in our experiment represented high and low relative densities common in Illinois reservoirs (Welker et al. 1994; Claramunt and Wahl 2000). Before the start of each 30min observation period, a single predator (starved 12– 24 h) was acclimated in a small holding chamber within the behavioral arena for at least 30 min. Prey were also allowed to acclimate in the behavioral arena for at least 30 min. During each trial, the numbers of strikes and captures for all different prey items were recorded. Five replicate trials were conducted on all prey combinations offered to each size-class of yellow perch (n ¼ 160 trials). To determine prey selectivity, we calculated mean Chesson’s (1983) coefficient of selectivity (a) for each yellow perch size-class, prey type, and prey density combination: r1 =n1 a¼ X m r1 =n1 i¼1
where ri is the number of food type i in the predator diet, ni is the number of food type i in the environment, and m is the number of prey types available. Mean a values (695% confidence intervals) were compared against random feeding (1/m) to determine selectivity. Foraging behavior.—We determined the relative energetic benefits (J) and costs (capture efficiency and handling time) for yellow perch feeding on fish, chironomid, and zooplankton prey. From the average lengths of prey items in each experiment, we determined dry mass by using length–mass regression equations for Daphnia spp. (Bottrell et al. 1976) and chironomids (Benke et al. 1999). Bluegill mass was determined by weighing 10 bluegills in each prey sizeclass. Mean bluegill dry weight was 15% of wet weight (L. M. Einfalt, Illinois Natural History Survey, unpublished data). Using the estimated biomass, we determined the number of joules per individual prey item based on estimated energy densities (Cummins and Wuycheck 1971). Energy density of each prey type was combined with the average mass of each yellow perch size-class (i.e., J/g of predator) to estimate the mean energetic gain from each prey type. We observed strikes and successful captures during the selectivity trials to determine capture efficiency (number of captures per strike). Capture efficiency was averaged for each prey type during each trial and was analyzed by using a two-factor analysis of variance (ANOVA) to determine if capture efficiency changed across predator sizes and prey combinations. Handling
1495
NOTE
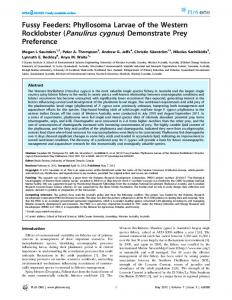
FIGURE 1.—Mean (95% confidence intervals) prey selection (Chesson’s a) by yellow perch in laboratory experiments in relation to predator size. Confidence intervals falling above the random feeding (dashed) line indicate positive selection, values below the line indicate negative selection, and values overlapping the line indicate neutral selection.
time (the time between capture and resumption of searching) was estimated from results for 30 yellow perch (n ¼ 10 for each prey type) for each size-class to further explore mechanisms determining prey selectivity. A single predator (starved 12–24 h) was allowed to forage on one type of prey (prey density was greater than or equal to low density from prey selection experiments) in a 38-L aquarium. Handling time (Einfalt and Wahl 1997) was estimated only for the first capture event to avoid interactions between handling time and gut fullness (Graeb et al. 2004). Results We found negative, neutral, and positive selection across prey densities for each size-class of yellow perch, suggesting no relationship between prey density and selectivity. Hence, to characterize patterns in prey selection, we averaged the mean Chesson’s a values within each size-class of yellow perch (Figure 1). Patterns in prey selection revealed an ontogenetic diet shift from zooplankton to benthic invertebrates and finally to fish prey as yellow perch size increased. Small yellow perch (20 mm TL) positively selected zooplankton prey, negatively selected benthic invertebrates, and neutrally selected fish prey (Figure 1). Intermediate-sized yellow perch (40 and 60 mm TL) positively selected benthic invertebrate prey but negatively selected zooplankton and fish prey. Finally, large yellow perch (80 mm TL) positively selected both benthic invertebrates and fish prey but negatively selected zooplankton. Capture efficiency was not affected by prey density (main effect of prey density for all prey types F7, 67–98
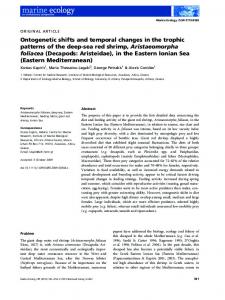
¼ 0.39–2.22, P ¼ 0.04–0.9; error df varied among prey types because not all three prey types were always consumed during each replicate trial). Thus, capture efficiency was averaged across all treatment combinations within a size-class for subsequent analyses. Energetic gain in terms of both capture efficiency and handling time generally followed patterns of prey selection, except for 20-mm yellow perch (Figure 2; energetic gain rate). Energy gained from zooplankton decreased with increasing predator size but apparently was high enough at small sizes for yellow perch to positively select this prey type. Yellow perch avoided zooplankton at all other sizes. Yellow perch gained the most joules from benthic invertebrates at small and intermediate sizes, but energetic gain from this prey type also decreased with increasing predator size. Conversely, smaller size-classes of yellow perch gained few joules from fish prey, but energetic gain increased for this prey type such that yellow perch gained the most joules from fish prey at the largest size examined. Small yellow perch (20 mm) positively selected zooplankton prey despite the large energetic gain from benthic invertebrates. These small predators required long handling times to ingest benthic invertebrates relative to other prey types and for larger yellow perch (Figure 2; absolute costs). Discussion Yellow perch demonstrated an ontogenetic diet shift across the sizes we examined. At smaller sizes (20 mm TL), yellow perch selected zooplankton, but from 20 to 40 mm TL they shifted to benthic invertebrates. Large yellow perch (80 mm TL) maintained positive selection for benthic invertebrates but also began to exhibit piscivorous feeding behavior, as demonstrated by positive selection for fish. The ontogenetic diet shifts demonstrated by prey selection were generally supported by shifts in the relative foraging costs of different prey types. Initial selection of zooplankton by small yellow perch (20 mm TL) was probably a result of reduced foraging costs compared with that for benthic invertebrates and fish. Our results indicated that benthic invertebrates provided much higher energetic gain than zooplankton for small yellow perch. However, handling times were substantially higher for benthic invertebrates than for zooplankton. Energy gained from fish prey was less than that from zooplankton, but handling time was intermediate to the other prey types. As such, small yellow perch neutrally selected fish. Even though benthic invertebrates provided much greater energy return than zooplankton prey for small yellow perch, the fish probably delayed shifting to this
1496
GRAEB ET AL.
FIGURE 2.—Left panels: energetic gain rates (mean 6 SE) of capture efficiency (J/g of predator per strike) and handling time (J/g of predator per second of handling time) by foraging yellow perch in laboratory experiments. Right panels depict the absolute behavioral costs of capture efficiency (captures/strike) and handling time (s) of four size-classes of yellow perch feeding on zooplankton, benthic invertebrates, and fish prey.
prey item until foraging costs decreased. The diet shift from zooplankton by 20-mm-TL yellow perch to benthic invertebrates at 40 mm TL was accompanied by a decrease in handling time as well as the highest energy return. The shift from zooplankton to benthic invertebrates at this size has also been demonstrated in field studies. For example, food habits studies in several systems indicate yellow perch shift from a zooplankton-dominated diet to benthic invertebrates when reaching size-classes between 30 and 50 mm (Pycha and Smith 1955; Ney and Smith 1975; Wu and Culver 1992; Fisher and Willis 1997). Although the shift from zooplankton to benthic invertebrates is well documented, the mechanism determining this diet shift was previously thought to be prey availability, whereas as our study revealed that foraging efficiency and energetic gain may also explain this diet shift. Previous research indicated that declines in zooplankton abundance (particularly large daphnids) can cause a diet shift by yellow perch from zooplankton to benthic invertebrates (e.g., Mills and Forney 1981; Wu and Culver 1992). However, our results suggest that changes in foraging efficiency and energy gain may be as important as prey abundance in determining the shift from zooplankton to benthic invertebrates. Even though variable prey densities were offered to yellow perch, all predators within a given size-class positively selected the same prey type. For example, intermediate-
sized (40–60 mm TL) yellow perch positively selected benthic invertebrates regardless of their abundance relative to zooplankton and fish prey. Thus, the shift from zooplankton to benthic invertebrates noted in previous studies may simply coincide with the size at which benthic invertebrates become more energetically favorable than zooplankton to yellow perch. Yellow perch positively selected benthic invertebrate prey through the 60-mm-TL size-class but began to shift preference to fish prey when reaching 80 mm TL. Energy gains from benthic invertebrate and fish prey were similar for 60–mm-TL yellow perch, but yellow perch probably delayed shifting to fish prey until they attained 80 mm, when fish prey provided higher energy returns. This delay also probably reflects a tradeoff in foraging efficiency. Yellow perch at 60 mm consumed benthic invertebrates more efficiently than fish prey. By 80 mm, yellow perch positively selected fish prey as well as benthic invertebrates, indicating that yellow perch had begun the shift to piscivory. In addition to increasing size, these predators also underwent morphological changes concomitant with the shift to piscivory that probably interacted with similar changes that occurred in prey morphology to determine the patterns we observed. Thus, regardless of morphological differences between predators and prey, fish prey provided higher energy return for 80-mm yellow perch, suggesting why fish began to be selected by yellow
1497
NOTE
perch at this size. These mechanisms probably explain why fish become more prevalent in the diets of larger yellow perch than zooplankton and benthic invertebrate prey. Our results revealed that yellow perch can shift to fish prey at smaller sizes than previously noted. We propose that 80 mm is most likely the size at which yellow perch can begin to shift to fish prey. The smallest size at which yellow perch were previously reported to shift to fish prey was 130 mm (Fullhart et al. 2002). The lack of fish in diets of yellow perch from previous field studies may be associated with the availability of appropriately sized prey fish. In natural systems, availability of prey fish is often dependent on the timing of hatch for particular prey species. For example, in Lake Opinicon, Ontario, the timing of hatch of many prey fish species was similar to that of yellow perch (Keast 1980). Hence, by the time yellow perch reached a size at which they could shift to piscivory (i.e., 80 mm, this study) prey fish may have outgrown the window of vulnerability to yellow perch predation. Future studies that examine yellow perch prey selection in a range of systems with variable timing of occurrence of fish prey will improve our understanding of the shift to piscivory by yellow perch. Predicting the variable timing of ontogenetic diet shifts in fishes requires separating the interactive effects of prey availability from relative energetic costs and gains of different prey types. Our results indicated that ontogenetic diet shifts in yellow perch occurred independently of relative prey availability but instead were determined by a combination of energetic gain and foraging costs. Specifically, yellow perch shifted to prey that were energetically favorable but only after foraging costs decreased. In contrast, predators that actively select prey choose the optimal prey type despite differences in foraging efficiency (Turesson et al. 2002). Examination of other factors such as encounter rates (which we did not measure but were probably relatively constant and high in our study) and other components of foraging (e.g., searching, pursuing, etc.; Sherwood et al. 2002) will continue to improve our understanding of diet shifts in yellow perch and other predators. Acknowledgments This project was greatly enhanced by the support of A. Arce, S. Chipps, T. Selch, and the South Dakota State University Ecology Discussion Group, who provided valuable comments on earlier versions of this manuscript. We thank the staff at the Lake Michigan Biological Station and the Kaskaskia Biological Station, Illinois Natural History Survey, for their technical advice and assistance. Funding for this
project was provided by the Federal Aid in Sport Fish Restoration Program (project F-123-R, administered by the Illinois Department of Natural Resources, Illinois– Indiana Sea Grant through grant number NA86RG0048) and by the Illinois Natural History Survey. References Benke, A. C., A. H. Huryn, L. A. Smock, and J. B. Wallace. 1999. Length–mass relationships for freshwater macroinvertebrates in North America with particular reference to the southeastern United States. Journal of the North American Benthological Society 18:308–343. Bottrell, H. H., A. Duncan, Z. M. Gliwicz, E. Grygierek, A. Herzig, A. Hillbricht-Ilkowska, H. Kurasawa, P. Larsson, and T. Weglenska. 1976. A review of some problems in zooplankton production studies. Norwegian Journal of Zoology 24:419–456. Bremigan, M. T., and R. A. Stein. 1994. Gape-dependent larval foraging and zooplankton size: implications for fish recruitment across systems. Canadian Journal of Fisheries and Aquatic Sciences 51:913–922. Chesson, J. 1983. The estimation and analysis of preferences and its relationship to foraging models. Ecology 70:1227–1235. Claramunt, R. M., and D. H. Wahl. 2000. The effects of abiotic and biotic factors in determining larval fish growth rates: a comparison across species and reservoirs. Transactions of the American Fisheries Society 129:835– 851. Cummins, K. W., and J. C. Wuycheck. 1971. Caloric equivalents for investigations in ecological energetics. Mitteilungen Internationale Vereinigung Fu¨r Theoretische und Angewandte Limnogie 18:1–158. Einfalt, L. M., and D. H. Wahl. 1997. Prey selection by juvenile walleye as influenced by prey morphology and behavior. Canadian Journal of Fisheries and Aquatic Sciences 54:2618–2626. Fisher, S. J., and D. W. Willis. 1997. Early life history of yellow perch in two South Dakota glacial lakes. Journal of Freshwater Ecology 12:421–429. Fullhart, H. G., B. G. Parsons, D. W. Willis, and J. R. Reed. 2002. Yellow perch piscivory and its possible role in structuring littoral zone fish communities in small Minnesota Lakes. Journal of Freshwater Fish Ecology 17:37–43. Galarowicz, T. L., and D. H. Wahl. 2005. Influence of size, prey type and density on consumption and foraging behavior of walleye. Canadian Journal of Fisheries and Aquatic Sciences 62:2330–2342. Graeb, B. D. S., J. M. Dettmers, D.H. Wahl, and C. E. Ca´ceres. 2004. Fish size and prey availability affect growth, survival, prey selection, and foraging behavior of larval yellow perch. Transactions of the American Fisheries Society 133:504–514. Hansen, M. J., and D. H. Wahl. 1981. Selection of small Daphnia pulex by yellow perch fry in Oneida Lake, New York. Transactions of the American Fisheries Society 110:64–71. Hjelm, J., G. H. van de Weerd, and F. A. Sibbing. 2003. Functional link between foraging performance, function-
1498
GRAEB ET AL.
al morphology, and diet shift in roach (Rutilus rutilus). Canadian Journal of Fisheries and Aquatic Sciences 60:700–709. Keast, A. 1980. Food and feeding relationships of young fish in the first weeks after the beginning of exogenous feeding in Lake Opinicon, Ontario. Environmental Biology of Fishes 5:305–314. Keast, A. 1985. The piscivore feeding guild in small freshwater ecosystems. Environmental Biology of Fishes 12:119–129. Mills, E. L., and J. L. Forney. 1981. Energetics, food consumption, and growth of young yellow perch in Oneida Lake, New York. Transactions of the American Fisheries Society 110:479–488. Mills, E. L., R. Sherman, and D. S. Robson. 1989. Effect of zooplankton abundance and body size on growth of age0 yellow perch (Perca flavescens) in Oneida Lake, New York, 1975–1986. Canadian Journal of Fisheries and Aquatic Sciences 46:880–886. Ney, J. J., and L. L. Smith, Jr. 1975. First-year growth of the yellow perch, Perca flavescens in the Red Lakes, Minnesota. Transactions of the American Fisheries Society 104:717–725. Pycha, R. L., and L. L. Smith, Jr. 1955. Early life history of the yellow perch, Perca flavescens (Mitchill) in the Red Lakes, Minnesota. Transactions of the American Fisheries Society 84:249–260.
Sherwood, G. D., I. Pazzia, A. Moeser, A. Hontela, and J. B. Rasmussen. 2002. Shifting gears: enzymatic evidence for the energetic advantage of switching diet in wild-living fish. Canadian Journal of Fisheries and Aquatic Sciences 59:229–241. Turesson, H., A. Persson, and C. Bro¨nmark. 2002. Prey size selection in piscivorous pikeperch Stizostedion lucioperca includes active prey choice. Ecology of Freshwater Fish 11:223–233. Welker, M. T., C. L. Pierce, and D. H. Wahl. 1994. Growth and survival of larval fishes: roles of competition and zooplankton abundance. Transactions of the American Fisheries Society 123:703–717. Werner, E. E., and J. F. Gilliam. 1984. The ontogenetic niche and species interactions in size-structured populations. Annual Reviews Ecology and Systematics 15:393–425. Werner, E. E., and D. J. Hall. 1988. Ontogenetic habitat shifts in bluegill: the foraging rate-predation risk trade-off. Ecology 69:1352–1366. Whiteside, M. C., C. M. Swindoll, and W. L. Doolittle. 1985. Factors affecting the early life history of yellow perch, Perca flavescens. Environmental Biology of Fishes 12:47–56. Wu, L., and D. A. Culver. 1992. Ontogenetic diet shift in Lake Erie age-0 yellow perch (Perca flavescens): a size-related response to zooplankton density. Canadian Journal of Fisheries and Aquatic Sciences 49:1932–1937.