In facts, they will employ these devices for ac calls. This new trend will drive both ...... the center frequency of the first passband is 10 Hz, then there will be narrow ...
IGI Global Microsoft Word 2007 Template Reference templateInstructions.pdf for detailed instructions on using this document.
Opportunistic detection methods for emotion-aware smartphone applications Igor Bisio, Alessandro Delfino, Fabio Lavagetto, Mario Marchese DITEN Department, University of Genoa
Abstract Currently human-machine interaction is performed by devices such as the keyboard, the touch-screen or speech to text applications. For example, a speech-to-text application is software which allows the device to translate the spoken words into text. These tools translate explicit messages but ignore implicit messages, such as the emotional status of the speaker, filtering out a portion of information available in the interaction process. This chapter focuses on emotion detection. An emotion aware device can also interact more personally with its owner and react appropriately according to the user mood, making the user-machine interaction less stressful. The chapters gives the guidelines for building emotion aware smartphone applications in an opportunistic way, i.e., without the user collaboration. In general, smartphone applications might be employed in different contexts, therefore the to-be-detected emotions might be different.
Introduction In recent years the computational capabilities of mobile devices, such as smartphones, has exponentially increased, giving the possibility of a more personal human-machine interaction. Moreover, smart portable devices, such as smartphones, can collect a lot of data from the surrounding environment opportunistically, i.e. without needing any collaborative behavior by the user, and exploit the so obtained information to adapt its behavior to the context, enabling the development of the so-called Context-Aware applications. The fastest and most personal method of interaction is the speech, furthermore, the speech is a signal that the smartphone can exploit opportunistically. Through the speech the mobile device can identify the speaker, its gender and, if there is more than one speaker, the number of the speakers (Agneessens, Bisio, Lavagetto, Marchese, & Sciarrone, 2010). Currently human-machine interaction is performed by devices such as the keyboard, mouse, the touch-screen and, especially in new generation smartphones, by speech to text applications, software which allow the device to translate the spoken words into text. These kinds of tools translate explicit messages but ignore implicit messages, such as the emotional status of the user, filtering out a portion of information available in the interaction process. Automatic emotion detection can be used in a wide range of applications. In teleconferences adding an explicit reference of the emotional state of the speaker can add useful information that can be lost due to the reduced naturalism of the medium. An emotion aware device can also interact more personally with its owner and react appropriately according to the user mood, making the user-machine interaction less stressful. For example, it has been proven (Burkhardt, 2005) that often users get frustrated by talking to machines and hang up without having the possibility to express their anger in some way, an emotion aware system can recognize user's mood and handle this problem. The smart device can also automatically adapt a playlist in order to play the better suited song for the particular mood detected in the user (Sandor Dornbush, 2005). In life-simulation videogames, where the user have to control one or more virtual lifeforms the experience can be enhanced with an automatic emotion sensitive system capable to detect the emotional state of the player.
IGI Global Microsoft Word 2007 Template Reference templateInstructions.pdf templateInstruc for detailed instructions on using this document.
During the next years, several experts predict a significant growth in the market for converged mobile devices that simultaneously include voice voice-phone phone function with multimedia, PDA and game applications. ons. These devices will allow expanding the current market by adding new types of consumers. In facts, they will employ these devices for activities very different with respect to classical mobile phone calls. This new trend will drive both Original Equipm Equipment ent Manufacturers (OEMs) and Carriers to meet this growth by providing smart devices and new services for the new class of users. In more detail, in 2003 converged mobile devices, also termed smartphones, were forecast to make up three percent of worldwide mobile phone sales volume. Nowadays, the smartphone market is continuing to expand at triple digit year year-over-year year growth rates, due to the evolution of voice-centric voice converged mobile devices, mobile phones with applications processors and advanced operating operati systems supporting a new range of data functions, including application download and execution. In practice, smartphones will play a crucial role to support the users’ activities both from the
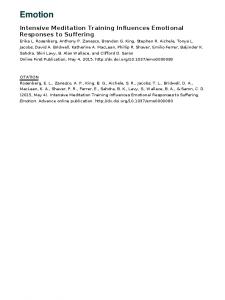
Figure 1: Scheme of a general emotion recognition procedure professional and private viewpoint. Operatively, the emotion recognition is a statistical pattern classification problem; a general speech emotion recognition procedure is shown by the flowchart in Figure 1. The speech is recorded by the microphone of the smartphone and the raw audio data is passed to the Feature E Extraction block. Feature extraction consists in simplifying the amount of resources required to describe a large set of data accurately. In the classification stage machine learning methods are applied on the selected speech feature to recognize the emotional nal states in the speech. Speech emotion detection has some limitations, one of the most important is the lack of emotional speech database. There are only few public databases containing emotion examples and each of them is made of only one or, in some sporadic poradic cases, two languages. Emotion is strongly multi multi-modal, emotions can be expressed through various different channels. Some emotions, like, for example, the disgust, can be easily detected from the facial expressions while they are very difficult to detect from the voice. Smartphones From the hardware viewpoint, the first generation of analog cell phones was composed of devices consisted of a discrete single CISC-based CISC based microcontroller (MCU) core. Its task concerned the control of several analog circuits. uits. The migration from analog to digital technology created the necessity of Digital Signal Processor (DSP) core. In facts, recent architectures include it, creating a Dual-core Dual core system consisting of an MCU and a DSP, which are currently integrated in a single single ASIC. Actually, the aforementioned dual dual-core architectures did not support the feature requirements of converged devices because they were designed only to support communications tasks. As a result, today’s smartphone architecture requires additional processing resources. Currently, a discrete application processor is included in the architecture together with the discrete dual-core core cellular baseband integrated circuit. All processors require their own memory system including RAM and ROM, which comple complete te the computation architecture of a smartphone. Together with the above described architecture, recent mobile device include wireless networking interfaces, such as Wi-Fi Fi and Bluetooth technology. Each added communication interface, in several
IGI Global Microsoft Word 2007 Template Reference templateInstructions.pdf for detailed instructions on using this document.
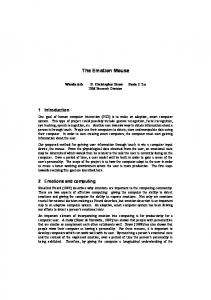
cases very useful also to provide Context-Aware services, requires additional modules for each function, including radio transceivers, digital base-bands, RAM and ROM components within the module. In practice, modern smartphones are system architectures having a minimum of three, or as many as six, processors, each with its own dedicated memory system, peripherals, clock generator, reset circuit, interrupt controller, debug support and inter-processor communications software. Obviously, all the architecture needs of a power supply system. A logical scheme of the described smartphone architecture is reported in Figure 2. Concerning the software, the Cellular Baseband block reported in Figure 2, typically divides its tasks in the same way, in particular the DSP performs signaling tasks and serving as a slave processor to the MCU, which runs the upper layers (L2/L3) functions of the communication protocol stack. On one hand, the Layer 1 signal processing tasks, handled by the DSP, include equalization, demodulation, channel coding/decoding, voice codec, echo and noise cancellation. On the other hand, the MCU manages the radio hardware and moreover realizes the upper layers functions of the network protocol stack, subscriber identity, user interface, battery management and the nonvolatile memory for storage for the phone book. The Application Processor block, equipped by an MCU, manages the User Interface and all the applications running on a smartphone. In this Hardware/Software architecture, it is worth noticing that performance conflict between the communication protocol tasks and multimedia workloads may have performance conflicts because they share the smartphone resource. In more detail, this problem, only mentioned because out of the scope of the chapter, requires a sophisticated internetworking approach and, in particular, advanced inter-processor communications approaches aimed at increasing processing availability and at reducing overheads, and power consumption, which results in reduced battery life and usage time for the end user.
IGI Global Microsoft Word 2007 Template Reference templateInstructions.pdf templateInstruc for detailed instructions on using this document.
Figure 2: Logical scheme of smartphones’ hardware architecture from (Bisio, 2011) A possible low-cost cost solution to solve such problem may be to merge the Application Processor and the Cellular Baseband blocks into a single ASIC consisting of two or three cores. This approach eliminates the performance conflict between the communication communication protocol and multimedia tasks but the complexity of the inter-processor processor communication is not reduced, significantly. In the recent few years, mobile network providers and users will have the new opportunity to come up with more advanced and inn innovative context-aware aware services based on the real-time real knowledge of the user’s surroundings. In facts, context data must be acquired from the smartphone’s audio environment. In general, the classification of an audio environment or the correspondence betwee between two or more audio contexts and the number and the gender of active speakers near the smartphone together with other possible context features, can be useful information employed to obtain helpful contents and services directly by the mobile users’ devices. device Description of emotions Human beings and animals have to deal with emotions in everyday life. People often use expressions like “I’m happy!”, “It’s sad but true” or “I love you” in order to express a sensation that is generally called “emotion”. Every one of us knows the great impact that a statement such as those reported may have on our interpersonal relations or social life. Our emotional state often affects our way of approaching people and, more generally, animals or things. Furthermore, the externalization extern of this interior state can change the way in which other people approach to us. In addiction, is well known that “emotions” have great influence on our actions and opinions. For example, a scared person rarely is able to control itself in front off a danger or a threat. Despite its socio socio-cultural cultural importance, the concept of “emotion” represents a particularly thorny problem. Even though the term is used very frequently, the question “What is an emotion?” rarely generates the same answer from different different individuals, scientists or laymen alike. One of the most challenging issues of emotion detection is the description of what an emotion is and how it can be classified. Since the emotional state of a person is highly subjective, it is operatively very difficult fficult to find an objective and universal definition of “emotion”. The emotion
IGI Global Microsoft Word 2007 Template Reference templateInstructions.pdf for detailed instructions on using this document.
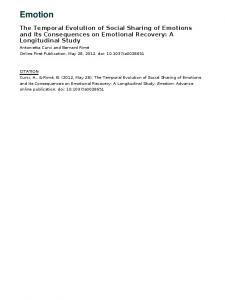
classification problem was scientifically addressed for the first time by Descartes in the treatise Passions of the Soul in 1649. In this work Descartes defines six basic emotions called “primitive passions”: wonder, love, hatred, desire, joy and sadness. Along with these primary emotions Descartes also accepts “an unlimited number” of further, specific passions, called secondary passions, which are combinations of the six primitive passions in different proportions. The secondary emotions are blend of the innate basic emotions much in the way that different colors can be created by mixing red, blue and green, for this reason this classification is known as palette theory. This kind of classification was also adopted in the 19th century when Charles Darwin's (Darwin, 1872)and William James' (James, 1884) theories of emotions have been proposed. Darwin, in his work, highlights the universal nature of expressions: "...the young and the old of widely different races, both with man and animals, express the same state of mind by the same movements". On this assumption Darwin classifies the emotions that are innate and can be recognized in each human culture population, and calls them “basic”. Six basic emotions are distinguished: happiness, surprise, fear, disgust, anger and sadness. This type of classification had been widely used by the scientists, Ekman in 1972 (Ekman P., 1971) codified six basic or primary emotions in facial expressions: anger, disgust, fear, happiness, sadness and surprise. A similar widely accepted classification is the one provided by Plutchik (Plutchik, 2001). He defines 8 basic emotions and provides a graphic representation of them, which is the wheel shown in Figure 3.
IGI Global Microsoft Word 2007 Template Reference templateInstructions.pdf templateInstruc for detailed instructions on using this document.
Figure 3: Plutc Plutchik's Wheel of Emotions The emotions defined by Plutchik are: anger, anticipation, joy, trust, fear, surprise, sadness and disgust. Plutchik's wheel representation representation is formed by 4 couple of bipolar emotions, joy is opposed to sadness, anger to fear, anticipation to surprise and disgust to trust.
IGI Global Microsoft Word 2007 Template Reference templateInstructions.pdf templateInstruc for detailed instructions on using this document.
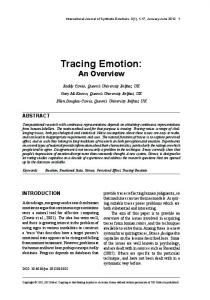
Figure 4: First two layers of Parrot's emotion classification A tree-structured structured list was proposed by Parrot in 2001 (Parrott, 2001),, where the firs first level is composed by six primary emotions (love, joy, surprise, anger, sadness, fear). The first two layers of Parrot's classification are shown in Figure 4. This classification differs from the others previously
IGI Global Microsoft Word 2007 Template Reference templateInstructions.pdf templateInstruc for detailed instructions on using this document.
described because the secondary emotions are derivation of the primary ones instead of being combination of them.
Figure 5: Activation Activation-evaluation space Some scientists refused to engage this irresolvable dispute on the number and type of emotions, producing an alternative to the categorical classification: the dimensional classifica classification, a more flexible solution to the problem of the representation of the emotional states. These dimensions include evaluation, activation, control, power, etc. In particular a 2-D 2 D representation of emotions called activation-evaluation space (Cowie, et al., 2001) has a long history in psychology, Figure 5. Research from Darwin forward has recognized that emotional states involve dispositions to act in certain ways. A basic way of reflecting that theme turns out to be surprisingly surprisingly useful. States are simply rated in terms of the associated activation level, i.e., the strength of the person’s disposition to take some action rather than none. The axes of activation-evaluation evaluation space reflect those themes. The vertical axis shows activation act level and the horizontal axis evaluation.
IGI Global Microsoft Word 2007 Template Reference templateInstructions.pdf for detailed instructions on using this document.
The most recent classification merges the categorical and the dimensional classification: the cube representation proposed by Hugo Lövheim (2011) (Lövheim, 2012). In this representation eight basic emotions are ordered in an orthogonal coordinate system of the three main monoaminergic axes. The axes represent serotonin (5-HT, 5-hydroxytryptamine), dopamine (DA) and noradrenaline (NE), and each end
Figure 6: Hugo Lövheim cube of emotions of the arrows represents low and high levels of signaling respectively. Serotonin, noradrenaline and dopamine are the most important monoamine neurotransmitters. Many studies from different research fields support the belief that all three of the monoamines, serotonin, dopamine and noradrenaline are essential in the control of behaviors and emotions, and each of them is involved in a different behavior or emotion. The serotonin axis seems to represent aspects such as self-confidence, inner strength and satisfaction. The dopamine axis has been found to be involved in reward, motivation and reinforcement. Noradrenaline has been coupled to the fight or flight response and to stress and anxiety, and appears to represent an axis of activation, vigilance and attention. From this the 3-D representation shown in Figure 6 is derived. The basic emotions which label the axis are derived by Tomkins affect theory (Tomkins, 1962). Speech emotions Speech carries two different kind of emotion information: one refers to what is said and it is the task of recognizing the emotion from the explicit message of the speech, the second is the implicit message and it consists on how it is said and it is the task of detecting the emotion by the pitch, the intonation and the prosody of the speaker. The emotion recognition from explicit part of the speech can be brought back to a text-based emotion detection problem (Kao, Liu, Yang, Hsieh, & Soo, 2009) applying speech to text algorithms. Problems of recognizing emotions in text can be divided in three categories: 1) Keyword-based detection: the emotions are detected by the presence of some keywords in the input text; 2) Learning-based detection: emotions are detected based on previous training results which permit to collect specific statistic through learning methods; 3) Hybrid detection: emotions are detected exploiting the combination of detected keywords, learned patterns, and other supplementary information.
IGI Global Microsoft Word 2007 Template Reference templateInstructions.pdf for detailed instructions on using this document.
Keyword-based emotion detection serves as the starting point of textual emotion recognition. Once the set of emotion labels (and related words) is constructed, it can be used exhaustively to examine if a sentence contains any emotions. This type of emotion detection has the pro that it is very straightforward and easy to use but it has some limitations: the definition of the keywords meaning can be ambiguous, the same word could change its meaning according to different usage and context; a keywordbased detector can not recognize sentences which do not contain keywords. This kind of approach is totally based on the set of emotion keywords. Therefore, sentences without any keyword would imply they do not contain any emotions at all; another limitation is that the keyword-based approach does not take into account of linguistic information. Learning-based approach consists in classifying the input texts into different emotions using a previously trained classifier. This approach has some limitations, though learning-based methods can automatically determine the probabilities between features and emotions, learning-based methods still need keywords, but just in the form of features. The cascading problems would be the same as those in keyword-based methods. Moreover, most learning-based detector can classify sentences into two classes, positive and negative. Since keyword-based methods and naive learning-based methods could not acquire satisfactory results, some systems use a hybrid approach by combining both or adding different components, which help to improve accuracy and refine the categories. Semantics and attributes are extracted from the text and then associated to the emotions. These emotion association rules replace the keywords as features in the learning-based methods. However, the most challenging part is the detection of the implicit message of the speech, the emotions that the speaker expresses using prosody, intonation, pitch, etc., following sessions focus on it. Emotional databases The main problem in emotion detection is that there is not a unique commonly recognized database but many different databases. As previously said, the definition of emotions is not unique, therefore the number and type of emotions labeled for each database differs. Works of emotion detection have been proposed by researchers from all over the world, producing databases composed by speakers of different languages (Ververidis, 2003). Database containing emotion-labeled utterances in English and German languages are the most common but there are also databases composed by Spanish, Japanese, Dutch, French, Hebrew, Sweden, Danish, Slovenian, Chinese and Russian utterances. Another important difference among the database is the way the emotions are collected: the emotions can be natural or simulated. Database of spontaneous emotions are rare because authentic affective expressions are difficult to collect and, also, labeling them is not a trivial operation. Database of acted emotions are the most common, they can be composed in two ways: cutting particularly emotional movies' parts or directly recording an actor simulating a certain emotion. Since the way to express the emotions varies from an individual to another, the databases are composed by many speakers' utterances. For the same reason emotional speech databases usually contain both genders recordings. For choosing an existing database or for developing a new one is necessary to consider four main issues (E. Douglas-Cowie, 2003): scope, naturalness, context and used descriptors. Scope includes several kind of elements like notably number of different speakers, spoken language, type of dialect (e.g. standard or vernacular), gender of speakers, considered types of emotional state, tokens of a given state, social/functional setting. These kinds of variation are potentially important for any attempt to generalize, and their importance depends on research goals. There do seem to be facial signs of emotion that are effectively universal (P. Ekman, 1994), and there are reasons to expect that the same is true of at least some vocal signs (Stevens, Emotions and speech: Some acoustical correlates, 1972). A recent review of the literature (Cowie, et al., 2001) shows that although some features are
IGI Global Microsoft Word 2007 Template Reference templateInstructions.pdf for detailed instructions on using this document.
remarkably consistent across studies, others are quite variable. Gender is recognized as a key sociolinguistic variable (Trudgill, 1983). Hence, considering the importance of gender-dependency in the emotion recognition, several studies use two different databases: one containing only the sentences recorded by males, and the other containing only the sentences recorded by females (J. Rong, 2009). Some studies used also a third database containing only the sentences recorded by children. The same is true for social setting, i.e. the relationship that governs interaction between speaker and listener. These observations suggest that the emotional scope of databases needs to be thought through carefully. Since standard lists contain more than a hundred words for (non-basic) emotions (Cowie, et al., 2001), the scope may have to be very large. It is presumably possible to work with a smaller number of ‘landmark’ states and interpolate, but establishing a set of landmarks that is appropriate for speech research is an empirical task, which itself depends on access to data that spans the known range of emotional states. The number of subjects studied has tended to be small, so that it is difficult to gauge the extent of inter-subject variability. The possibility of gender effects compounds the problem. It is also difficult to gauge how many of the relationships that the literature describes may be specific to single relatively homogeneous cultural milieu. Naturalness refers to the way the utterances are collected, sentences can be natural, simulated or acted, and elicited or induced. Natural expressions are spontaneous sentences collected from a real-world situation where users are not under obvious observation and are free to express emotions naturally, as they would in an everyday situation. Simulated expressions are sentences expressed by professional or non-professional actors and actresses. Elicited expressions are sentences in which naive users are presented with scenarios that induce the required emotional response. Acted speech from professionals is the most reliable for emotional speech recognition because professionals can deliver speech colored by emotions that possess a high arousal, i.e. emotions with a great amplitude or strength. It is empirically apparent that acted emotions are quite different from natural emotions as they measure significantly differently on the use of various analytical tools (as well as by human judgment). Moreover authentic affective expressions are difficult to collect because they are relatively rare and short lived. The easiest way to collect emotional speech is then to have actors simulate it. The difficulty with that approach is that strikingly little is known about the relationship between acted data and spontaneous, everyday emotional speech. Increasing evidence suggests that deliberate behavior differs in visual appearance, audio profile, and timing from spontaneously occurring behavior (Z. Zeng, 2009). For example, Whissell (Whissel, 1989) shows that the posed nature of emotions in spoken language may differ in the choice of words and timing from corresponding performances in natural settings. There are many reasons to suspect that there are systematic differences between acted and natural emotional speech. Acted speech is often ‘read’, not spoken, and read speech is well known to have distinctive characteristics (Johns-Lewis, 1986). Neither the words nor the phrasing are typically chosen to simulate emotional speech. The typical form is a noninteractive monologue, and so interpersonal effects are not represented. It would therefore be unsurprising if attempts to express emotion under these very atypical circumstances had very atypical features. The price of naturalness is lack of control. Emotion has an unpredictability that makes it difficult to collect samples of people in a target state, whether it is induced or spontaneous. Particularly if it is spontaneous, identifying the emotion that is being expressed becomes a substantial issue. A long-term solution to these problems may well be ‘bootstrapping’, i.e. using truly natural material to guide the production of material that is acted, but genuinely close to nature, as used in (S. Abdennadher, 2007). Research has relied relatively heavily on material that is acted and involves read, non-interactive material. However, there are also datasets that include fully natural speech in emotion-related states. A considerable proportion of the work involves intermediate strategies, i.e. use actors to read material that lends itself to the required emotion. The studies that use data with elicited emotion making recordings while the subject faces a machine, e.g. during telephone calls to Automatic Speech Recognition (ASR) call centres (C. M. Lee and S. S. Narayanan, 2005), or when the subjects are talking to fake-ASR machines, which are operated by a human (Wizard-Of-OZ method, WOZ) (Fischer, 1999). Giving commands to a robot is another idea
IGI Global Microsoft Word 2007 Template Reference templateInstructions.pdf for detailed instructions on using this document.
explored (A. Batliner, 2004). Speech can be also recorded during imposed stressed situations. For example when the subject adds numbers while driving a car at various speeds (R. Fernandez and R. Picard, 2003), or when the subject reads distant car plates on a big computer screen (Hansen H. J., 1999). In the video kiosk settings (A. J. O’Toole et al., 2005) (Bartlett, 2007) (N. Sebe, 2004) the subjects’ affective reactions are recorded while the subjects are watching emotion-inducing videos. The data with natural emotion can be instead recorded from radio or television (C. Clavel, 2004) (B. Schuller, 2005), or from human-human conversation scenarios include face-to-face interviews (M. S. Bartlett, 2005) (E. Douglas-Cowie, 2003) (J. Hirschberg, 2005) (G. I. Roisman, 2004), phone conversations (Vasilescu, Reliability of Lexical and Prosodic Cues in Two Real-Life Spoken Dialog Corpora, 2004), and meetings (S. Burger, 2002). Furthermore, speech from real life situations such as oral interviews of employees when they are examined for promotion can be also used (Hansen M. R., 2002). Parents talking to infants, when they try to keep them away from dangerous objects can be another real life example (McRoberts, 2003). Interviews between a doctor and a patient before and after medication were used in (D. J. France, 2000). Context is important for listeners because they use it to determine the emotional significance of vocal features (Cauldwell, 2000) (D. R. Ladd, 1986). Hence if research aims to understand human performance, or to match it, it needs databases that contain evidence on the way vocal signs relate to their context. Emotion is strongly multimodal in the sense that signs may appear in various different channels. However, not all types of sign tend to be available together, because context will affect the signs that are relevant or accessible. Four broad types of context can be distinguished: semantic context (emotionally marked and significant words), structural context (structural characteristics of the utterances like long or short phrases, repetitions, and interruptions), intermodal context (data from other sources in addition to the speech), temporal context (emotion ebbs and flows that speech involves over time). Much of the existing material is singularly devoid of context: purely audio recordings of short utterances with neutral semantic content and a preset linguistic structure. However, several projects have addressed contextrelated issues directly or indirectly, and they help to highlight significant issues. The issue of temporal context is not often considered explicitly, but the way naturalistic studies select units for coding implies intuitions about the patterns that need to be considered. Constructing a database requires techniques for describing the linguistic and emotional content on one hand, and the speech on the other. The requirements for accurate labelling of emotional content may interact with naturalness. In terms of speech descriptors, two issues stand out. First, coding needs to acknowledge the full range of features involved in the vocal expression of emotion, including at least voice quality, prosody and non-linguistic features such as laughter, crying, etc. Second, it needs to describe the attributes that are relevant to emotion. As previously said, three main types of scheme could reasonably be used to describe the emotional content of a database: categorical, continuous, and appraisalbased. Categorical schemes involve assigning terms like anger, happiness, fear, and so on (O’Toole, 2005) (Piccardi, 2006) (A. Batliner, 2004) (G. I. Roisman, 2004), or only two labels (e.g. Positive, Negative) depending on the future application (Devillers, 2005) (S. Burger, 2002) (C. M. Lee and S. S. Narayanan, 2005). Numerous teams have tried to label relatively naturalistic material using schemes based on established psychological lists of emotions. It seems fair to say that the most used option is to consider a relatively small set of ‘basic’ emotions. It reflects the popular theory that a few universal types of emotions underlie all the emotions that a person can feel every day. A more radical alternative is to use the long-established psychological concept of emotion dimensions (E. Douglas-Cowie, 2003). Statistically, most of the information contained in verbal labelling can be expressed in terms of two dimensions, activation and evaluation. A finer theoretical tool comes from appraisal theory, which offers a descriptive framework for emotion based on the way the person involved experiences the events, things, or people at the focus of the emotional state. The relative merits of the three types remain to be resolved. Speech descriptors vary enormously with different studies. As a result, it is difficult to form a cohesive summary of the dimensions on which speech varies.
IGI Global Microsoft Word 2007 Template Reference templateInstructions.pdf for detailed instructions on using this document.
Feature extraction Due to the physiology of the human vocal tract, human speech is highly redundant and possesses several speaker-dependent parameters, such as pitch, speaking rate and accent. An important issue in the design of a speech emotion recognition system is the extraction of suitable features that efficiently characterize different emotions. Although there is plenty of works on automatic speech emotion detection (Moataz El Ayadi, 2011), there is not a feature believed to be the best for this aim. The speech signal is not stationary, it is very common to divide the signal in short segments called frames, within which the speech signal can be considered as stationary. The speech process can be considered stationary for intervals of 10-20ms. If a feature is calculated on each frame is called local, otherwise, if it is calculated on the entire utterance is named global. There is not agreement between researchers on which of local and global features are more suitable for speech emotion recognition. Speech features can be grouped into four categories: i) continuous features, ii) qualitative features, iii) spectral features, iv) Teager Energy Operator (TEO) based features. Among continuous features can be distinguished pitch-related, formants, energy-related, timing and articulation features. Qualitative features are global features and are related to the quality of the speaker's voice, these features can be grouped in four sub-categories: voice level; voice pitch; phase, phoneme, word and feature boundaries; temporal structures. Spectral feature can be global or local and they can be extracted by Linear Predictor Coefficients (LPC), One-Sided Autocorrelation Linear Predictor Coefficients (OSALPC), Mel-frequency Cepstrum coefficients (MFCC). TEO is a nonlinear operator originally developed with the supporting evidence that hearing is the process of detecting energy. TEO based features are local feature that are proven to have good performances when the aim is to detect high energy emotions such as angry. Continuous features Most researchers believe that prosody continuous features such as pitch and energy convey much of the emotional content of an utterance. Much information about the emotional state of the speaker can be inferred through the tone of his voice or its volume. Pitch-based features Speech consists of pressure waves created by the airflow through the vocal tract. The vocal folds in the larynx can open and close quasi-periodically, the result is that the voiced speech is quasi-periodic. This relative periodicity is often referred to as pitch. Strictly speaking the term pitch refers to the tone perceived by auditory. The fundamental frequency ( ) of a periodic signal is defined as the reciprocal of its period and is well correlated with the perceived pitch. The contour (i.e., the temporal evolution of the pitch inside one utterance (J. Ang, 2002)) has been shown to vary depending on the emotional state being expressed. Cowan (Cowan, 2006) discovered that neutral or unemotional speech has a much narrower F0 range than that of emotional speech, and found that as the emotional intensity is increased, the frequency and duration of pauses and stops normally found during neutral speech are decreased inducing alteration on the pitch (Arnott, 1993). More specifically, angry speech typically has a high median, wide range, wide mean inflection range, and a high rate of change (Pronovost, An experimental study of the pitch characteristics of the voice during the expression of emotion, 1939). Nogueiras et al. (A. Nogueiras, 2001)sustain that the pitch has information about emotion, because it depends on the tension of the vocal folds and the sub glottal air pressure. The glottal volume velocity denotes the air velocity through glottis during the vocal fold vibration. High velocity indicates speech like joy or surprise. Fear was discovered to have a high pitch median, wide range, medium inflection range (E. Douglas-Cowie, 2003) (Pronovost, An experimental study of the pitch characteristics of the voice during the expression of emotion, 1939) (Stevens, Emotions and speech: Some acoustical correlates, 1972), and increased pitch level is also apparent (Fonagy, A new method of investigating the perception of prosodic features, 1978). Conversely to fear exhibiting a wide range, there are reports that fear instead has a narrow
IGI Global Microsoft Word 2007 Template Reference templateInstructions.pdf for detailed instructions on using this document.
F0 range (Magdics, Emotional patterns in intonation and music, 1963) and low speech rate (E. DouglasCowie, 2003). Contrasting these more excited emotions are sadness and disgust which typically have lower physiological activation levels. Sadness is shown to yield lower pitch mean and narrow range (Skinner, 1935) (Davitz, Personality, perceptual, and cognitive correlates of emotional sensitivity, 1964.) (Fonagy, Emotions, voice and music, 1981) (W. F. Johnson, 1986). More recently, Pereira has report that there are cases where there is no change in these features (Pereira, 2000,).Other studies have shown that pitch frequency also affects the number of harmonics in the spectrum. Less harmonics are produced when the pitch frequency is high. More harmonics are expected when the pitch frequency is low. It seems that the harmonics from the additional excitation signals due to vortices are more intense than those caused by the pitch signal (D. Cairns, 1994). Williams and Stevens (Stevens, Emotions and speech: Some acoustical correlates, 1972) discovered vowels of angry speech to have the highest F0. Fonagy (Fonagy, A new method of investigating the perception of prosodic features, 1978) found that angry speech exhibits a sudden rise of F0 in stressed syllables and the F0 contour has an “angular” curve. Frick (Frick, 1986) postulated that frustration, which has similar but less extreme physiological causes as anger, has a higher fundamental frequency than neutral speech. Scherer (Scherer K. R., Adding the affective dimension: a new look in speech analysis and synthesis, 1996) describes anger as having “an increase in mean pitch and mean intensity”. Downward slopes are also noted on the F0 contour. In a number of studies, Scherer and his collaborators have made use of speech re-synthesis to systematically manipulate F0 level, contour variability and range, intensity, duration, and accent structure of real utterances. They discovered narrow F0 range signaling sadness and wide F0 range being judged as expressing high arousal, negative emotions such as annoyance or anger. Breazeal and Aryananda (Aryananda, 2002) found that prohibitions or warnings directed at infants are spoken with low pitch and high intensity in “staccato pitch contours”. Cowan (Cowan, 2006) and Fonagy and Magdics (Magdics, Emotional patterns in intonation and music, 1963) found that happiness expressed in speech, like anger, has an increased pitch mean and pitch range. Additionally, studies of disgust report both an increase in mean F0 and a decrease in mean F0 (E. Douglas-Cowie, 2003). Many values related to
variations have been used for emotion recognition:
TABLE 1 -related features Feature
Papers
F0 mean
(Vasilescu, Reliability of Lexical and Prosodic Cues in Two Real-Life Spoken Dialog Corpora, 2004) (Litman, 2004) (J. Ang, 2002) (F. Dellaert, 1996) (Scherer K. R., Vocal Affect Expression: A Review and a Model for Future Research, 1994) (M. Lugger, Robust estimation of voice quality parameters under real world disturbances, 2006) (Pieraccini, 2002)
F0 maximum
(Vasilescu, Reliability of Lexical and Prosodic Cues in Two Real-Life Spoken Dialog Corpora, 2004) (Litman, 2004) (J. Ang, 2002) (F. Dellaert, 1996) (Pieraccini, 2002)
F0 minimum
(Vasilescu, Reliability of Lexical and Prosodic Cues in Two Real-Life Spoken Dialog Corpora, 2004) (Litman, 2004) (J. Ang, 2002) (F. Dellaert, 1996) (Scherer T. J., 2000) (Pieraccini, 2002)
F0 range (F0 maximum – F0 minimum)
(Vasilescu, Reliability of Lexical and Prosodic Cues in
IGI Global Microsoft Word 2007 Template Reference templateInstructions.pdf for detailed instructions on using this document.
Two Real-Life Spoken Dialog Corpora, 2004) (Izard, 1977) (F. Dellaert, 1996) (Pieraccini, 2002) F0 median
(Litman, 2004) [2.110] (Pieraccini, 2002)
F0 standard deviation
(Litman, 2004) (J. Ang, 2002) (F. Dellaert, 1996) (M. Lugger, Robust estimation of voice quality parameters under real world disturbances, 2006) (Pieraccini, 2002)
F0 variability
(Scherer T. J., 2000)
Medium Frequency Ratio (MFR)
(J. Ang, 2002)
Low Frequency Ratio (LFR)
(J. Ang, 2002)
High frequency ratio (HFR)
(J. Ang, 2002)
Average pitch slope
(J. Ang, 2002)
F0 first quartile
(Litman, 2004) (M. Lugger, Robust estimation of voice quality parameters under real world disturbances, 2006)
F0 third quartile
(Litman, 2004) (M. Lugger, Robust estimation of voice quality parameters under real world disturbances, 2006)
F0 regression coefficient
(Litman, 2004)
F0 slope in the voiced segments
(Litman, 2004) (Scherer K. R., Vocal Affect Expression: A Review and a Model for Future Research, 1994)
Maximum cross-variation of F0 between two adjoining (Litman, 2004) (F. Dellaert, 1996) voiced segments Maximum cross-variation of F0 with each voiced segment
(Litman, 2004)
First derivate of F0
(Wei, 2005)
Second derivate of F0
(Wei, 2005)
Amplitude variation in correspondence of F0
(M. Lugger, Robust estimation of voice quality parameters under real world disturbances, 2006)
Amplitude in correspondence of an integer multiple of (M. Lugger, Robust estimation of voice quality F0 parameters under real world disturbances, 2006) There is a wide variety of algorithms for estimation, basically divided in two families: timedomain algorithms, which operate directly on the speech audio samples, and frequency-domain algorithms, which operate on the spectrum of the speech signal. Fundamental frequency estimators are strongly context-specific, algorithms that work efficiently with music may have poor performance with speech and vice-versa. There are many ways to estimate the fundamental frequency of a signal, with different complexity and accuracy (Gerhard, 2003). Below a summary of detectors is presented.
IGI Global Microsoft Word 2007 Template Reference templateInstructions.pdf for detailed instructions on using this document.
Time-event detection The idea behind time-event detectors is that, if the signal is periodic, there are some kinds of periodic events that can be counted. The frequency of these events in a second is an estimation of the fundamental frequency. The simplest event to count is when the waveform crosses the zero line. This measure is called Zero-Crossing Rate (ZCR). ZCR is very easy to implement and has a very low computational complexity but has some evident limitations: if the spectral power of the signal is concentrated around its fundamental frequency the waveform crosses the zero line twice per period, but if higher spectral frequencies are present there may be more than two zero-crossing per cycle, leading, therefore, to a wrong estimation. Another time-event based way to estimate the fundamental frequency is counting the number of positive (or negative) peaks of the waveform per second. The theory behind this detector is that the waveform has one maximum (or minimum) value each cycle, counting the rate of these values will determine . This approach has the same limitations of the ZCR, it is possible that a waveform can have more than a local maximum per cycle, especially when the spectral power is not concentrated around its fundamental frequency. If a waveform is periodic also its slope is periodic, sometimes ZCR and peak rate are more informative if counted on the waveform slope or their calculation may be more robust. Time-event rate methods present some positive aspects: they are easy to understand and to implement and, crucial for their application on mobile devices, their complexity is very low, so requiring very low power consumption. The main limitation of these algorithms is their weakness. A waveform can have more than one zero-crossing or peak per cycle misleading this algorithm to a wrong estimation. If the nature of the signal is known these methods can be tailored in order to be more robust, for example, inserting a low pass filter before the estimator in order to cut off the unwanted harmonics. Autocorrelation The cross-correlation is a measure of similarity between two functions. The similarity is measured for each time shift between the beginnings of the two waveforms. The autocorrelation of a sequence x( n) is a measure of similarity between a function and its all possible delayed replicas (1). (1) The autocorrelation function of periodic signals has an interesting property: the autocorrelation function is itself periodic. When the time shift increases to half of the period of the signal the autocorrelation function present a minimum because the waveform is out-of-phase with its delayed replica, but after this point the autocorrelation function rises reaching a maximum as the time shift equals its period. The first peak of the autocorrelation function ( 0) indicates the period of the signal and is an estimation of its fundamental frequency. This method presents some problems when higher harmonics are present: the autocorrelation presents lower peaks in correspondence of the higher harmonic period and a higher peak at the fundamental period. It would be necessary distinguish between “high” and “low” peaks. From (1) the autocorrelation computation complexity might seem high, but it can be calculated in the frequency domain saving a lot of operations. This can be done because the cross-correlation of two functions is the convolution between the first function and the conjugate complex of the overturned second function. The convolution of two functions equals to the product of their Fourier transform. This brings the complexity
IGI Global Microsoft Word 2007 Template Reference templateInstructions.pdf for detailed instructions on using this document.
of the autocorrelation computation, basically, to the Fast Fourier Transform (FFT) theoretical complexity which is log , denoting with N the length of the sequence on which the FFT is performed. This makes it suitable for its implementation on smartphones. YIN The YIN estimator tries to solve the autocorrelation methods problem that peaks occur in correspondence with the sub-harmonics and is operatively difficult to distinguish between the subharmonics peaks and the fundamental frequency peak. YIN method is based on minimizing the difference between the waveform and its delayed replica instead of maximizing the product. The difference function is the following (2): W
dt ( k ) = ∑ ( x j − x j + k )2
(2)
j =1
In order to reduce the occurrence of sub-harmonic errors, YIN employs a cumulative mean function (3) which de-emphasizes higher-period dips in the difference function: #
" * !1⁄ ∑+
1, ,
0
)
,
-./012340
5
(3)
Other improvements in the YIN fundamental frequency estimation system include a parabolic interpolation of the local minima, which has the effect of reducing the errors when the period estimation is not a factor of the window length used. Component frequency ratios This method was first introduced by Martin Piszczalski in 1979 within a work for automatic music transcription. His system would extract the pitch of the signal (assuming that a single note was present at each point in time) and then find note boundaries, infer pitch key, and present a score. Piszczalski’s original procedure began with a spectral transform and identification of the partials in the signal, using peak detection. For each pair of these partials, the algorithm finds the “smallest harmonic numbers” that would correspond to a harmonic series with these two partials in it. Filter based methods It is possible to estimate the fundamental frequency of a waveform by applying different filters with different center frequencies, and comparing their output. A comb filter has many equally spaced pass-bands. In the case of the optimum comb filter algorithm, the locations of the pass-bands are based on the location of the first passband. For example, if the center frequency of the first passband is 10 Hz, then there will be narrow pass-bands every 10 Hz after that, up to the Shannon frequency, which usually is 8 kHz for voice signals. Comb filter estimator is robust but it does not fit well with mobile devices needs, it is a computationally intensive algorithm. A more recent filter-based is the method which exploits the tunable IIR filters. This method consists of a narrow user-tunable band-pass filter, which is swept across the frequency spectrum. When the filter is in line with a strong frequency partial, a maximum output will be present in the output of the filter, and the can then be read off the center frequency of the filter.
IGI Global Microsoft Word 2007 Template Reference templateInstructions.pdf for detailed instructions on using this document.
Cepstrum Cepstral features were originally invented to distinguish between earthquakes and underground nuclear explosions but they have many applications in speech processing. The name cepstrum, which is the reversal of the first four letters of the word spectrum, was adopted by its inventors because they realized that they were performing operations in a transform domain that were more often performed in the time domain. The theory behind this method relies on the fact that the Fourier transform of a pitched signal usually has a number of regularly spaced peaks, representing the harmonic spectrum of the signal. When the log magnitude of a spectrum is taken, these peaks are reduced, their amplitude brought into a usable scale, and the result is a periodic waveform in the frequency domain, the period of which (the distance between the peaks) is related to the fundamental frequency of the original signal. The Fourier transform of this waveform has a peak at the period of the original waveform. There is a complex cepstrum, a real cepstrum, a power cepstrum, and phase cepstrum, speech processing applications often use the power spectrum, defined as the squared magnitude of the Fourier transform of the logarithm of the squared magnitude of the Fourier transform of a signal (4): 67 8
Where
9 :log 9 :; . < 9 < 9
:< denotes the Fourier transform operand.
(4)
Cepstrum features work well for speech processing because speech signals are spectrally rich and have evenly spaced partials. Multi-resolution If the accuracy of a certain algorithm at a certain resolution is somewhat suspect, it is possible to confirm or deny any estimator hypothesis by using the same algorithm at a higher or lower resolution. Thus, use a bigger or smaller time window to calculate the spectrum. If a frequency peak shows up in all or most of the windows, this can be considered a confirmation of the estimator hypothesis. However, each new analysis resolution means more computational expense, which is why multi-resolution Fourier analysis is slower than a dedicated multi-resolution transform such as the discrete wavelet transform. These methods may be useful in variable performance mobile applications because they give a settable trade-off between computational complexity and accuracy. Neural networks Connectionist models, of which neural nets are an example, are self-organizing pattern matchers, providing a classification output for messy or fuzzy input. Logically, they consist of a collection of nodes, connected by links with associated weights. At each node, signals from all incoming links are summed according to the weights of these links, and if the sum satisfies a certain transfer function, an impulse is sent to other nodes through output links. In the training stage, input is presented to the network along with a suggested output, and the weights of the links are altered to produce the desired output. In the operation stage, the network is presented with input and provides output based on the weights of the connections. Maximum likelihood estimation can be done exploiting the maximum likelihood algorithm. An observation O consists of a set of partials in a short-time Fourier transform representation of a sound. Each observation is assumed to have been produced by a sound with a particular fundamental frequency , and each spectrum contains other information including inharmonic and non-sinusoidal partials (noise). This model is a simplification of the general sound model, assuming that a sound consists primarily of harmonic partials at integer multiples of , with a minority of inharmonic partials and noise. For a set of candidate
IGI Global Microsoft Word 2007 Template Reference templateInstructions.pdf for detailed instructions on using this document.
fundamental frequencies, the algorithm computes the probability (likelihood) that a given observation was generated from each in the set, and finds the maximum. The choice of the set of fundamental frequencies is important, because theoretically, the observation could originate from any . Formants features In the frequency domain, the location of vocal tract resonances depends upon the shape and the physical dimensions of the vocal tract. Since the resonances tend to “form” the overall spectrum, speech scientists refer to them as formants (E. Douglas-Cowie, 2003). Each formant is characterized by its center frequency and its bandwidth. Tolkmitt and Scherer found that subjects during stress or under depression do not articulate voiced sounds with the same effort as in the neutral emotional state (Scherer F. J., 1986) (D. J. France, 2000). Then, the formants can be used to discriminate the improved articulated speech from the slackened one. The formant bandwidth during slackened articulated speech is gradual, whereas the formant bandwidth during improved articulated speech is narrow with steep flanks. Neutral speech typically displays a “uniform formant structure and glottal vibration patterns”, contrasting the “irregular” formant contours of fear, sadness, and anger (D. Morrison, 2007). Scherer (Scherer K. R., Vocal communication of emotion: a review of research paradigms, 2003) lists predictions of the formant frequencies along with several emotion classes. For happiness, it is noted that the F1 mean is decreased while the F1 bandwidth is increased. For anger, fear, and sadness, the F1 mean is increased while the F1 bandwidth is decreased. F2 mean is decreased for sadness, anger, fear, disgust. Williams and Stevens (Stevens, Emotions and speech: Some acoustical correlates, 1972) found that anger produced vowels “with a more open vocal tract” and from that the researchers inferred that the first formant frequency would have a greater mean than that of neutral speech. It was also noticed that the amplitudes of F2 and F3 were higher with respect to that of F1 for anger and fear compared with neutral speech. Formants are the distinguishing or meaningful frequency components of human speech and of singing and are defined as the spectral peaks of the sound spectrum 9= ; 9. Formants are directly influenced by the shape of the individual vocal tract. The formant with the lowest frequency is called ,, the second , and the third >. The locations of the first two formants are sufficient to distinguish between vowels. Formants are often measured as amplitude peaks in the frequency spectrum of the speech. Typically the values related to formants used as features for emotion recognition are:
TABLE 2Formants-related features Feature
Papers
Formants position
(Litman, 2004) (M. Lugger, Robust estimation of voice quality parameters under real world disturbances, 2006)
Formants bandwidth
(Litman, 2004) (M. Lugger, Robust estimation of voice quality parameters under real world disturbances, 2006)
Difference between third and second formant
(Litman, 2004)
Difference between first and second formant
(Litman, 2004)
Fi amplitude (i
(M. Lugger, Robust estimation of voice quality parameters under real world disturbances, 2006)
1,2,...)
Energy related features
IGI Global Microsoft Word 2007 Template Reference templateInstructions.pdf for detailed instructions on using this document.
Energy, often referred to as the volume or intensity of the speech, is also known to contain valuable emotional information (R. Huber, 1998) (R. Nakatsu, 1999) (Waibel, 2000) (S. McGilloway, 2000). According to the studies performed by Williams and Stevens (Stevens, Emotions and speech: Some acoustical correlates, 1972), the arousal state of the speaker affects the overall energy, energy distribution across the frequency spectrum and the frequency and duration of pauses of speech signal. Several studies have confirmed this conclusion. In their research, Fonagy (Fonagy, Emotions, voice and music, 1981) found that angry speech had a noticeably increased energy envelope. Happiness showed similar characteristics, as reported by Davitz (Davitz, Personality, perceptual, and cognitive correlates of emotional sensitivity, 1964.) and Skinner (Skinner, 1935). Sadness was associated with decreased intensity (Davitz, Personality, perceptual, and cognitive correlates of emotional sensitivity, 1964.) (Fonagy, Emotions, voice and music, 1981) and disgust had reduced loudness (Magdics, Emotional patterns in intonation and music, 1963). Scherer (Scherer K. R., Vocal communication of emotion: a review of research paradigms, 2003) notes that in fear, joy, and anger there is an increase in energy. Recent study (Scherer T. J., 2000) (Cornelius, 2003) have confirmed that with the emotions of joy, anger, and fear the resulting speech is correspondingly loud, fast and enunciated with strong high-frequency energy while with the arousal of the parasympathetic nervous system, as with sadness, producing speech that is slow, low-pitched and with little high-frequency energy. These characteristics follow with what is expected of the emotional state. Those with high activation levels such as anger, surprise, and happiness generally have a higher intensity, while fear, sadness, and disgust have lower intensity (T. Nwe, 2003). The arousal state of the speaker is directly related to the energy of the vocal signal. For this reason many works try to infer the emotional state of an individual by features related to the energy of his voice. The energy of a sequence of length N is defined as follows: ?
,
9
9
(5)
The energy-related values used as feature to discriminate the emotional state of an individual are:
TABLE 3Energy-related features Feature
Papers
Energy mean
(J. Ang, 2002) (Litman, 2004) (Scherer K. R., Vocal Affect Expression: A Review and a Model for Future Research, 1994)
Energy median
(Pieraccini, 2002)
Energy maximum
(J. Ang, 2002) (Litman, 2004) (Scherer K. R., Vocal Affect Expression: A Review and a Model for Future Research, 1994)
Energy minimum
(J. Ang, 2002) (Litman, 2004) (Scherer K. R., Vocal Affect Expression: A Review and a Model for Future Research, 1994)
Energy range
(J. Ang, 2002) (Litman, 2004) (Pieraccini, 2002)
Energy standard deviation
(Litman, 2004) (Pieraccini, 2002)
Intensity
(Scherer T. J., 2000)
High-frequency energy
(Scherer T. J., 2000)
IGI Global Microsoft Word 2007 Template Reference templateInstructions.pdf for detailed instructions on using this document.
The computation complexity of these features is very low.
Timing features As previously said, voiced speech is quasi-periodic. The presence of this periodicity permits to distinguish between voiced and unvoiced sounds. The duration of the voiced speech signal and the length of the pauses are other significant cues to the emotion expressed by the speaker. Properties of rhythmbased characteristics include pauses between voiced sounds, lengths of voiced segments, and rate of speech (that is usually calculated by measuring the number of syllables per second). Speaking rate has been used in many researches (F. Dellaert, 1996) (R. Huber, 1998) (Petrushin, 2000) (J. Ang, 2002). From these studies emerge that fear, disgust, anger, and happiness often have a higher speaking rate, while surprise has a normal tempo and sadness a reduced articulation rate. Fonagy (Fonagy, Emotions, voice and music, 1981) found that anger has an increased speech rate, and “pauses forming 32% of total speaking time”. Happiness has been shown to have either a slower tempo (Risberg, 1986), a ‘‘regular’’ rate (Davitz, Personality, perceptual, and cognitive correlates of emotional sensitivity, 1964.) and even a high rate (Fonagy, Emotions, voice and music, 1981). Disgust has a very low speech rate, increased pause length, with pauses typically comprising 33% of speaking time. For sadness, contrarily, it has been generally agreed that the tempo is slower (Risberg, 1986) (Davitz, Personality, perceptual, and cognitive correlates of emotional sensitivity, 1964.) (Fonagy, Emotions, voice and music, 1981) and the speech contains “irregular pauses” (Davitz, Personality, perceptual, and cognitive correlates of emotional sensitivity, 1964.). Additionally, researches concerning human emotions recognition have been demonstrate that fast speech led to inferences of joy, with slow speech judged as a mark of sadness (Scherer F. J., 1986).
TABLE 4Time-related features Feature
Papers
Speaking rate
(Litman, 2004) (J. Ang, 2002) (F. Dellaert, 1996) (Scherer T. J., 2000)
Ratio of speech to pause time
(Litman, 2004) (J. Ang, 2002)
Total turn duration
(Litman, 2004)
Duration
(Davitz, Personality, perceptual, and cognitive correlates of emotional sensitivity, 1964.) (Fonagy, A new method of investigating the perception of prosodic features, 1978) (Magdics, Emotional patterns in intonation and music, 1963)
Duration of pause prior to turn
(Litman, 2004)
Duration of the articulation period
(M. Lugger, Robust estimation of voice quality parameters under real world disturbances, 2006)
Duration of the voiced period
(J. Ang, 2002) (Scherer K. R., Vocal Affect Expression: A Review and a Model for Future Research, 1994) (M. Lugger, Robust estimation of voice quality parameters under real world disturbances, 2006)
Duration of the longest pause
(J. Ang, 2002)
Number of long pauses inside an utterance
(J. Ang, 2002)
IGI Global Microsoft Word 2007 Template Reference templateInstructions.pdf for detailed instructions on using this document.
Pause ratio
(J. Ang, 2002)
Position on the time axis when F0 is maximum
(Litman, 2004)
Position on the time axis when energy is maximum
(Litman, 2004)
Number of silences
(Litman, 2004)
Length of silences
(Litman, 2004)
Zero Crossing Rate (ZCR)
(Pieraccini, 2002)
Qualitative features According with Abercrombie: “The term voice quality refers to those characteristics which are present more or less all the time that a person is talking: it is a quasi-permanent quality running through all the sound that issues from the mouth” (Abercrombie, 1967). Instead, Laver views the voice quality "as the characteristic auditory coloring of an individual speaker's voice, and not in the more narrow sense of the quality deriving solely from laryngeal activity. Both laryngeal and supralaryngeal features will be seen as contributing to voice quality." (Lavier, 1968). Then, “voice quality” is a confusing term. Sometimes it refers to laryngeal qualities or a specific phonation type, e.g. breathy voice, and sometimes it is used in a broad sense as the total vocal image of a speaker, including for instance pitch, loudness, and phonation types. In emotions recognition studies, “voice quality” is used in the latter sense. It is believed that the emotional content of an utterance is strongly related to its voice quality (Cowie, et al., 2001) (Davitz, The Communication of Emotional Meaning, 1964) (Scherer K. R., Vocal Affect Expression: A Review and a Model for Future Research, 1994). Experimental studies demonstrated a strong relation between voice quality and the perceived emotion. Scherer (Scherer K. R., Vocal Affect Expression: A Review and a Model for Future Research, 1994) suggested that tense voice is associated with anger, joy, and fear; and lax voice is associated with sadness. On the other hand, Murray and Arnott (Arnott, 1993) suggested that breathy voice is associated with both anger and happiness; sadness is associated with a “resonant” voice quality. Voice quality seems to be described most regularly with reference to full-blown emotions; i.e. emotions that strongly direct people into a course of actions (Cowie, et al., 2001). A wide range of phonetic variables contributes to the subjective impression of voice quality. The perceived emotion is related to the voice quality, especially full-blown emotions, i.e. emotions that are clearly expressed by the speakers. These kinds of emotions are opposed to underlying emotions, which influence positively or negatively a person’s actions and thoughts without seizing control. In contrast to other spectral features, the voice quality parameters (VQP) describe the properties of the glottal source. The most common method is fitting a glottal pulse model to the inverse filtered speech signal. Since the VQP are derived by the fundamental frequency of the speech, its formants position and bandwidth the computational complexity required for their calculation is of the same order. Open Quotient Gradient The glottis is the combination of the vocal folds and the space between the folds. The open quotient is the part of the glottal cycle during which the glottis is opened. Men have a shorter pulse than women, this leads to a smaller open quotient. The Open Quotient Gradient (OQG) calculation is done by the equation: @A
C, D B C B
(6)
IGI Global Microsoft Word 2007 Template Reference templateInstructions.pdf for detailed instructions on using this document.
C, and B C are the corrected spectral amplitudes of the first and second harmonics. where B fundamental frequency.
is the
Glottal Opening Gradient The Glottal Opening Gradient (GOG) is defined, similarly to OQG, by the following equation: A A
C, D EC B ,F D ,F
(7)
where, EC ,F is the corrected peak amplitude near the first formant and spectrum peak near the first formant.
,F is
the frequency of the
Skewness Gradient Skewness is a measure of asymmetry. The equation used to measure the skewness of the glottal pulse, called the SKewness Gradient (SKG), is defined as follows: GHA
C, D ECF B FD
(8)
where, ECF is the corrected peak amplitude near the second formant and spectrum peak near the second formant.
F is
the frequency of the
Rate of Closure Gradient The partial or complete closure of the glottis is called glottalization and is realized during the pronunciation of vowels and other sonorants. The Rate of Closure Gradient (RCG) is defined by the equation: 6A
C, D EC B >F >F D
EC >F is the corrected peak amplitude near the third formant and peak near the third formant.
(9) >Fis
the frequency of the spectrum
Incompleteness of Closure
The first formant bandwidth I,is correlated with the Incompleteness of Closure (IC) of the glottis. For this reason the IC computation is done by the following equation: J6
I, ,
(10)
Spectral features It is recognized that the emotional content of an utterance has an impact on the distribution of the spectral energy across the speech range of frequency (T. Nwe, 2003). For example, in (Scherer R. B., 1996) (Kaiser L. , 1962) is reported that utterances with happiness emotion have high energy at high frequency range while utterances with the sadness emotion have small energy at the same range. Additionally, in (Scherer R. B., 1996) (Kaiser L. , 1962) is shown that utterances with happiness emotion have high energy at high frequency range while utterances with the sadness emotion have small energy at
IGI Global Microsoft Word 2007 Template Reference templateInstructions.pdf for detailed instructions on using this document.
the same range. Then, these empirical studies permit to conclude that emotional content of an utterance have a relevant impact on speech signal’s spectral distribution. To take in account this fact, in addition to time-dependent acoustic features such as pitch and energy, spectral features are often selected as a shorttime representation for speech. Spectral features consists substantially in a set of parameters extracted from raw voice signal segment ( about 20-30 ms (M. Benzeghiba, 2007)) or on one non-linear filtered version which values vary in relation to the speech signal’s spectral distribution. Linear Predictive Coding Coefficients (LPCCs) (Atal, 1974) and Mel-Frequency Cepstrum Coefficients (MFCC) (Mermelstein, 1980) are the popular choices as features representing the phonetic content of speech (Schafer, 1978). Emotion recognition has often been performed exploiting spectral features as short-time representation of the speech signal. The human perception of the audio signal does not follow a linear scale, therefore, often, the speech signal is passed through a bank of band-pass filters which model the Human Auditory System (HAS) frequency response. The most used frequency scale for modeling HAS is the Bark scale. The Bark scale is a psychoacoustic scale which models the ear response to a sinusoidal tone. It ranges from 1 to 24 and it is composed by the 24 critical bands of hearing. The bandwidth of these auditory filters increases with higher frequencies and the precision of the frequency perception decreases.
TABLE 5Linear Predictive Coding (LPC)- and Mel-Frequency Cepstrum (MFC)-related features Features
Papers
Linear Predictive Coding Coefficients (LPCCs)
(T. Nwe, 2003) (Hansen S. B.-G., 2000)
Mel Frequency Cepstrum Coefficients (MFCCs)
(T. Nwe, 2003)
Mel Energy spectrum Dynamics Coefficients (MEDCs) (Wei, 2005) Log Frequency Power Coefficients (LFPC)
(T. Nwe, 2003)
One-Sided Autocorrelation Linear Predictor Coefficients (OSALPC)
(Nadeu, 1997)
Cepstral-based OSALPC (OSALPCC)
(Hansen S. B.-G., 2000)
Log-Frequency Power Coefficients (LFPC)
(T. Nwe, 2003)
Modified Mel Frequency Cepstrum Coefficients (MMFCC)
(Hansen S. B.-G., 2000)
Teager Energy Operator Teager energy operator (TEO) is a useful tool for analyzing single component signals from the energy point of view. TEO is defined for a discrete sequence by the equation: K
D
D1
1
(11)
TEO was introduced by (Kaiser J. , 1993) (Teager, 1990) arguing that linear speech model were inaccurate and can not model the nonlinear processes involved in the speech production. TEO-based features have been employed for detecting stress in speech because the TEO of multi-frequency signal reflects interaction between individual frequency components. The TEO-based features that can be used for recognizing the emotions: •
Teager energy profile of the pitch contour;
•
Normalized TEO autocorrelation envelope area;
IGI Global Microsoft Word 2007 Template Reference templateInstructions.pdf for detailed instructions on using this document.
•
TEO decomposed FM variation;
•
Critical band-based TEO autocorrelation.
Feature Selection A crucial problem for all emotion recognition system is the selection of the best set of features for characterizing the speech signal. The purpose of this stage is to appropriately select a subset of features from the original set in order to optimize classification time and accuracy. In real-time application is necessary to reduce the number of used feature in order to also reduce the computational complexity and the time required for completing the emotion recognition. Moreover, normally one would expect an increase in classification performance when more features are used. Nevertheless, the performance can decrease for an increasing number of features if the number of patterns is too small. This phenomenon is known as the curse of dimensionality. This stage aims then to reduce the size of the speech features set by selecting the most relevant subset of features and removing the irrelevant ones, or by generating few new features that contains most of the valuable speech information. The safest strategy to get the best feature set is an exhaustive search which is, often, computationally impractical, therefore, many sub-optimum algorithms have been proposed. Sequential Forward Selection (SFS): it is a technique for data selection that begins with an initially empty set. A single feature is added at each step. Each unique feature set is tested with a subset evaluator. Each feature set is then ranked by classification accuracy and recorded. The selection of features stops when adding a new one does not increase the overall correct classification rate or when the number of the selected features reached a previously set number. SFS is not necessarily finding the best possible combination of features since it only considers the performance of individual features acting alone. Moreover, this algorithm is subjected to nesting problems. Sequential Floating Forward Selection (SFFS): it is an iterative method to find a subset of features that is near the optimal one, and an improved version of the SFS. At each iteration, a new feature is added to the previous feature subset (forward step). Afterwards, the least significant features are excluded as long as the resulting subset is better in terms of the recognition rate than the previous subset with the same number of features (backward step). This conditional exclusion step is motivated by the fact that a new included feature may carry information that was already present in the set carried by other features previously selected. Sequential Backward Selection (SBS): it is similar to SFS except that it works in the backward direction. It begins with a set containing all the features and then excludes poorly-performing features all the time that the recognition rate is increasing monotonically. Genetic Search: a genetic search of the feature space mimics biological evolution by “mutating” chromosomes (feature sets). Genes (individual features) make up the chromosomes which are initially randomly turned on or off (set to “0” = off or “1” = on). Beginning with an initial population of randomly generated chromosomes, each chromosome is passed through a fitness function which ranks each member of the current generation according to its fitness, the classification accuracy. Those chromosomes with the greatest fitness are ‘‘selected’’ and mated, with a mutation probability that introduces or removes one or more genes. When a stopping criteria has been met, such as a maximum number of generations, the process stops and ideally an optimal feature set is produced. The most used sub-optimum algorithms for feature reduction are: Principal Component Analysis (PCA): the central idea is to reduce the dimensionality of a data set consisting of a large number of interrelated variables, while retaining as much as possible of the variation present in the data set. This is achieved by transforming it to a new set of variables, the Principal
IGI Global Microsoft Word 2007 Template Reference templateInstructions.pdf for detailed instructions on using this document.
Components (PCs), which are uncorrelated, and which are ordered so that the first few retain most of the variation present in all of the original variables. Multi-Dimensional Scaling (MDS): it is a linear method that starts with a matrix of items, containing the "similarity" of each element of each row column element. Then assigns a location to each item in N-dimensional space, where N is a priori specified. This technique starts with a system with as many dimensions as many elements of the system, and reduces the size up to N. Independent Component Analysis (ICA): it is extension of PCA with the addiction that the Principal Components must be also independent. ISOMap: it is a non linear method that provides a simple method for estimating the intrinsic geometry of a manifold data. It is based on a rough estimate of each data point’s neighbors on the manifold. ISOMap is highly efficient and generally applicable to a broad range of data sources and dimensionality. Self-Organizing Map (SOM): it is a non linear method that produces a low-dimensional discrete representation of the input space, preserving its topological properties.
Classification Classification is the task of identifying to which category belongs a new observation. In the emotion detection problem the categories are the speaker emotions and the observations are the feature extracted from the speech. The key task of this stage is to choose an appropriate method which can provide an accurate recognition of the emotion expressed by the speaker. Each classification method has advantages and shortfalls, there is not a classification method which has been proved to work better for the task of speech emotion recognition, therefore, various type of classifiers have been adopted for the task of speech emotion detection, the most common are: Hidden Markov Model (HMM), Gaussian Mixture Model (GMM), Artificial Neural Networks (ANN) and Support Vector Machine (SVM). Hidden Markov Models have been often used in speech applications. The HMM is a doubly stochastic process which consists of a first-order Markov chain whose states are hidden from the observer. GMM is a density estimation method using a convex combination of multi-variate normal distributions. It is proven that GMMs work better when coupled with global features. ANN is another common classifier, it has been proved that ANNs are more effective than HMMs and GMMs in modeling nonlinear mappings. The Support Vector Machine classifier is widely used in many pattern recognition problems, it has some advantages with respect of HMM and GMM such as the optimality of the training algorithm. Hidden Markov Model The Hidden Markov Model (HMM) is a mathematical formalism that allows modeling of a stochastic system, which may undergo characteristic changes at uncertain times. It is often called a doubly stochastic process in which a Markov chain governs the characteristic change of the system and each state of the Markov chain is associated with a stochastic process or distribution, which supports the random nature of the observation. The Hidden Markov Model classifier has been extensively used in speech applications such as isolated word recognition and speech segmentation because it is physically related to the production mechanism of speech signal. In affect recognition field, it is a statistical signal model trained by sequences of feature vectors that are representative of the input signal. In the training phase, the HMM parameters are determined as those maximizing the likelihood. This is commonly achieved using the Expectation Maximization (EM) algorithm. HMM generally have many interesting properties such as the ease of implementation and their solid mathematical basis. The basic theory of Markov chains has been known to mathematicians and engineers for close to 100 years, but it is only in 1980s that it has been applied explicitly to problems in speech processing. However, it has some drawbacks, such as the
IGI Global Microsoft Word 2007 Template Reference templateInstructions.pdf for detailed instructions on using this document.
need of a proper initialization for the model parameters before training and the long training time often associated with them.
Mathematically, for modeling a sequence of observable data vectors, : ,,. . . , M