Mar 30, 2013 - arXiv:1302.4081v2 [quant-ph] 30 Mar 2013. Optimal error regions for quantum state estimation. Shang Jiangwei,1 Hui Khoon Ng,1, 2 Arun ...
Optimal error regions for quantum state estimation Shang Jiangwei,1 Hui Khoon Ng,1, 2 Arun Sehrawat,1 Li Xikun,1 and Berthold-Georg Englert1, 3
arXiv:1302.4081v2 [quant-ph] 30 Mar 2013
1
Centre for Quantum Technologies, National University of Singapore, Singapore 117543 2 DSO National Laboratories, Singapore 118230 3 Department of Physics, National University of Singapore, Singapore 117542 (Posted on the arXiv on 30 March 2013)
Rather than point estimators, states of a quantum system that represent one’s best guess for the given data, we consider optimal regions of estimators. As the natural counterpart of the popular maximum-likelihood point estimator, we introduce the maximum-likelihood region—the region of largest likelihood among all regions of the same size. Here, the size of a region is its prior probability. Another concept is the smallest credible region—the smallest region with pre-chosen posterior probability. For both optimization problems, the optimal region has constant likelihood on its boundary. We discuss criteria for assigning prior probabilities to regions, and illustrate the concepts and methods with several examples. PACS numbers: 03.65.Wj, 02.50.-r, 03.67.-a
I.
INTRODUCTION
Quantum state estimation (see, for example, Ref. [1]) is central to many, if not all, tasks that process quantum information. The characterization of a source of quantum carriers, the verification of the properties of a quantum channel, the monitoring of a transmission line used for quantum key distribution—all three require reliable quantum state estimation, to name just the most familiar examples. In the typical situation that we are considering, several independently and identically prepared quantuminformation carriers are measured one-by-one by an apparatus that realizes a probability-operator measurement (POM), suitably designed to extract the wanted information. The POM has a number of outcomes, with detectors that register individual information carriers (photons in the majority of current experiments), and the data consist of the observed sequence of detection events (“clicks”) [2]. The quantum state to be estimated is described by a statistical operator, the state, and the data can be used to determine an estimator for the state—another state that, so one hopes, approximates the actual state well. There are various strategies for finding such an estimator. Thanks to the efficient methods that Hradil, ˇ aˇcek, and their collaborators developed for calculatReh´ ing maximum-likelihood estimators (MLEs, reviewed in Ref. [3]; see also Ref. [4]), MLEs have become the estimators of choice. For the given data, the MLE is the state for which the data are more likely than for any other state. Since the data have statistical noise, one needs to supplement a point estimator with error bars of some sort— error regions, more generally, for higher-dimensional problems. Ad-hoc recipes have been proposed for attaching a vicinity of states to a given point estimator, often relying on approximations valid only in the limit of a large amount of data (see Refs. [5] and [6] for examples in quantum state estimation), or involves resampling of
the data (see, for instance, Ref. [7]). By contrast, we wish to use systematic procedures for determining error or estimator regions from only the data that we did observe. We are, however, not considering estimator regions of any kind, but specifically maximum-likelihood regions (MLRs). For the given data, the MLR is that region of pre-chosen size, for which the data are more likely than any other region of the same size. The regions referred to here are regions in the space of quantum states (more precisely: in the reconstruction space; see Sec. II A). As we shall see, there is an intimate connection between the MLE and the MLRs for the same data: All MLRs contain the MLE, and in the limit of very small size, the MLR is a small vicinity of the MLE. The “size of a region” is clearly an important notion here. We agree with Evans, Guttman, and Swartz [8] that, in the present context of state estimation, it is natural to measure the size of a region by its prior probability that the actual state lies in the region, that is: the probability that we assign to the region before any data are at hand. As they should, regions with the same size have the same prior probability; and the whole state space has unit size ≡ unit prior probability because the actual state is surely somewhere in the state space. In addition to MLRs, we also consider smallest credible regions (SCRs). The credibility of a region is its posterior probability, that is: the probability that the actual state lies in the region, conditioned on the data (see, for example, Ref. [9]). The SCR, then, is the smallest region with the pre-chosen value of the credibility. It turns out that the problems of finding the MLR and the SCR are duals of each other. Each SCR is also a MLR, and each MLR is a SCR. In both cases, the optimal regions contain all states for which the likelihood of the data exceeds a threshold value. In particular, in the limit of small credibility, the SCR is a small vicinity of the MLE. The confidence regions that were recently studied in the quantum context by Christandl and Renner [10], and
2 by Blume-Kohout [11], are markedly different from the SCRs and the MLRs. Confidence regions give an answer to the following question: Consider all conceivable data, all sequences of detector clicks that could possibly be obtained, and assign a region to each sequence; how do we choose the regions such that a pre-chosen fraction of the regions (the confidence level) will surely contain the unknown actual state? We contrast this with the corresponding question for the SCR: Consider all permissible states, each a candidate for the unknown actual state; what is the smallest region, for the observed data, that contains the actual state with a pre-chosen probability? The difference between the two questions is simple, yet profound. When asking for confidence regions, the data are regarded as the random variable; whereas the observed data are given for the SCR, and the unknown state is the random quantity. A further difference to note is that the sizes of the confidence regions play a minor role in their construction, whereas its size is a crucial property of a SCR. Here is a brief outline of the paper. We set the stage in Sec. II where we introduce the reconstruction space, discuss the size of a region, and define the various joint and conditioned probabilities. Equipped with these tools, we then formulate in Sec. III the optimization problems that identify the MLRs and SCRs and find their solutions; this is followed by remarks on confidence regions. Criteria for choosing unprejudiced priors are the subject of Sec. IV, and simulated qubit measurements illustrate the matter in Sec. V. We close with an outlook on the problems that need to be solved before MLRs and SCRs can be computed efficiently for data acquired in actual experiments.
II. A.
SETTING THE STAGE Reconstruction space
The K outcomes Π1 , Π2 , . . . , ΠK of the POM, with which the data are acquired, are positive Hilbert-space operators that decompose the identity, K X
k=1
Πk = 1
with Πk ≥ 0 for k = 1, 2, . . . , K.
(1)
If the state ρ describes the system, then the probability pk that the kth detector will click for the next copy to be measured is pk = tr{Πk ρ} = hΠk i ,
(2)
which is the Born rule, of course. Here, ρ can be any positive operator with unit trace, ρ ≥ 0,
tr{ρ} = 1 .
(3)
The positivity of ρ and its normalization ensure the positivity of the pk s and their normalization pk ≥ 0 ,
K X
pk = 1 .
(4)
k=1
Probabilities p = (p1 , p2 , . . . , pK ) for which there is a state ρ such that Eq. (2) holds, are permissible probabilities. They make up the probability space. The probability space for a K-outcome POM is usually smaller than that of a K-sided die because not all positive pk s with unit sum are permitted by the Born rule. The quantum nature of the state estimation problem enters only in these additional restrictions on p: Quantum state estimation is standard statistical state estimation with quantum constraints. The rich concepts and methods of statistical inference apply immediately to the quantum situation, modified where necessary to account for the restricted probability space. Whereas the pk s are uniquely determined by ρ in accordance with Eq. (2), the converse is only true if the POM is informationally complete. In any case, there is always a reconstruction space R0 , a set of ρs that contains exactly one ρ for each set of permissible probabilities, consistent with the Born rule. If there is more than one reconstruction space, it does not matter which one we choose. While the probability space is always convex, a convex reconstruction space may not be available. The reconstruction space is at most (K − 1)-dimensional, and has a smaller dimension if fewer probabilities are independent. We note that K is always finite, and so is the dimension of the reconstruction space. There are no real-life POMs with an infinite number of outcomes. As an example, consider a harmonic oscillator with its infinite-dimensional state space. If the POM has two outcomes with p1 equal to the probability of finding the oscillator in its ground state, and p2 = 1 − p1 , one reconstruction space is the set of convex combinations of the projector to the ground state and another state with no ground-state component. In this situation, there is a large variety of reconstruction spaces to choose from, because any other state serves the purpose, and all one can infer from the data is an estimate of the ground-state probability. Now, state estimation is the task of finding a state, or a region of states, in the reconstruction space by a systematic and reliable procedure that exploits the observed data. In view of the one-to-one correspondence between the states in the reconstruction space and the permissible probabilities, one can identify the reconstruction space with the probability space. Indeed, since the probability space is unique, while there can be many different reconstruction spaces, it is often more convenient to work in the probability space. The primary objective is then to find an estimator, or a region of estimators, for the probabilities p. The conversion of the set of probabilities p into a state ρ is performed later, if at all, and only at this stage do we need to decide which reconstruction space is used
3 for reference. If the POM is not informationally complete, it will be necessary to invoke additional criteria or principles for a unique mapping p → ρ. For example, one could follow Jaynes’s guidance [12, 13] and maximize the entropy [14] (see also Ref. [15]). B.
Size and prior content of a region
Prior to acquiring any data, we assign equal probabilities to equivalent alternatives. If we split the reconstruction space in two, it is equally likely that the actual state is in either half and, therefore, each half should carry a prior probability of 12 , provided that the splitting-intwo is fair, that is: the two pieces are of equal size. A preconceived notion of size is taken for granted here. Further fair splitting, into more disjoint regions of equal size, then suggests rather strongly that the prior probability of a region should be proportional to its size. We take this suggestion seriously: Scale all region sizes such that the whole reconstruction space has unit size, and then the size of a region is its prior probability—its “prior content” if we borrow terminology from Bayesian statistics. The identification “size ≡ prior probability” is technically possible because both quantities simply add if disjoint regions are combined into a single region. There is no room for mathematical inconsistencies here, unless we begin with a region-to-size mapping for which the reconstruction space cannot be normalized to unit size, so that we would obtain improper prior probabilities. We are not interested in pathological cases of this or other kinds and just exclude them. Should an improper prior be useful in a particular context, it should come about as the limit of a well-defined sequence of proper priors. The above line of reasoning can be reversed. Should we have established each region’s prior probability with other means (perhaps invoking symmetry arguments or taking into account that the source under investigation is designed to emit the information carriers in a certain target state; see Sec. IV), then we accept this as the natural measure of the region’s size [8]. After all, the reconstruction space is an abstract construct that is not endowed with a self-suggesting unique metric, and a region’s prior probability is the quantity that matters most in the present context of statistical inference. We denote by (dρ) the size of the infinitesimal vicinity of state ρ. The size SR of a region R ⊆ R0 is then obtained by integrating over the region, Z Z (5) SR = (dρ) with (dρ) = 1 , R
R0
where the latter integration covers all of the reconstruction space. By construction, the value of SR does not depend on the parameterization that we use for the numerical representation of (dρ). The primary parameterization is in terms of the probabilities, (dρ) = (dp) w(p)
with (dp) = dp1 dp2 · · · dpK ,
(6)
where the prior density w(p) is nonzero for all permissible probabilities and vanishes for all non-permissible ps. In particular, w(p) always contains w0 (p) = η(p1 )η(p2 ) · · · η(pK )δ(p1 +p2 +· · ·+pK −1) (7) as a factor and so enforces the constraints that the probabilities are positive and have unit sum [16]. If there are no other constraints, we have the probability space of a K-sided die. For genuine quantum measurements, however, there are additional constraints, some accounted for by more delta-function factors, others by step functions. The delta-function constraints reduce the dimension of the reconstruction space from K − 1 to the number of independent probabilities. For the harmonic-oscillator example of Sec. II A, which has the same probability space as a tossed coin, the factor w0 (p) selects the line segment with 0 ≤ p1 = 1 − p2 ≤ 1 in the p1 p2 plane. If we choose the “primitive prior” (dρ) = (dp) w0 (p), the subsegment with a ≤ p1 ≤ b has size b − a. For the Jeffreys prior [17], a popular choice of an unprejudiced prior [18], 1 (dρ) = (dp) w0 (p) √ , (8) π p1 p2 √ √ the same subsegment has size π2 [sin−1 ( b) − sin−1 ( a)]. In this example, and also in those we use for illustration in Sec. V below, it is easy to state quite explicitly the restrictions on the set of permissible probabilities that follow from the Born rule. In other situations, it could be difficult or impossible. This is why state estimation is often done by searching for a statistical operator in a suitable state space. For practical reasons, it may be necessary to truncate the full state space—which can be, and often is, infinite-dimensional—to a test space of manageable size. With such a truncation one accepts that not all permissible probabilities are investigated. Therefore, a criterion for judging if the test space is large enough is to verify that the estimated probabilities do not change significantly when the space is enlarged. Examples for the artifacts that result from test spaces that are too small can be found in Ref. [19]. C.
Point likelihood, region likelihood, credibility
The data D acquired by the POM consist of a sequence of detector clicks, with a total of nk clicks of the kth detector, and a total number of N = n1 +n2 +· · ·+nK clicks after measuring N quantum-information carriers [20]. The probability of obtaining the data, if ρ is the state, is the familiar point likelihood L(D|ρ) = pn1 1 pn2 2 · · · pnKK .
(9)
It attains its maximal value when ρ is the MLE ρbml , max L(D|ρ) = L(D|b ρml ) , ρ
(10)
4 R
where ρbml is in the reconstruction space, but the maximum could be taken over all states. The joint probability of finding the state ρ in the region R and obtaining the data D is then Z prob(D ∧ R) = (dρ) L(D|ρ) . (11)
ρ −→ dA(ρ)
R
If R = R0 , we have the prior likelihood L(D), Z prob(D ∧ R0 ) = L(D) = (dρ) L(D|ρ) .
Since one of the click sequences is surely observed, the likelihoods of Eqs. (9) and (12) have unit sum, L(D|ρ) = n1
D
X N ! δN,n +n +···+n 1 2 K pn1 1 pn2 2 · · · pnKK n ! n ! · · · n ! 1 2 K ,...,n K
= (p1 + p2 + · · · + pK )N = 1 , Z X L(D) = (dρ) = 1 . D
(13)
R0
We factor the joint probability prob(D ∧ R) in two different ways, prob(D ∧ R) = L(D|R)SR = CR (D)L(D) ,
(14)
and so identify the region likelihood L(D|R) and the credibility CR (D). Both quantities are conditional probabilities: The region likelihood is the probability of obtaining the data D if the state is in the region R; the credibility is the probability that the actual state is in the region R if the data D were obtained—the posterior probability of R. III. A.
Maximum-likelihood regions
b ml ) max L(D|R) = L(D|R
with SR = s .
FIG. 1: Infinitesimal variation of region R. The boundary of region R (solid line) is deformed to become the boundary of region R + δR (dashed line).
Since all competing regions have the same size, we can equivalently maximize the joint probability, b ml ) with SR = s . max prob(D ∧ R) = prob(D ∧ R
R⊆R0
(16) The answer to this maximization problem is given in Corollary 4 of Ref. [8] and justified by a detailed proof of considerable mathematical sophistication. We proceed to offer an alternative argument that is perhaps more accessible to the working physicist. Owing to the maximum property of the MLR and its fixed size, both prob(D ∧ R) and SR must be stationary under infinitesimal variations δR of the region R. Such an infinitesimal variation is achieved by deforming the boundary ∂R of the region, as illustrated in Fig. 1. The resulting change in the size SR vanishes for all permissible deformations, Z −→ → − dA(ρ) · δǫ(ρ) = 0 . (17) δSR = ∂R
OPTIMAL ERROR REGIONS
Instead of looking for the MLE, the single point in the reconstruction space that has the largest likelihood for the given data D, we desire a region with the largest likelihood—the MLR. For this purpose, we maximize the region likelihood L(D|R) under the constraint that only regions with a pre-chosen size s participate in the competition, with 0 < s < 1; an unconstrained maximization of L(D|R) is not meaningful because it gives the limiting region that consists of nothing but the point ρbml . The reb ml is a function of the data D and the size sulting MLR R s, but we wish to not overload the notation and will keep these dependences implicit, just like the notation does not explictly indicate the D dependence of the MLE ρbml . The MLR analog of the MLE definition in Eq. (10) is then R⊆R0
− → δǫ(ρ)
(12)
R0
X
··
R + δR
(15)
−→ Here, dA(ρ) is the vectorial surface element of the bound→ − ary ∂R at point ρ in the reconstruction space, and δǫ(ρ) is the infinitesimal displacement of the point ρ that deforms R into R + δR. The corresponding change in prob(D ∧ R) is Z −→ → − dA(ρ) · δǫ(ρ) L(D|ρ) = 0 , (18) δprob(D ∧ R) = ∂R
which attains the indicated value of 0 at the extremum b ml . If we have the situation sketched in the topR=R b ml is completely in the inteleft plot of Fig. 2, where R rior of the reconstruction space, both Eqs. (17) and (18) must hold simultaneously for arbitrary infinitesimal deformation δR. This is possible only if the point likelihood b ml of R b ml , that is: L(D|ρ) is constant on the boundary ∂ R b ml is an iso-likelihood surface (ILS). Furthermore, R b ml ∂R must correspond to the interior of this ILS (as opposed to its complement in the reconstruction space), since the
5
∂R0
only when the size, region likelihood, and credibility of the MLR are calculated. It is expedient to specify the threshold value as a fraction of the maximum value L(D|b ρml ) of the point likelihood. Denoting this fraction by λ, the characteristic function of the corresponding bounded-likelihood region (BLR) Rλ is the step function � ηRλ(ρ) = η L(D|ρ) − λL(D|b ρml ) , (19)
ˆ ml R
ˆ ml ∂R
where
ηR (ρ) = ˆ ml ∂R ˆ ml R ∂R0
�
1 if ρ is in R 0 else
(20)
is the characteristic function of region R. BLRs have appeared previously in standard statistical analysis; see Ref. [22] and references therein. The BLR Rλ has the size Z (21) sλ = (dρ) ηRλ(ρ) , R0
b ml is FIG. 2: MLRs of two kinds. In the top-left sketch, R completely contained inside the reconstruction space; in the b ml of R b ml contains a bottom-right sketch, the boundary ∂ R part of the surface ∂R0 of the reconstruction space. Dotted lines indicate iso-likelihood surfaces, that is: surfaces on which the point likelihood is constant.
concavity of the logarithm of the point likelihood implies that the interior necessarily has larger likelihood values than its complement [21]. b ml of R b ml contains a part of the If the boundary ∂ R surface ∂R0 of the reconstruction space, which is the situation on the bottom-right in Fig. 2, all interior points b ml must still lie on an ILS, or else we can always on ∂ R b ml to attain a larger value of the region likedeform ∂ R → − lihood with a permissible choice of δǫ(ρ). On the ∂R0 b ml , the point likelihood L(D|ρ) has larger valpart of ∂ R ues than the constant value on the interior part of the b ml (dashed in boundary, because ILSs that are inside R Fig. 2) and have endpoints in ∂R0 assign their larger likelihood values to these points. Therefore, deforming b ml inwards, with the change in size the ∂R0 part of ∂ R compensated for by an outwards deformation of the inb ml , decreases the value of the region terior part of ∂ R likelihood. And since outwards deformations of ∂R0 are not possible, a region with an ILS as interior part of the boundary, supplemented by a part of ∂R0 , is a possible MLR, indeed. In summary, the MLRs of various sizes s consist of all states ρ for which the point likelihood L(D|ρ) exceeds a certain threshold value, with higher thresholds for smaller sizes. Quite remarkably and somewhat surprisingly, the set of MLRs does not depend on the chosen prior. The shape of a MLR is fully determined by the point likelihood and the threshold value; the prior enters
and we have Rλ = R0 and sλ = s0 = 1 for λ ≤ λ0 with λ0 ≥ 0 given by min L(D|ρ) = λ0 L(D|b ρml ) . ρ
(22)
As λ increases from λ0 to 1, sλ decreases monotonically from 1 to 0. The size s specified in Eq. (15) is obtained for an intermediate λ value, and the corresponding BLR is the looked-for MLR. The MLE is contained in all MLRs. In the s → 0 limit, the MLR becomes an infinitesimal vicinity of the MLE and the region likelihood of the limit region is equal to b ml ) → L(D|b the point likelihood of the MLE, L(D|R ρml ). B.
Smallest credible regions
The MLR is the region for which the observed data are particularly likely. With a reversal of emphasis, we now look for a region that contains the actual state with high b sc : the smallest probability. Ultimately, this is the SCR R region for which the credibility has the pre-chosen value c. For the given D, the optimization problem min SR = SR b sc
R⊆R0
with CR (D) = c
(23)
is dual to that of Eqs. (15) and (16). Here we minimize the size for given joint probability, there we maximize the joint probability for given size. It follows that the BLRs of Eq. (19) are not only the MLRs, they are also the SCRs: Each MLR is a SCR, each SCR is a MLR. The BLR Rλ has the credibility Z 1 cλ = (dρ) ηRλ(ρ)L(D|ρ) , (24) L(D) R0
which, just like sλ , decreases monotonically from 1 to 0 as λ increases from λ0 to 1. The credibility c specified in Eq. (23) is obtained for an intermediate value, and the corresponding BLR is the looked-for SCR.
6 C.
Size and credibility of a BLR
The responses of the size sλ and the credibility cλ of a BLR to an infinitesimal change of λ are linked by L(D)
∂ ∂ cλ = L(D|b ρml )λ sλ . ∂λ ∂λ
(25)
Therefore, once sλ is known as a function of λ, we obtain cλ by an integration, λsλ + cλ =
Z
Z
1
dλ′ sλ′ λ
1
.
(26)
dλ′ sλ′ 0
This is, of course, consistent with the limiting values for λ ≤ λ0 and λ = 1, and also establishes that, for all intermediate values, the credibility of a BLR is larger than its size, cλ > sλ
for λ0 < λ < 1 .
(27)
Further, Eqs. (25) and (26) tell us that in the λ → 1 limit, when both sλ and cλ vanish, their ratio is finite and exceeds unity, cλ →Z sλ
1 1
dλ′ sλ′
=
L(D|b ρml ) > 1 for λ → 1 . L(D)
(28)
0
We note that this provides the value of L(D), since the maximal value L(D|b ρml ) of the point likelihood is computed earlier as it is needed for identifying the BLRs. Inasmuch as the value of sλ quantifies our prior belief that the actual state is in Rλ , we are surprised when the data tell us that the probability for finding the state in that region is larger. Accordingly, the SCR is the region for which we are most surprised for the given prior belief [23]. This matter and other aspects of Bayesian inference based on the concept of relative surprise are discussed in Ref. [8]. The relation (26) is also of considerable practical importance because we only need to evaluate the multidimensional integrals of Eq. (21), but not those of Eqs. (24) and (12). Since the latter integrals require well-tailored Monte-Carlo methods to handle the typically sharply peaked likelihood function, the numerical effort is very substantially reduced if we only need to evaluate the integral of Eq. (21). Indeed, the estimator regions for the observed data are conveniently and concisely communicated by reporting sλ and cλ as functions of λ. The end users interested in the MLR with the size of his liking or the SCR of her wanted credibility can thus determine the corresponding values of λ. It is then an easy matter to check if any particular ρ is inside the specified region or not. Once more, we use the simple harmonic-oscillator example of Sec. II A for illustration. Suppose, N = 2 copies have been measured, and we obtained one click
each for the two outcomes, so that the point likelihood is equal to p1 p2 . In this situation, we have √ λ0 = 0 and ηRλ(ρ) = η(4p1 p2 − λ), so that p1 − p2 ≤ 1 − λ for the BLR Rλ . This gives √ sλ = 1 − λ , √ 1 (29) cλ = (2 + λ) 1 − λ 2 for the primitive prior, and √ 2 sin−1 ( λ) , π √ 2 2p cλ = 1 − sin−1 ( λ) + λ(1 − λ) π π
sλ = 1 −
(30)
for the Jeffreys prior. D.
Confidence regions
The confidence regions that were recently studied by Christandl and Renner [10], and independently by Blume-Kohout [11], are markedly different from the MLRs and the SCRs. The MLR and the SCR represent inferences drawn about the unknown state ρ from the data D that have actually been observed. By contrast, confidence regions are a set of regions, one region for each data, whether observed or not, from the measurement of N copies. The confidence regions would contain any state in, at least, a certain fraction of many N -copy measurements, if the many measurements were performed. This fraction is the confidence level. When denoting by CD the confidence region for data D, the confidence level γ of the set C of CD s for all conceivable data (for fixed N ) is X (31) γ(C) = min L(D|ρ) ηCD(ρ) , ρ
D
where the minimum is reached in the “worst case.” For example, in the security analysis of a protocol for quantum key distribution, one wishes a large value of γ to protect against an adversary who controls the source and prepares the quantum-information carriers in the state that is best for her. Any set C, for which γ has the desired value, serves ′ the purpose. A smaller set C′ , in the sense that CD is contained in CD for all D, is preferable, but usually there is no smallest set of confidence regions. Here, “smaller” is solely in this inclusion sense, with no reference to a quantification of the size of a region and, therefore, there is no necessity of specifying the prior probability of any region. Since the transition from set C to the smaller set C′ requires the shrinking of some of the CD s without enlarging even a single one, it is easily possible to have two sets of confidence regions with the same confidence level and neither set smaller than the other. For illustration, we consider the harmonic-oscillator example of Sec. II A yet another time. Figure 3 shows
7 (a)
........................................................................................................................................................................................................................................... .. .. ... .. ..........................................................................................................................................................................................................................................
(b)
....................................................................................................................................................................................................................................... .. .. ... .. ......................................................................................................................................................................................................................................
1......................................................................p.......2..........................................................................................................................................................................................................................0... . . . p1 0 1 (c)
...................................................................................................................................................................................... .. .. ... .. .....................................................................................................................................................................................
(d)
............................................................................................................................................................................................................. .. .. ... .. ............................................................................................................................................................................................................
FIG. 3: Confidence regions and smallest credible regions. The bars indicate intervals of p1 = 1 − p2 for the harmonicoscillator example of Sec. II A, which has the reconstruction space of a tossed coin. Two copies are measured. The left solid bars indicate the regions for (n1 , n2 ) = (0, 2) counts; the right solid bars are for (n1 , n2 ) = (2, 0); and the central open bars are for (n1 , n2 ) = (1, 1). Cases (a) and (b) show two sets of confidence regions for confidence level γ = 0.8. Regions (c) and (d) are the SCRs for the primitive prior and the Jeffreys prior, respectively, both for credibility c = 0.8.
two sets of confidence regions (γ = 0.8) and the corresponding three SCRs (c = 0.8) for the primitive prior and the Jeffreys prior. Both sets of confidence regions are optimal in the sense that one cannot shrink even one of the regions without decreasing the confidence level, but neither set is smaller than the other. In the absence of additional criteria that specify a preference, both work equally well as sets of confidence regions. We observe in this example that confidence regions tend to overlap a lot, which is indeed unavoidable if a large confidence level is desired. By contrast, the SCRs for different data usually do not overlap unless the data are quite similar. In Fig. 3, there is no overlap of the SCRs for (n1 , n2 ) = (0, 2) and (2, 0). An important difference of considerable concern in all practical applications is the following. Once the data are obtained, there is the MLR and the SCR for these data, and it plays no role what other MLRs or SCRs are associated with different data that have not been observed. To find the confidence region for the actual data, however, one must first specify the whole set C of confidence regions because the confidence level of Eq. (31) is a property of the whole set. Christandl and Renner [10] have shown that one can choose high-credibility regions for the CD s [24], and Blume-Kohout [11] has argued that a set C composed of BLRs can be a pretty good set of confidence regions.
that Ref. [18] reviews various approaches to constructing unprejudiced priors. Let us discuss some criteria that are useful when choosing a prior. A general remark is this: The chosen prior should give some weight to (almost) all states, and it should not give extremely high weight to states in some part of the state space and extremely low weight to other states. This is to say that the prior should be consistent in the sense that the credibility of a region—its posterior content— is dominated by the data, rather than by the prior, if a reasonably large number N of copies is measured. A.
Uniformity
The time-honored strategy of choosing a uniform prior gets us into a circular argument: The line of thought presented in Sec. II B implements this strategy and leads to identifying the prior content of a region with its size. But that just means that we are now asked to declare how we measure the size of a region without prejudice, which is the original question about the prior. In fact, there is no unique meaning of the uniformity of a prior. In the sense that each prior tells us how to quantify the size of a region, each prior is uniform with respect to its induced size measure. This point can be illustrated with the harmonicoscillator example of Sec. II A. For the primitive prior of Sec. II B, the parameterization p1 =
1 (y + x) , 2
p2 =
dp1 dp2 = dx dy
1 (y − x) , 2
1 2
(32)
gives 1 (dρ) = dx dy η(y + x)η(y − x)δ(y − 1) 2 1 with −1 ≤ x ≤ 1 , → dx 2
(33)
where we integrate over y in the last step and so observe that the primitive prior is uniform in x, that is: the size of the region x1 < x < x2 is proportional to x2 − x1 . Likewise, the parameterization p1 = y(sin α)2 , p2 = y(cos α)2 , dp1 dp2 = dα dy y sin(2α)
(34)
gives IV.
CHOOSING THE PRIOR
The assignment of prior probabilities to regions in the reconstruction space should be done in an unprejudiced manner while taking into account all prior information that might be available. We cannot do justice to the rich literature on this subject and are content with noting
(dρ) → dα
2 π
with 0 ≤ α ≤
π 2
(35)
for the Jeffreys prior, which is uniform in α. Other priors can be treated analogously, each of them yielding a uniform prior in an appropriate single parameter. The parameterizations in Eqs. (32) and (34) exhibit in which explicit sense the primitive prior and the Jeffreys
8 prior are uniform. But the priors are what they are, irrespective of how they are parameterized. They are explicitly uniform in a particular parameterization and implicitly uniform in all others. Uniformity, it follows, cannot serve as a principle that distinguishes one prior from another. This ubiquity of uniform priors for a continuous set of infinitesimal probabilities is in marked contrast to situations in which prior probabilities are assigned to a finite number of discrete possibilities, such as the 38 pockets of a double-zero roulette wheel. Uniform probabilities of 1/38 suggest themselves, are meaningful, and clearly distinguished from other priors, all of which have a bias. Uniformity in a particularly natural parameterization of the probability space might also be meaningful. This, however, invokes a notion of “natural” that others may not share. B.
Utility
In many applications, estimating the state is not a purpose in itself, but only an intermediate step on the way to determining some particular property of the physical system. The objective is to find the value of a parameter that quantifies the utility of the state. For example, one could be interested in the fidelity of the actual state with a target state, or in an entanglement measure of a two-partite state, or in another quantity that tells us how useful are the quantum-information carriers for their intended task. In a situation of this kind, one should, if possible, use a prior that is uniform in the utility parameter of interest. As a simple example, consider a single � qubit. The utility parameter is the purity ξ(ρ) = tr ρ2 of the state ρ. With the Bloch-ball representation of a qubit state, ρ = 21 (1 + r · σ), where r = tr{σρ} = hσi is the Bloch vector and σ is the vector of Pauli matrices, the purity is ξ(ρ) =
1 (1 + r2 ) 2
with r = |r| .
(36)
A prior uniform in purity induces a prior on the state space according to (dρ) ∝ dξ dΩ ∝ rdr dΩ,
(37)
where we parameterize the Bloch ball by spherical coordinates (r, θ, φ). Here, dΩ is the prior for the angular coordinates; the prior for the radial coordinate r is fixed by our choice of uniformity in ξ. Irrespective of what we choose for dΩ, the marginal prior for r is uniform in ξ. If one can quantify the utility of an estimator by a cost function, an optimal prior can be selected by a minimax strategy: For each prior in the competition one determines the maximum of the cost function over the states in the reconstruction space, and then chooses the prior for which the maximum cost is minimal. In classical statistics, such minimax strategies are common (see,
for instance, Chapter 5 in Ref. [25]); for an example in the context of quantum state estimation, see Ref. [26]. C.
Symmetry
Symmetry considerations are often helpful in narrowing the search for the appropriate prior. For a particularly instructive example, see Sec. 12.4.4 in Jaynes’s posthumous book [27]. Returning to the uniform-in-purity prior of Eq. (37), one can invoke rotational symmetry in favor of the usual solid-angle element, dΩ = sin θdθ dφ, as the choice of angular prior. The reasoning is as follows: The purity of a qubit state does not change under unitary transformations; unitarily equivalent states have the same purity. Now, regions that are turned into each other by a unitary transformation have identical radial content whereas the angular dependences are related by a rotation. Invariance under rotations, in turn, requires that the prior is proportional to the solid angle, hence the identification of dΩ with the differential of the solid angle. Note that the resulting prior element (dρ) is different from the usual Euclidean volume element, r2 dr sin θdθ dφ, which would be natural if the Bloch ball were an object in the physical three-dimensional space. But it ain’t. Symmetry arguments should be used carefully and not blindly. For a fairly tossed coin, the prior should not be affected if the probabilities for heads and tails are interchanged, w(p1 , p2 ) = w(p2 , p1 ). However, for the harmonic-oscillator example of Sec. II A, which has the same reconstruction space as the coin, there is poor justification for requiring this symmetry because the two probabilities—of finding the oscillator in its ground state, or not—are not on equal footing. D.
Invariance
When one speaks of an invariant prior, one does not mean the invariance under a change of parameterization —all priors are invariant in this respect—but rather a form-invariant construction in terms of a quantity that, preferably, has an invariant significance. We consider two particular constructions that make use of the metric induced by the response of the selected function to infinitesimal changes of its variables. The first construction begins with a quantity F (p) that is a function of all probabilities p = (p1 , . . . , pK ). We include the square root of the determinant of the dyadic second derivative in the prior density as a factor, (� � ) 1/2 ∂2F (dρ) = (dp) det wcstr (p) , (38) ∂pj ∂pk jk
where wcstr (p) contains all the delta-function and stepfunction factors of constraint as well as the normalization factor that ensures the unit size of the reconstruction
9 space [28]. The prior defined by Eq. (38) is invariant in the sense that a change of parameterization, from p to α, say, does not affect its structure, (� � ) 1/2 � ∂2F (dρ) = (dα) det wcstr p(α) , ∂αj ∂αk jk (39) because the various Jacobian determinants take care of each other. For the second construction, we use a data-dependent function G(p, ν) of the probabilities p and the frequencies ν = (ν1 , ν2 , . . . , νK ) with νj = nj /N . Here, the square root of the determinant of the expected value of the dyadic square of the p-gradient of G is a factor in the prior density [28],
TABLE I: Form-invariant priors constructed √ by one of the two methods described in the text. The “ det ” column gives the p-dependent factors only and omits all p-independent constants. The first method [Eq. (38)] proceeds from functions of the probabilities that have extremal values when all probabilities are equal or all vanish save one. The second method [Eq. (40)] uses functions that quantify how similar are the probabilities and the frequencies. The “hedged prior” is named in analogy to the “hedged likelihood” [29]. √ method primary function det X 1 pk log pk 1st − √ p1 p2 · · · pK k
1st
(Shannon entropy) X 2 pk
(Jeffreys prior)
(purity) X νk p k
(primitive prior)
(inner product)
(hedged prior)
1
k
(� � ) 1/2 ∂G ∂G (dρ) = (dp) det wcstr (p) , ∂pj ∂pk jk
(40)
2nd
k
where f (ν) denotes the expected value of f (ν), f (ν) =
X
L(D|ρ)f (ν) .
√
(41)
2nd
X
νk log(νk /pk )
k
(relative entropy)
D
√
p1 p2 · · · pK
1 p1 p2 · · · pK
(Jeffreys prior)
We have, in particular, the generating function exp
K X
a k νk
k=1
!
=
K X
e
ak /N
k=1
pk
!N
(42)
for the expected values of products of the νk s. The prior defined by Eq. (40) is form-invariant in the same sense, and for the same reason, as the prior √ of Eq. (38). Table I reports a few examples of “ det ” factors constructed by one of these two methods. It is worth noting that the Jeffreys prior can be obtained from the entropy of the probabilities by the first method as well as from the relative entropy between the probabilities and the frequencies by the second method. The latter is a variant of Jeffreys’s original derivation [17] in terms of the Fisher information.
E.
Conjugation
Sometimes there are reasons to expect that the actual state is close to a certain target state with probabilities t = (t1 , t2 , . . . , tK ). This is the situation, for example, when a source is designed to emit the quantuminformation carriers in a particular state. A conjugate prior �α (dρ) = (dp) pt11 pt22 · · · ptKK wcstr (p) with α > 0 (43)
could then be a natural choice [30]. The (· · · )α factor is maximal for p = t, and the peak is narrower when α is larger.
The conjugate prior can be understood as the “mock posterior” for the primitive prior that results from pretending that α copies have been measured in the past and data obtained that are most typical for the target state. Therefore, a conjugate prior is quite a natural way of expressing the expectation that the apparatus is functioning well. The posterior content of a region will be data-dominated only if N is much larger than α. In this context, it may be worth noting that the Bayesian mean state, Z (44) ρbbm = (dρ) ρ , R0
computed with the conjugate prior above, is usually not the target state unless α is large. One could construct priors for which ρbbm is the target state, but the presence of the wcstr (p) factor requires a case-by-case construction. F.
Marginalization
All priors used as examples—the ones in Table I and Eqs. (33), (35), (43)—have in common that they are defined in terms of the probabilities and, therefore, they refer to the particular POM with which the data are collected. While this pays due account to the significance of the data, it does not seem to square with the point of view that prior probabilities are solely a property of the physical processes that put the quantum-information carriers into the state that is then diagnosed by the POM.
10 When adopting this viewpoint, one begins with a prior density defined on the entire state space. In addition to the parameters that specify the reconstruction space (essentially the probabilities p), this full-space prior will depend on parameters whose values are not determined by the data. There could be very many nuisance parameters of this kind, as illustrated by the somewhat extreme harmonic-oscillator example of Sec. II A. Upon integrating the full-space prior over the nuisance parameters, one obtains a marginal prior on the reconstruction space. As a function on the reconstruction space, the marginal prior is naturally parameterized in terms of the probabilities and so fits into the formalism we are using throughout. Harking back to the last paragraph in Sec. II A, we note that the invoking of “additional criteria or principles” is exactly what would be required if one wishes to report estimated values of the nuisance parameters. That, however, goes beyond making statements that are solidly supported by the data and is, therefore, outside the scope of this article. The symmetric uniform-in-purity prior of Secs. IV B and IV C provides an example for marginalization if the POM only gives information about x = hσx i and y = hσy i but not about z = hσz i. We express the full-space prior in cartesian coordinates, integrate over z, and arrive at Z∞
1 (dρ) = dx dy 2π
−∞
= dx dy
dz
η(1 − x2 − y 2 − z 2 ) p x2 + y 2 + z 2
1 1 . (45) η(1 − x2 − y 2 ) cosh−1 p 2 π x + y2
This marginal prior is a function on the unit disk in the xy plane, which is the natural choice of reconstruction space here. When one expresses (dρ) in polar coordinates, x + iy = seiϕ with s ≥ 0, one √sees that (dρ) is uniform in ϕ and in s2 cosh−1 (1/s) − 1 − s2 , which increases monotonically from −1 to 0 on the way from the center of the disk at s = 0 to the unit circle where s = 1. Plot (a) in Fig. 4 illustrates the matter.
V.
................................................... .......................................................... ................... ............ ... ............. .................................................................................................... ............ .......... ... . .......... ......................... .. .......... ..... ........... ................ ......................................................................................................................................... ... ..... ............ ........................................... .. .. ...... .............. .................... . ...... ....... ..................................... ....... ..................................... ....... ........... .............................................................................................................................................................................................................. . . ....... ..... ........ . . . . . . . . . . . . . . . . . . . . . . . . . . . . . . . . . . . . . . . . . . . . . . . . . . . . . . . ................ ... . .... ...... . .......... .... .......... ...... ..... ..................... .... .......... ............. ........................ ....................................................................................................... ......................... .............. .................... ... . . ....... .. ..... .... . . ..... . . . . . . . . . . . . . . . . . . . . . . . . . . . . . . . . . .... . .... ..... ....... .... .................................................................. .............. ... .......... ........... ............. ....................... ........................................................................................... ....................... ............. ........... ........... ...... . .... ..... ...... .... .................. .... .... ...... .. . . . . . . . . . . . . . . . ... ... ... ... ... .. .. ....... ....... .... ..... . .... . .. .. . ... ... ... ... .. . ........ ......................................................... ............... .... .... .... . ......... ......... .... ..... ..... ...... .............. .............................................................. ....... ................ ........... ........... ......... ........................ ..... ....... ... ... ........ ................ ...... ....... ........... ........................ ... . . ....... . . .. ........ .. ................. ...... ....... ....... .................. . .... . .... . . ... . ... ..... ............ .... .... ... ... ................................. .......... .............. ........................................................................................... .............. ........... ............................... ..... ... ..... ... .... .................. .... ...... ............. .. ... .. .. ...... .. . ... . .... ...... .. .. .. ....... ....... ...... ............................... ........... ......................................................................... ........... ............................... ....... ...... ....... .... ..... . ... . ... ... ............... ...... ....... ..... .................................................. .... ........ ...... .............. .... .... . . . . . ... ....... ... .. ... . ... ... ..... .... . . . . .. .... .. ...... .. .... .. .. .. ......... .. ..... ... ..... .... .... .... .. ... ..... ....... .... .... ..... ..... ... ... .. . ........... ... ... ...... ... .. ... .... .... .... .... .... ................ ..... .... ... ... .... ................. . ... ..... . .. .. .. . .... ....... ... ... .............................. ..... ...... ............... .... .... .... .... .. .. .. . ... .. .. .... ...... ...... ...... ...... ...... ....... .......................... ........ ....... ....... ......................... ....... ....... ....... ...... ...... ...... ..... .... .. ..... ... .. ... .. . . ... ........ .... .... ... ... ... .. . ... ... .. .. ... .. ... ... ... ... ... ... .. .. ... .... .... ............... ........ ..... .... .... ........ .............. . . . . ...... ... .. . .. .. .. .. . ... .. ... ... .... .... .... .... . ...... ..... .... .... ...... .... ....... .. .... .... .... ... ... . ... ... .. .. .. .. ... ... .. .. .... ... .... .... .... ..... .. ........ ...... .. .. .. ........... . .. ... ... ... .. ... .. .. .. ... .... ... ... .. .... .... .... ... .. .. .. .. ... ... ........... ..... .... .... ........... .... ...... ... .. .. ...... .. .. .. .. .. .. .. . . . . . .... .... ... ... ..... ... . .. .. .. . .. .. . ... .. .. . .. . .. .. .. .. .. .. . .. ................................................................................................................................................................................................................................................................................................................................................................................................................................ ................................................................................................................................................................................................................................................................................................................................................................................................................................. . . .. . . ... ... ........ ... ... ... ....... ... . . . .. . .. . .. .. . . .. . .. .. .. .... .... ... .... .... .... .. ...... ... ... ... ....... ..... ... .. .. . .. .. . .. .. ... . . .. .. .. ..... .. .. .... .... .... .... ... ... ...... . .. .. ..... ... .. .. .. .. . . . .. .. ... ............... ..... .... .... ................. .... .... .... ... ... .. .. ... ... .. ... .. .. ... ... ... .... .... .... ..... .... ........... ..... .... ..... ............ .... .. .. .. .... .... .... .... ....... .. ........ . . ... . ... .. .. ............ ... . . ... . ... .. .. ......... . .. ... .. .... ...... ...... ...... ...... ...... ....... .......................... ....... ...... ....... .......................... ....... ...... ...... ..... ...... ...... .... .. ... ... .... ..... ............... ...... ..... .............................. ..... ....... ............... ..... .... .... .. .. . . ... ... ... . ..... . .. ... .... ... ... .... .... .... .... .... ............... ... ...... . ... ... .......... .... ... .. ........... .. ... ........ .. ... ... .. .. .. ... ... ...... ..... .. ....... ... ... .. . .... . ... .. ... ... ........... ... ... .... .. .. ... .. ... ... ......... ....... ... ................ .... .... .... .... .. . ..... ... . . . . . .... ........ .... ................................................. .... ........ ...... .............. .... . . . . . . ... ... ........... . . . . ... . . . . . . . . . . . . . . . . . . . . . . . . . . . ... .... .... .... ............ ..... ...... .... .................................... .... ...... .... ............ ... ..... .... ... .. ..... ....... . .... ... ......... .. ........... ... ... .. .. ... ... ... . .. . ........ . .. ..... .. ..... . .. . .... ........ ... ..... ..................... ...... ....... .............. ... ....... .. .. . .... ... ........................ ......... ........... ...................... ............................................................ ....................... ........... ......... ......................... ..... ... ...................... ...... ...... ....... .......................... ...... ................................ ............ .......... ........ ................................ .... .... ..... .. ......... . ........ .... .......... . ................................ .. ... ... ....... ... ....... ..... ...... ...... ....... .............. .................... ... ............................ .... .......... ...... .. .... .... ... .... ...... ...... ..... ..... ... ... .. .... ............... ... .... .... ... ... ..... ..... ...... ........ .... .............. . ..... ......... .... .. . . ......... . ... ... .... . . . . ...... ................. . . . . .... .... . . . . . . . . . ................ .......... .... ......... ....... ...... ..... ... .... ..... ...... ....... ........... ............... ..... ... ....... ...... ... .... ... . ................................................. . . .. ................................................... .... ....... .... ... .... . ..... ... ........ . ..... ........... ......... ....... ...... ..... ........ . . . . . . . . . . . . . . . . . . . . . . . . . . . . . . . . . . . . . . . . . . . . . . . . ... .... ....... ........ ........... ........................ ... ........................ ............ ....... ....... ... .......... ..... .. .... ... ..... ........... ................. ........ ... ........ .................................. . ..... . ..... ...... ... .......... ...................................................... . ..... .... ........ ...... ..... . ....... . . . . . . . . . . . . . . . . . . . . . . . . . . . . . . ...... ......... ............... ............................. .... ............................. ............. ......... ..... . .... . ...... .... . .............................. . . . .. ...... ........... .................. ...... ....... ................................................................................................................ ....... .......... ............ .............. ............................................................................................................................................ ........ ........... .... .... . .......... ....................... .. .......... .. ............. .......................................................................................................... .......... ............. ........................... .... ........................... .............................................................................. ...... ......................s................ ...................................................................... ................................................................................................................................... ............. .......... .................................................................................................................................. .......... ......... .................................... ................... ......... ................... ..................................... ........ ...... .................... .......... ........... ............... ......................................................................................................... ...... ...... ...... ........ ............ ........... ............ ..... . ... ..... ..... ....... . .......................................................................... ...................................................... ................................................................................. . . . . ...... . . . .................................................. .... ...... ............ ................. .................................... ................. ................ ............................ ................ ................. ........................................ .... .... ..... . . ........... . . . . . . . . . . . . . . . .... . ....... .. ... . .. . . . ... . . . . ... .. .. .... . ..... ...... ................................... ........... .................... ................... ...... ................... .................... ............ ...................................... .... ..... ........ ............................................................... . ...... . .... . . . . . . . . . . . . . . . .... ...... . . ....... .... .... ... ... .. .. .. ...... .... ....... ....... ... .... .. ... ... ... ... .... ....... .. ...... .... ...... . .... . . . . . ... . . ....................................... ........... ........... .................... .................................... .................... ............ .......... ......................................... .... . .... .... ... .... ... .... ... ... ... ....... ....... .. .... . .... .... ............ .. .. .. ... ... .... .... .................................................. . . . . . . . . . . . . . .... ..... .. . . . . ... . . . .......... . . . . . .................................................... ........... ........... . . . ... ...... .... .......... ... .. ... . . .... ..... .. ... .... .. . ...... ...... .. ... ..... ........... ... ... ... .. .. ... ... . ... .... ..... ... ... ....... . . . ..... .... . . . . . . . . . . . . . . . . . . . . . . . . . ... . . . . . . . . . . . . . . . .................. ....... ........ ..................................... . . .... .... .. .......... ... ... .. ... ... .. ... . ... ... ... . . .. . ... .... .. .... .... ... ... ... .. ... .. . ... ... .. ... ... ... ... ... .... ................. ... . . . . . . . . . . . . . .... . . . ... . ........... ...... ...... ....... ....... .................................... . . . . . . . . ... .. ... ......... ... ... ... .... ... ... ..... . .. . ... .. ... ... ... ... .. ... ... . ... . .. ... .. ... ... ..... ... .. ... ............ . . . . . ... .. .... . . . . . ... ............. . . . . . . . ... . . . . . . ............... ...... ...... ....... ....... . . .. ... ... ... .. ... ... ... ... ... .... ....... . ..... . . . .. .. .. .. ... . .. .. ... ... ... ... ... .. .... ....... .... .... ..... ............ .. . .. .. ... ... . ... . . . . . . . . . . . . . . . . . . . . . . . . . . . . . . ............... ...... ....... ....... ....... . . .... . . ... ... . .. . . . . .. . .. . ... . .. .. .. .. ... .. .. .. .. .. s........................................................................................................................................................................................................................................................................................................................................................................................................................................................................ s ..... .. .. .. .... ... ... . .. .... ... ... .... .... .... .. .. ... .. ... . .. . .. .. .. .... .... .... ...... ...... .... ... .... ........... . . . . . . . . . . . . . . . . . .. . . . . . . . . . ... ....... ...... .... ... .... ..... .... .. ... .. ... . ... .. .. .. ... .. .. .. .. .. ... .. .. ....... ... .. ... .. ....... ... .. .. .. .. ... .... .... ... ..... .... .... ....... ....... ..... . . ....... ..... ..... ..... ..... ..... . . ... ............ . . . . . . . . . . . . . . . . ... ... ......... ... ... ... . . ... ...... ... .... .... ... ..... ..................... .. .. ... ... ... .. . ... ... ... .. ... ... ... ... . ... ... . . . ... . . ... ........ ..... ..... ..... ..... ................... ....... ....... ...... ....... ........... ........................... ........ ....... ....... ................. ... . ... . . .. .... ... ... ... .... ... .... ... ... .... .... ... ........ ..... ..... ...... ..................... ....... ... ... .... ................. .... .... .... ....... .... .... ... ... .... ... ...... ..... .. ... ... . . . . ....... ... ... .. ....... ..... ... . ... .. .. ....... ..... ...................... ....... ........ .. .... .... .... .... ....... .. .. .. . ........ ...... .... ... ... .... ..................................................... ... .... ... .............................. ....... ....... ........ ...... .................. ...... ......................... ........... .......... ........................................................ ... ... ..... .... .... .... ................. ..... . . . ..... ... ...... ... .. .... ............. ..... ....... ....... ....... .............. .... ... .... .... ...... .... ...... ...... ..... .... .... ...... .. ..... ... .... ..... ..... ..... ....... ........... ... .... ...... ..... . .. . . ... . .... ...... . ..... ... .......... ..... ....... . . . . ...... .... ......... ....... ....... ...... ...... .... . . .... ...... ...... ....... ....... ........ .... .......... . . . . . . . . . . . . ... . . . . . . . . . . . . . . ...... ................................................. .... ....... . .. .. . .... ..... ....... .... ...... ....... ....... ........ .............. . .... .... ... .... ... .. ....... .... ...... ....... .... .... ....... ........ ........ ............ ........... .................................. .................................... ........................................... ........ ............ .... .... ............ ................... ..... ....... ....... ........ ............ ........... ... ............ ............. ........ ....... ...... .... ............................................ ...... .... ............... ......... .............. ........... ............................... .......... ............. ......... ......... ..... ...... ..... ................ .............. ............. ............... ..... ............... ............ .............. ............... ....... ...... ..................... ........... ............ ................................. ............. .......... ..................... ........ ....... . . . ...................................... .................... .... ................... ...................................... . . . . . . . . ........... ................................................................................................................................... ........... ............... ....................................................................................................................................... .......................................................... ....... .
(a)
.
(b)
(c1)
(c2)
s
(d1)
(d2)
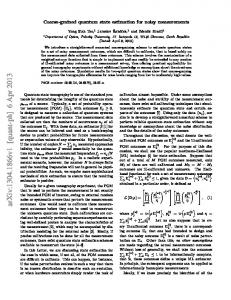
FIG 4 Un orm t ngs o the un t d sk or our d fferent pr ors The d sk s n the xy p ane w th the x ax s hor zonta the y ax s vert ca and the d sk center at x = y = 0 T ng (a) s or the marg na pr or o Eq (45) t ng (b) dep cts the pr m t ve pr or o Eq (51) t ngs (c1) and (c2) ustrate the Jeffreys pr or o Eq (52) w th the b ue dots (•) ust outs de the un t c rc e nd cat ng the our d rect ons onto wh ch the POM outcomes pro ect and t ngs (d1)and (d2) are or the Jeffreys pr or o Eq (53) the b ue dots mark ng the three d rect ons o the tr ne pro ectors In each t ng we dent y 96 reg ons o equa s ze by d v d ng the d sk nto e ght “tree r ngs” o equa s ze and twe ve “p e s ces” o equa s ze In the t ngs (a) (b) (c1) and (d1) the boundar es o the p e s ces are (red) rays and an arc o the un t c rc e n the t ngs (a) (b) (c2) and (d2) the tree r ngs have concentr c c rc es as the r boundar es
EXAMPLES
four-outcome POM (K = 4) w th probab t es For illustration, we consider the simplest situation that exhibits the typical features: The quantum-information carriers have a qubit degree of freedom, which is measured by one of two standard POMs that are not informationally complete.
A.
POMs and priors
p1 p2
�
1 = (1 ± x) 4
p3 p4
�
=
1 (1 ± y) 4
(46)
The perm ss b e probab t es are dent fied by wcstr (p)=η(p) δ(p1 +p2 − 21 ) δ(p3 +p4 − 21 ) η(3−8p2 ) (47) where
For both POMs, the unit disk in the xy plane suggests itself for the reconstruction space R0 . The first POM combines projective measurements of σx and σy into a
η(p) =
K Y
k=1
η(pk )
and p2 =
K X
k=1
p2k
(48)
11 The dotted equal sign in Eq. (47) stands for “equal up to a multiplicative constant,” namely the factor that ensures the unit size of the reconstruction space. The second POM is the three-outcome trine measurement (K = 3), whose outcomes are subnormalized √ projectors on the eigenstates of σx and (−σx ± 3 σy )/2 with eigenvalue +1. It has the probabilities 1 p1 = (1 + x) , 3
p2 p3
�
√ 1 = (2 − x ± 3 y) , 6
(a)
0.8 0.6
(49)
0.4 0.2
for which
... .. ... .. .... λ ... ... ... ..... .. ... ... ... ..... ..... .. ... ... ..... .. ... λ ... ... . ..........................................................................................................................................................................................................
(dρ) = dx dy
1 dϕ η(1 − x2 − y 2 ) = ds2 , π 2π
ds s dϕ (dρ)= ˙q . 1 − s2 + 14 s4 sin(2ϕ)2
0.6
0.8
λ
1
(b)
ó
.. ... .
øó
cλ
0.8 ............ .. ... .
0.6 ........... .. ... .
0.4 ............ ... .. .
sλ
0.2 ............
.. ... . ..........................................................................................................................................................................................................
(52)
(53)
and the tilings of plots (d1) and (d2) in Fig. 4. The cross-hairs symmetry of the four-outcome POM and the trine symmetry of the three-outcome POM are manifest in their respective uniform tilings. B.
0.4
1 ......
Plots (c1) and (c2) in Fig. 4 show uniform tilings of the unit disk for this prior. For the three-outcome POM, we have the Jeffreys prior [31] ds s dϕ (dρ)= ˙q 1 − 34 s2 + 41 s3 cos(3ϕ)
0.2
(51)
where 0 ≤ s ≤ 1 and ϕ covers any convenient range of 2π. This prior is uniform in x and y, and in s2 and ϕ. The polar-coordinate version is the more natural parameterization of the unit disk; it is used for plot (b) in Fig. 4. The Jeffreys prior for the four-outcome POM is [31]
ó
s
(50)
summarizes the constraints that the permissible values of p1 , p2 , p3 obey. Both POMs have the same primitive prior,
ø
c
0
wcstr (p)=η(p) ˙ δ(p1 + p2 + p3 − 1) η(1 − 2p2 )
ó
1 .......
Simulated measurements
Figures 5(a) and 5(b) show SCRs obtained for simulated experiments in which N = 24 copies of a qubit state are measured. The actual state used for the simulation has x = 0.6 and y = 0.2. Its position in the reconstruction space is indicated by the red star (⋆). In Fig. 5(a), we see the SCRs for the four-outcome POM. Two measurements were simulated, with (n1 , n2 , n3 , n4 ) = (8, 5, 10, 1) and (6, 3, 10, 5) clicks of the detectors, respectively, and the triangles (△) show the positions of the corresponding MLEs. For each data, the plot reports the SCRs with credibility c = 0.5 and c = 0.9, both for the primitive prior of Eq. (51) and for
0
0.2
0.4
0.6
0.8
λ
1
FIG. 5: Smallest credible regions for simulated experiments. Twenty-four copies are measured by the POMs of Sec. V A, which have the unit disk of Fig. 4 as the reconstruction space. Plot (a) is for the four-outcome POM with the cross hairs indicating the orientations of the two projective measurements. Plot (b) is for the three-outcome measurement with the orientation of the trine indicated. The red star (⋆) at (x, y) = (0.6, 0.2) marks the actual state that was used for the simulation. For each POM, there are SCRs for the data of two simulated experiments, with black triangles (△) indicating the respective MLEs. The boundaries of the SCRs with credibility c = 0.9 are traced by the continuous lines; all of these SCRs contain the actual state. The dashed lines are the boundaries of the SCRs with credibility c = 0.5; the actual state is inside half of these SCRs. Red lines are for the primitive prior of Eq. (51), the blue lines are for the Jeffreys priors of Eqs. (52) and (53), respectively. — The insets in the lower left corners show the size sλ and the credibility cλ for the BLRs of two simulated experiments. Inset (a) is for (6, 3, 10, 5) counts for the four-outcome POM and the Jeffreys prior; inset (b) is for (13, 7, 4) counts for the three-outcome POM and the primitive prior. The dots show the values computed with a Monte Carlo algorithm. There is much more scatter in the cλ values than the sλ values. The red lines are fits to the sλ values, with the fits using twice as many values than there are dots in the insets. The green lines that approximate the cλ values are obtained from the red lines with the aid of Eq. (26).
12 the Jeffreys prior of Eq. (52). The actual state is inside two of the four SCRs with credibility c = 0.5 and is contained in all four SCRs with credibility c = 0.9. Not unexpectedly, we get quite different regions for the two rather different sets of detector click counts. Yet, we observe that the choice of prior has little effect on the SCRs, although the total number of measured copies is too small for relying on the consistency of the priors. The same remarks apply to the SCRs for the three-outcome POM in Fig. 5(b); here we counted (n1 , n2 , n3 ) = (15, 8, 1) and (13, 7, 4) detector clicks in the simulated experiments. In Sec. III C we remarked that the estimator regions are properly communicated by reporting sλ and cλ as functions of λ. This is accomplished by the insets in Fig. 5 for two of the four simulated experiments. The dots give the values obtained by numerical integration that uses a Monte Carlo algorithm. The scatter of these numerical values confirms the expected: The computation of sλ only requires sampling the probability space in accordance with the prior and determining the fraction of the sample that is in Rλ ; for the computation of cλ we need to add the values of L(D|ρ) for the sample points inside Rλ ; and since L(D|ρ) is a sharply peaked function of the probabilities, the sλ values are more trustworthy than the cλ values for the same computational effort. The line fitted to the sλ values is a Pad´e approximant (see, for example, section 5.12 in Ref. [32]) that takes the analytic forms near λ = λ0 = 0 and λ = 1 into account. The line approximating the cλ values is then computed in accordance with Eq. (26). VI.
OUTLOOK
For the given data and chosen credibility, the SCR is a neighborhood of the MLE. In this sense, then, one can regard the SCR as identifying error bars on the parameter values of the MLE in a systematic way. Thereby, the MLE is often a state whose probabilities equal the observed frequencies, and if there is no such state in the reconstruction space, efficient methods are at hand for computing the MLE. We are, however, currently lacking equally efficient algorithms for finding the SCR. Progress on this front is needed before one can apply the concepts of MLRs and SCRs to situations in which
ˇ aˇcek, eds., Quantum State Estima[1] M. Paris and J. Reh´ tion, Lecture Notes in Physics, vol. 649 (Springer-Verlag, Heidelberg, 2004). [2] It is advisable to verify that the observed sequence does not have systematic correlations that speak against the assumption of independently and identically prepared quantum-information carriers. ˇ aˇcek, J. Fiur´ [3] Z. Hradil, J. Reh´ aˇsek, and M. Jeˇzek, Maximum-Likelihood Methods in Quantum Mechanics,
the reconstruction space is of high dimension. Upon recalling that informationally complete POMs for twoqubit systems already have a 15-dimensional reconstruction space, the need for powerful numerical schemes is utterly plain. In many applications, one is interested in a few parameters only, perhaps a single one, such as the concurrence of a two-qubit state or its fidelity with a target state. It may then be possible to reduce the dimensionality of the problem by marginalizing the nuisance parameters, preferably proceeding from a utility-based prior. Even after such a reduction, there remains the challenge of evaluating the multi-dimensional integrals that tell us the size of the BLRs, and then their credibility, so that we can identify the looked-for MLR and SCR. For this purpose one needs good sampling strategies [33]. It is suggestive to rely on the data themselves for guidance. The full sequence of detector clicks identifies the MLE of the data, and subsequences—chosen randomly or systematically—have their own MLEs. These bootstrapped MLEs are expected to accumulate in the vicinity of the full-data MLE and may so provide a useful sampling method. We have just begun to enter this unexplored territory and will report progress in due course. We close with a general observation. MLEs, MLRs, SCRs, and confidence regions are concepts of statistics, even if the terminology is not universal. As we have seen, the quantum aspect of the state estimation problem enters only through the Born rule which restricts the probabilities to those obtainable from a POM and a bona fide statistical operator. Except for these restrictions, there is no difference between state estimation in quantum mechanics and standard statistics. Accordingly, quantum mechanicians can benefit much from the methods developed by statisticians.
Acknowledgments
We benefitted greatly from discussions with David Nott and thank him in particular for bringing Refs. [8] and [18] to our attention. The Centre for Quantum Technologies is a Research Centre of Excellence funded by the Ministry of Education and the National Research Foundation of Singapore.
Chapter 3 in [1]. [4] Y. S. Teo, Numerical Estimation Schemes for Quantum Tomography, Ph.D. thesis (Singapore, 2012); available as eprint arXiv:1302:3399[quant-ph] (2013). ˇ aˇcek, D. Mogilevtsev, and Z. Hradil, New [5] J. Reh´ J. Phys. 10, 043022 (2008). [6] K. M. R. Audenaert and S. Scheel New J. Phys. 11, 023028 (2009). [7] B. Efron and R. J. Tibshirani, An Introduction to the
13 Bootstrap (Chapman & Hall/CRC, New York 1993). [8] M. J. Evans, I. Guttman, and T. Swartz, Can. J. Stat. 34, 113 (2006). [9] J. O. Berger, Statistical Decision Theory and Bayesian Analysis (2nd ed., Springer, New York, 1985), Chapter 4. [10] M. Christandl and R. Renner, Phys. Rev. Lett. 109, 120403 (2012). [11] R. Blume-Kohout, Robust error bars for quantum tomography, eprint arXiv:1202.5270[quant-ph] (2012). [12] E. T. Jaynes, Phys. Rev. 106, 620 (1957). [13] E. T. Jaynes, Phys. Rev. 108, 171 (1957). ˇ aˇcek, and [14] Y. S. Teo, H. Zhu, B.-G. Englert, J. Reh´ Z. Hradil, Phys. Rev. Lett. 107, 020404 (2011). [15] V. Buˇzek, Quantum Tomography from Incomplete Data via MaxEnt Principle, Chapter 6 in [1]. [16] The symbol η( ) denotes Heaviside’s unit step function, and δ( ) is Dirac’s delta function. [17] H. Jeffreys, Proc. Roy. Soc. London Series A 186, 453 (1946). [18] R. E. Kass and L. Wasserman, J. Am. Stat. Assoc. 91, 1343 (1996). ˇ aˇcek, and [19] Y. S. Teo, B. Stoklasa, B.-G. Englert, J. Reh´ Z. Hradil, Phys. Rev. A 85, 042317 (2012). [20] It is possible to account for detector inefficiencies (some carriers escape detection) and dark counts (spontaneous detector clicks), but such technical details, as important they may be in practical applications, are not material to the current discussion. [21] The negative logarithm of the point likelihood is N times the sum of the relative entropy between the probabilities p and the frequencies ν, and the Shannon entropy of the frequencies (see Table I), −
X 1 νk X νk log νk log νk . log L(D|ρ) = − N pk k
k
[22] [23]
[24] [25] [26] [27] [28] [29] [30]
[31]
[32]
[33]
Since the relative entropy is a convex function of the probabilities, the logarithm of the point likelihood is a concave function of p. L. A. Wasserman, Ann. Stat. 17, 1387 (1989). If we wish to be quantitative about these beliefs, we can use the number 10 log10 (CR /SR ) to measure the evidence for the hypothesis that the actual state is in region R (in units of dB). Then there is more evidence in favor of the BLR Rλ than for any other region of the same credibility. A set C composed of SCRs with high credibility suggests itself for the Christandl-Renner construction. E. L. Lehmann and G. Casella, Theory of Point Estimation (2nd ed., Springer, Berlin, 1998). H. K. Ng, K. T. B. Phuah, and B.-G. Englert, New J. Phys. 14, 085007 (2012). E. T. Jaynes, Probability Theory—The Logic of Science (Cambridge University Press, Cambridge, 2003). Since wcstr (p) enforces all constraints, the pk s are independent variables when F (p) and G(p, ν) are differentiated in Eqs. (38) and (40), respectively. R. Blume-Kohout, Phys. Rev. Lett. 105, 200504 (2010). Such priors are called “conjugate” in standard statistics literature because the (· · · )α factor has the same structure as the point likelihood: a product of powers of the detection probabilities. When integrating the right-hand sides of Eqs. (52) and (53) over the unit disk, one obtains π 2 /2 and 4π − 24 sin−1 (1/3), respectively. W. H. Press, S. A. Teukolsky, W. T. Vetterling, and B. P. Flannery, Numerical Recipes: The Art of Scientific Computing (3rd edition, Cambridge University Press, Cambridge, 2007). See, for example, the discussion in Sec. 3 of Ref. [8].