communication as a CORBA service, beside the ORB. ... the hardware resource contention, as a result of the chosen .... replicas or of recovery from faults (failure.
Optimal object state transfer - recovery policies for fault tolerant distributed systems Panagiotis Katsaros Constantine Lazos Department of Informatics, Aristotle University of Thessaloniki 54124 Thessaloniki, GREECE {katsaros, clazos}@csd.auth.gr
Abstract Recent developments in the field of object-based fault tolerance and the advent of the first OMG FTCORBA compliant middleware raise new requirements for the design process of distributed fault-tolerant systems. In this work, we introduce a simulation-based design approach based on the optimum effectiveness of the compared fault tolerance schemes. Each scheme is defined as a set of fault tolerance properties for the objects that compose the system. Its optimum effectiveness is determined by the tightest effective checkpoint intervals, for the passively replicated objects. Our approach allows mixing miscellaneous fault tolerance policies, as opposed to the published analytic models, which are best suited in the evaluation of single-server process replication schemes. Special emphasis has been given to the accuracy of the generated estimates using an appropriate simulation output analysis procedure. We provide showcase results and compare two characteristic warm passive replication schemes: one with periodic and another one with load-dependent object state checkpoints. Finally, a trade-off analysis is applied, for determining appropriate checkpoint properties, in respect to a specified design goal.
1. Introduction Object-based fault tolerance has been recently standardized ([15]) in a plain specification (OMG FTCORBA), which aims to provide robust support for software systems that require a high level of reliability. Typical cases of such systems are large or small critical systems, such as medical equipment control units, embedded applications, communication and financial systems and supply chain and other applications.
The OMG FT-CORBA standard allows the definition of appropriate fault tolerance properties, for each replicated object (object group). The following strategies are supported: request retry, • • redirection to an alternative server, • passive (primary/backup) replication and • active replication. The first middleware infrastructures that provide standard-compliant transparent fault tolerance adopt either: • the interception approach, where the messages issued by an object request broker (ORB) are intercepted and mapped to a group communication system, or • the service approach, which provides group communication as a CORBA service, beside the ORB. Eternal ([13]) is a well-known and successful instance of the first case. On the other hand, the second approach has been successfully adopted in [3] and [2]. An older but not fully CORBA compliant approach is the one adopted in Electra ([11]), where an existing group communication system is integrated within an ORB. Although much research has been devoted to the provision of fault tolerance support in an application transparent manner, there is still lack of an approach for determining appropriate checkpoint properties, in respect to the specified design goals ([19]). One valuable report of experiences, strategies and challenges in building fault-tolerant CORBA systems is the one published in [4]. The work described here provides a simulationbased design approach, for comparing fault tolerance schemes composed of miscellaneous policies - from now on called composite schemes. The term miscellaneous refers to any specific policy applied to a replicated object, which may be either active, warm
passive or cold passive replication, with different fault tolerance properties. The developed simulator allows to realistically model the objects interaction effects, regarding: the simultaneous resource possession, caused by the synchronous, often nested object invocations, which block the callers, until they get a reply, the hardware resource contention, as a result of the chosen replica placement, the load caused by the checkpoint state transfers between replicas of the same object and the load caused by a replica restart (repair) or re-invocation of the logged requests, according to the OMG FT-CORBA specification ([15]). The proposed evaluation approach rests on a basis, which we call “the tightest effective checkpoint intervals”. More frequent checkpoints are considered to be effective, when they result in a reduction of the response times of the fault-affected requests. If there is no chance of further improvement for all possible interval reductions in a vector of n checkpoint intervals - where n the number of passively replicated objects -, this vector specifies the tightest effective checkpoint intervals. Thus, for a composite fault tolerance scheme, the tightest effective intervals determine the minimum response times that the scheme may achieve for the fault-affected service requests. We say that this vector characterizes the scheme’s optimum effectiveness. These checkpoint intervals constitute the single criterion that makes feasible the comparison with other schemes composed of possibly different replication policies and checkpoint placement mechanisms. The validity of the suggested approach is demonstrated by comparing two characteristic wellknown passive replication schemes: one with periodic (PSC) and another one with load-dependent object state checkpoints (LDSC). We provide results for different workloads and object state sizes. Finally, a trade-off heuristic is used for determining appropriate checkpoint intervals, in respect to a specified design goal. Related modeling approaches have been published prior to the advent of the OMG FT-CORBA standard and they are mainly focused on the use of analytic models, for the performance and reliability evaluation of various passive replication schemes. Such models are best suited in the evaluation of single-server process replication schemes and do not support the possibility to mix miscellaneous policies in a single composite fault tolerance scheme. Worth to mention are the results published in [5]. Regarding the
• • • •
published simulation-based approaches, we have found only the one reported in [16], for general-purpose and not specifically for object-based distributed systems. In section 2 we describe the object fault types, for which the proposed evaluation approach is applied and the assumed fault detection mechanism. Section 3 summarizes the functionality of the developed simulation software. Section 4 introduces the employed case system model and the compared fault tolerance schemes. Section 5 provides estimates of the resulted fault tolerance overhead and section 6 presents a fault tolerance trade-off analysis, for determining appropriate checkpoint properties, in respect to the specified design goals. Finally, the paper concludes with a discussion, on the impact of our work and its future development prospects.
2. Object fault models and fault detection Our work aims at modeling object faults that do not recur after recovery, as they are documented in the related OMG FT-CORBA specification ([15]). Some of them may be hardware dependent (e.g. insufficient memory) and others may be attributed to media failures, power outages, human lapses, catastrophic events, the use of local timers, the use of multithreading etc. Multithreading objects are not supported by the current version of the developed simulation software. The faults conform to the fail-stop model ([18]), which means that objects fail by crashing, without emission of spurious messages. We do not make any assumptions about the network topology or the protocols making up the interprocess communication service, except that communication is accomplished through loss less FIFO channels. Network partitioning faults that separate the hosts of the system into two or more sets are not addressed. Finally, we ignore the possibility of commission faults that take place, when an object or host generates incorrect results. The simulator features an extensible object-oriented design that allows easy incorporation of alternative object fault - repair distributions and implementation of realistic load dependent fault models, like those used in [6]. Moreover, it allows taking into account fault propagation scenarios, as in cases of collocated object replicas. The modeled fault detection mechanism assumes the existence of a transparent and fault tolerant fault monitoring service. Each object is periodically checked, according to the specified time interval, which represents the sum of the fault monitoring interval plus the time allowed for subsequent response from the
object, to determine whether it is faulty. In the current version, hardware and network resource contention for the fault monitoring activity is not taken into account. However, it has been found ([5]) that it causes an approximate 5% increment, in the processor utilization (of a Pentium-II based 200+ MHz machine), for about 500 milliseconds.
3. Object fault tolerance mechanisms and simulation output analysis To render an object fault-tolerant, several replicas of the object are created and managed as a single object group. The client objects invoke methods on the server object group and the members of the server group execute the methods and return their responses to the clients, just like a conventional object. Because of the object group abstraction, the client objects are not aware that the server objects are replicated (replication transparency) and are not aware of faults in the server replicas or of recovery from faults (failure transparency). Each object group has an associated set of fault tolerance properties. Such properties include the replication style (active, cold passive or warm passive replication), the initial number of replicas, the minimum allowed number of replicas, the fault monitoring interval and the checkpoint interval. The principle of strong replica consistency requires that the states of the members of an object group remain consistent (identical) as methods are invoked on the object and as faults occur. Thus, for each object, strong replica consistency retains an appropriate context that depends on the group’s replication style. Active replication requires that all the members of an object group execute each invocation independently, but in the same order. The individual replicas maintain exactly the same state and in case of a fault in one member, the application can continue with the results provided by another member, without having to wait for fault detection and recovery. Strong replica consistency for active replication means that, at the end of each method invocation on the object, all the group members have the same state. Each group member responds to all incoming requests, but duplicate requests/replies are detected and suppressed, thus delivering only a single request/reply to the destination object. When in a degraded mode of operation the number of live replicas falls bellow the specified minimum number of replicas, each failed replica is being recovered. This involves the accomplishment of an object state transfer from a live replica (if there is any). If, in the course of this state transfer, the
interacting replicas receive additional invocations, all of them are enqueued locally and subsequently applied to the destination replicas. Although active replication causes high replica utilization, it is useful when the cost of transferring an object’s state is larger than the cost of executing a method invocation or when the time available for recovery after a fault is tightly constrained. Cold or warm passive replication requires that during fault-free operation, only one member (the primary) of the object group executes the methods invoked on the group. The state of the primary and the sequence of the invoked methods are recorded in a log, according to the specified checkpoint properties. Strong replica consistency implies that, at the end of each state transfer, all of the members of the object group have or have access to the same state. In the presence of a fault, a backup member is promoted to be the new primary. The state of the new primary is restored to the state of the old one, by reloading its state from the log and subsequently reapplying the request messages that have been recorded in the log. This implies that a client can re-invoke a request on a server and receive a reply to that request, without risk that the operation will be performed more than once. Replica restart on a different processing node is not supported in the current version of the developed simulation software. In cold passive replication, the backup replicas have not been activated. When the current primary fails, a new one is elected and then activated. In warm passive replication, the backups have been already activated and their state is continuously synchronized with the primary replica’s state, according to the specified checkpoint properties. Passive replication is useful when the cost of executing a request is greater than the cost of transferring the object’s state and the time for recovery after a fault is not constrained. State transfer durations depend on the object state sizes, the bandwidth and, in the case of warm passive replication, on the processing speed of the slowest backup replica. A state transfer may be initiated only when it is not violating the object group’s replica consistency. Thus, it is postponed when the primary is in-between an invocation service or it happens to be blocked, waiting for a response. In the course of a state transfer, new invocations may be received, but they cannot be processed, before the end of it. Special emphasis has been given to the accuracy of the generated estimates, by the use of an appropriate simulation output analysis procedure. This procedure ([14]) exploits a representation of the required steadystate measures in terms of quantities, which are based
on the sample paths between two successive system entries into some set of states, say A. In a continuously operating service, where requests are assigned to a number of - from now on called - service objects, a target set of states for the mean response time in such an object, includes any state that the object’s primary fails and its request queue is found to be empty. Acycles are not independent and identically distributed and for this reason we use the batch means estimation. Successive A-cycle based quantities are grouped into non-overlapping batches and their means are treated as independent and identically distributed observations. The validity of the described approximation increases with the batch size. The number of A-cycles and the batch size is determined dynamically, by the Law and Carson sequential procedure ([10]), on the basis of the relative precision to be achieved. The reported results were obtained as 95% confidence intervals with half width interval no more than 3% of the estimated value.
4. A case system study The proposed evaluation approach attempts the comparison of composite fault tolerance schemes, on the basis of their optimum effectiveness, as it is given
by the tightest effective checkpoint intervals for the passively replicated objects. For a composite fault tolerance scheme, its effectiveness is measured by the mean of the fault-affected requests response times. The vector of the tightest effective checkpoint intervals is found empirically, by the performance of trial simulation runs. We have found that, in a system with synchronous nested method invocations, the service objects’ checkpoint properties have a more significant impact on the mean of the fault-affected requests response times. Thus, the tightest effective checkpoint intervals may be found by a layer-to-layer decision procedure, in a relatively small number of runs, which depends on the number of interacting objects. Such a heuristic procedure is thoroughly described in section 6. For the chosen replica placement, the overall evaluation approach includes the selection of the less costly fault tolerance scheme, in respect to the varied system load and object state sizes and the performance of a suitable trade-off analysis, for the choice of appropriate checkpoint properties and the prediction of the resulting quality of service expectations.
• •
1 primary state:
backup state:
NORMAL
NORMAL
2
3
4
primary state:
backup state:
primary state:
backup state:
STATE TRANSFER
STATE TRANSFER
STATE TRANSFER
FAILED
6
backup state:
primary state:
backup state:
NORMAL
FAILED
FAILED
NORMAL
7
primary state:
backup state:
FAILED
STATE TRANSFER
5
primary state:
8
9
primary state:
backup state:
primary state:
backup state:
primary state:
backup state:
FAILED
RECOVE RING
RECOVE RING
FAILED
FAILED
FAILED
10
11
primary state:
backup state:
RECOVERI NG
RECOVERI NG
primary state:
backup state:
NORMAL
RECOVE RING
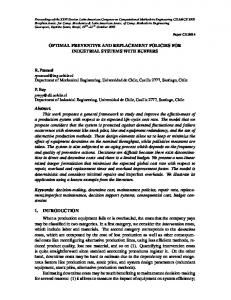
Figure 1. State transitions of a warm passively replicated object with one backup replica
In each individual object, let us consider the application of the warm passive replication policy shown in Figure 1. The object group states (1, 2, 3 etc.) shown in the diagram are determined by the state of the primary (NORMAL, FAILED, STATE TRANSFER or RECOVERING) and the state of the single backup replica. In states 2, 3, 5, 6, 7, 8, 9 and 10 the primary is not available for servicing dispatched requests, but this cannot be observed in states 5, 6, 7 and 9 up to the detection of the occurred fault. An object replica moves to STATE TRANSFER as a result of a checkpoint occurrence. Moreover, the transition from state 11 to state 2 expresses the occurrence of a state transfer from the primary to the newly restarted backup, to make feasible a potential replacement of the primary in case of fault. When a failed primary is detected (5 10), the corresponding backup replaces it and a replica restart is then scheduled to occur (RECOVERING). A recovering primary executes the logged requests and a recovering backup is either being restarted or waiting for a state transfer to become operational. Each replica restart restores it to the last saved object state. The message sequence shown in Figure 2 specifies the object interactions taking place in a case system, as a consequence of a method invocation to a service object (:SrvRequestAccepting).
→
srv_request
:SrvRequestAccepting
We consider two classes of requests (object methods) with different interaction patterns. Each object is replicated as specified by the policy shown in Figure 1. The compared fault tolerance schemes are distinguished according to the chosen checkpoint placement mechanism as follows: load-dependent checkpoint intervals (LDSC) for all objects in the first scheme and periodic checkpoint intervals (PSC) in the second one. The LDSC-based scheme assumes a specified number of serviced requests between checkpoints, as opposed to the PSC-based scheme, which results in a fixed time interval between them. We assume that each object replica is placed in a separate process node, with no additional hardware resource contention. Also, we consider the existence of two (2) distinct service objects (oj0 and oj5), placed in process nodes of the same speed. Incoming method invocations are distributed to the available service objects in a round-robin (RR) fashion. Table 1 details the described system’s parameters and Table 2 summarizes the applied parametric fault model. We did not consider load dependent fault rates.
obj1:classA
• •
obj2:classB
obj3:classC
[Class1Request]
[Class2Request]
[Class1Request]
Figure 2. Message sequence for the case system study
obj4:classD
Table 1. System model parameters service objects: load balancing method: class 1 request arrivals: class 2 request arrivals:
obj0:SrvRequestAccepting, obj5:SrvRequestAccepting round-robin (RR) 7.5 7.0 6.5 6.0 5.5 exponential (sec) 7.5 7.0 6.5 6.0 5.5 exponential (sec)
4.5 4.5
4.0 4.0
3.5 3.5
3.0 3.0
obj0:SrvRequestAccepting obj5:SrvRequestAccepting
obj1:classA
obj2:classB
obj3:classC
obj4:classD
1.2
0.9
1.1
0.8
0.6
object state size (KB): rep00 obj0 class 1 service (exponent.) 0.2 class 2 service (exponent.) 0.2 reinvoked requests (exp.) state transfer speed-sec/KB 0.6 (exponential) object replicas:
5.0 5.0
rep01 rep10 rep11 rep20 rep21 rep30 rep31 rep40 rep41 rep51 rep52 obj0 obj1 obj1 obj2 obj2 obj3 obj3 obj4 obj4 obj5 obj5 0.2 0.52 0.57 0.6 0.6 0.83 0.83 0.32 0.32 0.2 0.2 0.2 0.28 0.28 0.83 0.83 0.2 0.2 -
-
-
-
-
-
-
0.1
0.1
-
-
0.6
0.8
0.8
0.6
0.6
0.6
0.6
0.8
0.8
0.6
0.6
Table 2. Object fault model fault rarity parameter (r):
21600 sec rep00 rep01 rep10 rep11 rep20 rep21 rep30 rep31 rep40 rep41 rep51 rep52 object replicas: obj0 obj0 obj1 obj1 obj2 obj2 obj3 obj3 obj4 obj4 obj5 obj5 object faults (exponential) 2*r 2*r 2*r 2*r r r r r 2*r 2*r 2*r 2*r restart times (exponential) 23.0 23.0 23.0 23.0 23.0 23.0 23.0 23.0 23.0 23.0 23.0 23.0 fault monitoring interval 15.0 15.0 15.0 15.0 15.0 15.0 15.0 15.0 15.0 15.0 15.0 15.0 (sec)
5. Optimal fault tolerance schemes The tightest effective LDSC intervals (numbers of serviced invocations between checkpoints) for the heavily loaded system test case (exponential interarrival times with rate 3.0 sec) were found to be given by the vector (11, 22, 19, 24, 29, 11), with the first number representing the obj0 checkpoint interval, the second one the obj1 checkpoint interval etc. Regarding the PSC-based fault tolerance scheme, the corresponding tightest effective checkpoint intervals (time periods in seconds), for the same interarrival times, are given by the vector (17.0, 30.0, 20.0, 26.0, 35.0, 17.0). For the forenamed checkpoint intervals, Figure 3 summarizes the response times of the requests that were not affected by the occurred object faults, in respect to the tested system load cases (service objects utilization for the request arrival rates of Table 1). The obtained results are shown as a percentage of the corresponding response time, in the case of no fault tolerance. They quantify the fault tolerance cost of the
compared schemes, in their optimum effectiveness configuration, for the heavily loaded system test case. As expected, the PSC-based fault tolerance scheme was found to achieve its optimum effectiveness at the cost of scheduling a higher number of state transfers, compared to the tested LDSC-based scheme. This reduces the observed system availability and results in increased response times because of the higher state transfer costs. In heavily loaded system cases (e.g. service objects utilization 0.787) the performance of the PSC-based scheme may be not acceptable. The checkpoint intervals used to compare the studied fault tolerance schemes were also found to determine their optimum effectiveness, when the service objects state size is increased from 1.2 KB to 2.4 KB. Figure 3 reveals that the PSC-based scheme is more sensitive to this state size increment, due to the higher number of state transfers. Figures 4 and 5, confirm this trend for different service object state sizes and their corresponding tightest effective checkpoint intervals.
Object state transfer overhead (class 1 requests) (fault tolerance scheme of Fig. 1)
0,282
0
0,787
PSC: service object state size = 2.4 KB checkpoint intervals (17,30,20,26,35,17)
0,659
10
0,566
LDSC: service object state size = 2.4 KB checkpoint intervals (11,22,19,24,29,11)
0,495
20
0,44
PSC: service object state size = 1.2 KB checkpoint intervals (17,30,20,26,35,17)
0,397
30
0,361
LDSC: service object state size = 1.2 KB checkpoint intervals (11,22,19,24,29,11)
0,329
40
0,304
% overhead
50
service objects utilization
Object state transfer overhead (class 2 requests) (fault tolerance scheme of Fig. 1)
0,282
0
0,787
PSC: service object state size = 2.4 KB checkpoint intervals (17,30,20,26,35,17)
0,659
10
0,566
LDSC: service object state size = 2.4 KB checkpoint intervals (11,22,19,24,29,11)
0,495
20
0,44
PSC: service object state size = 1.2 KB checkpoint intervals (17,30,20,26,35,17)
0,397
30
0,361
LDSC: service object state size = 1.2 KB checkpoint intervals (11,22,19,24,29,11)
0,329
40
0,304
% overhead
50
service objects utilization
Figure 3. Fault tolerance overhead for the tested system load cases (class 1 and class 2 requests) State transfer overhead for the tightest effective checkpoint intervals (service objects utilization level: 78,7%)
% overhead
100 80
LDSC - class 1
60
PSC - class 1
40
LDSC - class 2 PSC - class 2
20 0 1.2
1.8
2.4
3.0
3.6
4.2
service object state size (KB)
Figure 4. State transfer overhead for the tested object state sizes
Service availability for the tightest effective checkpoint intervals
% availability
(service objects utilization level: 78,7%)
100 98 96 94 92 90 88
LDSC PSC
1.2
1.8 2.4 3.0 3.6 4.2 service object state size (KB)
Figure 5. Service availability for the tested object state sizes
6. Fault tolerance trade-off analysis Having selected the fault tolerance scheme to be applied, the adjustment of the object checkpoint properties has to be guided by a set of design goals and the performance of a suitable trade-off analysis. Such an analysis trades the gains derived from a checkpoint interval reduction, against the overhead imposed to the requests that were not affected by the occurred faults. We propose a layer-to-layer analysis, since in a system with synchronous nested invocations the service objects’ checkpoints were found to have a more significant impact on the mean of the fault-affected response times. For a potential checkpoint interval reduction, we consider the following three results: • plain gain, i.e. improved mean for the faultaffected requests, as well as, for the requests, which were not affected by object faults, • improved mean for the first category of requests, at the cost of a measurable worsening for the second one that includes the vast majority or a clear worsening of both means. • For a base scheme, the interval reduction to be performed is decided upon the potential gains, for all possible reductions and for two test cases per object. Plain gains are quantified by the sum of the differences
in the means. Worsening cases are not taken into account. In all other cases, quantification is performed on the basis of the criterion proposed in [9]: mean flc − mean fmc trade − off ratio = meanomc − meanolc with meanflc = mean of the fault-affected requests, for the base scheme meanfmc = mean of the fault-affected requests, for the scheme with the reduced checkpoint interval meanomc = mean of the requests not affected by faults, for the scheme with the reduced checkpoint interval meanolc = mean of the requests not affected by faults, for the base scheme On existence of plain gains, the reduction with the maximum gain is preferred. In all other cases, we choose the reduction with the maximum trade-off ratio and we ignore ratios less than 1 (negligible gains with unacceptably high costs). In each step, the reductions tested for an object are adjusted as follows: in a performed plain gain reduction or no reduction, for that object, we test the same values and in any other case, we use the value of the last performed reduction and its half value.
Table 3. Trade-off analysis for the studied LDSC-based scheme initial checkpoint intervals vector:
70-70-70-70-70-70
requests not affected by object faults
requests affected by object faults
70-70-70-70-70-70
7,167
61,883
obj 0 & 5
20
50-70-70-70-70-50
7,041
51,642
obj 0 & 5
20
30-70-70-70-70-30
7,060
37,029
obj 0 & 5
20
15,179
20-70-70-70-70-20
7,156
32,571
obj 0 & 5
10
7,297
8,690 15-70-70-70-70-15
15-70-70-70-70-15
7,332
31,042
obj 0 & 5
5
6,104
1010,432 13-70-70-70-70-13
13-70-70-70-70-13
7,332
30,459
obj 0 & 5
2
0,00011
checkpoint intervals vector
checkpoint interval interval reduction reduction (ir)
trade-off ratio for interval reduction ir
trade-off ratio for interval reduction [ir/2]
new intervals vector
gain 10,37
*
50-70-70-70-70-50
756,783
*
30-70-70-70-70-30 46,619 20-70-70-70-70-20
*
* worse result for the mean of the fault-affected requests as well as the mean of the fault-unaffected requests (a) interval reduction second layer trade-off analysis: (b) (c)
trade-off ratio or gain for interval reduction ir trade-off ratio or gain for interval reduction [ir/2]
obj1 checkpoint intervals vector 13-70-70-70-70-13 13-70-70-60-70-13 13-60-70-60-70-13 13-60-60-60-70-13 13-60-60-40-70-13 13-60-50-40-70-13
requests not requests affected by affected by object faults object faults 7,332 30,459 7,315 30,153 7,313 29,089 7,316 28,613 7,297 27,125 7,29 26,84
ir (a)
(b)
obj2 (c)
20 19,232 * 20 17,063 gain 1,06 20 * * 20 * * 20 gain 0,18 *
ir (a)
(b)
obj3 (c)
ir (a)
(b)
(c)
new intervals vector
20 * * 20 129,201 gain 0,32 13-70-70-60-70-13 20 129,32 1,888 20 104,374 41,260 13-60-70-60-70-13 20 5,544 174,311 20 6,943 * 13-60-60-60-70-13 10 * * 20 gain 1,51 * 13-60-60-40-70-13 10 gain 0,30 * 20 8,62 * 13-60-50-40-70-13
If no further improvement is possible, the same procedure is applied for the next layer. Back and forth movements from layer to layer allow for a step-by-step approach of a prescribed design goal, if possible. Let us assume that for the showcase system, in its highly loaded test case, our design goal is to achieve fault-affected requests with mean value less than 27 sec. Table 3 summarizes the results obtained, for the studied LDSC-based scheme. The reported means were produced together with 95% confidence intervals of relative half-width less than 3% of the estimated value. The results shown for the initial checkpoint intervals (70-70-70-70-70-70) reveal plain gains for a checkpoint intervals reduction of 20 requests, in the two service objects. The trade-off analysis is then continued with successive interval reductions, as a result of indicated improvements in the fault-affected requests response times. In each step, two potential reductions, ir and [ir/2] are considered, with ir the value of the last performed reduction. The second layer trade-off analysis starts with a checkpoint interval reduction of 10 requests in obj3 and ends with a checkpoint intervals vector (13-60-5040-70-13) and a mean of 26.84 sec - the design goal was 27 sec -, for the fault-affected requests. When compared to the corresponding performance measure, for the initial checkpoint intervals (61.883 sec), the achieved improvement is 56.7%. On the other hand, the mean response time for the requests, which were not affected by object faults, is increased from 7.167 sec to only 7.29 sec (1.7%), as a result of the applied checkpoint intervals reductions.
7. Conclusion In this work, we described a simulation-based design methodology, for comparing miscellaneous fault tolerance schemes based on their optimum effectiveness. More frequent checkpoints are considered to be effective, when they result in a reduction for the fault-affected requests response times. For a composite fault tolerance scheme, its optimum effectiveness is determined by the tightest effective checkpoint intervals, for the passively replicated objects. The developed simulation tool implements the functionality specified in the recently published OMG FT-CORBA standard ([15]). Finally, the proposed trade-off analysis was found to provide a useful means for determining appropriate checkpoint properties, in respect to the specified design goals.
In related work, we have found two published simulation-based approaches ([6], [16] and [17]). Both of them were devised before the advent of the OMG FT-CORBA standard and are best suited for generalpurpose and not specifically for object-based distributed systems. Also, the published analytic models may be used in the evaluation of single server process replication schemes and do not allow mixing miscellaneous policies. Future research issues include: • an applied metamodeling analysis ([8]) to assess the sensitivity of the obtained results in faults with load dependent varying rates and to analyze the performance impacts, when changing the fault monitoring interval, on an object per object basis, • efficiency improvements, such as the implementation of a RESTART ([20] and [7]) simulation approach and • integration of our simulator in an appropriate UML-based performance modeling framework ([12] and [1]).
Acknowledgment The authors would like to thank Z. Kalbarczyk and the anonymous referees for their helpful comments.
8. References [1] S. Balsamo and M. Marzolla, “Simulation modeling of UML software architectures”, Proceedings of the European Simulation Multiconference, Society for Computer Simulation, Nottingham, UK, 2003, pp. 562-567. [2] P. E. Chung, Y. Huang, S. Yajnik, D. Liang and J. Shih, “DOORS: Providing fault tolerance for CORBA applications”, International IFIP Conference on Distributed Systems Platforms and Open Distributed Processing (Middleware'98), poster session, 1998. [3] P. Felber, R. Guerraoui, A. Schiper, “Replication of CORBA Objects”, Distributed Systems, Lecture Notes in Computer Science 1752, Springer Verlag, 2000, pp. 254-276. [4] R. Guerraoui, P. Eugster, P. Felber, B. Garbinato and K. Mazouni, “Experiences with object group systems”, Software: Practice & Experience, 30, 12, 2000, pp. 13751404. [5] S. Garg, Y. Huang, C. M. R. Kintala, K. S. Trivedi and S. Yajnik, “Performance and reliability evaluation of passive replication schemes in application level fault tolerance”, Proceedings of the 29th Annual International Symposium on
Fault-Tolerant Computing, IEEE, Madison, Wisconsin, USA, 1999, pp. 322-329. [6] K. K. Goswami, R. K. Iyer and L. Young, “DEPEND: A simulation-based environment for system level dependability analysis”, IEEE Transactions on Computers, 46, 1, 1997, pp. 60-74. [7] P. E. Heegaard, “Speed-up techniques for simulation”, Telektronikk, 91, 2, 1995. [8] P. Katsaros, E. Angelis and C. Lazos, “Applied multiresponse metamodeling for queuing network simulation experiments: problems and perspectives”, Proceedings of the EUROSIM 2001 Congress, EUROSIM, Delfts, The Netherlands, 2001. [9] C. M. Krishna, K. G. Shin and Yann-Hang Lee, “Optimization criteria for checkpoint placement”, Communications of the ACM, 27, 10, 1984, pp. 1008-1012. [10] A. M. Law and J. C. Carson, “A sequential procedure for determining the length of a steady state simulation”, Operations Research, Vol. 27, 1979, pp. 1011-1025. [11] S. Maffeis, Run-Time Support for Object-Oriented Distributed Programming, PhD thesis, University of Zurich, 1995. [12] M. Marzolla, Simulation-based performance modeling of UML software architectures, Dottorato di Ricerca in Informatica, II Ciclo Nuova Serie, Dipartimento di Informatica, Università Ca' Foscari di Venezia, 2003. [13] P. Narasimhan, L. E. Moser and P. M. Melliar-Smith, “Strong replica consistency for fault-tolerant CORBA applications”, Journal of Computer Systems Science and Engineering, CRL Publishing, 2002. [14] V. F. Nicola, P. Shahabuddin and M. Nakayama, “Techniques for the fast simulation of models of highly dependable systems”, IEEE Transactions on Reliability, 50, 3, 2001, pp. 246-264. [15] Object Management Group, Fault tolerant CORBA, OMG Technical Committee Document, 2001-09-29, September 2001. [16] B. Ramamurthy, S. J. Upadhyaya and R. K. Iyer, “An object-oriented test-bed for the evaluation of check-pointing and recovery systems”, Proceedings of the 27th International Symposium on Fault-Tolerant Computing, IEEE, Seattle, WA, USA, 1997, pp. 194-203. [17] W. H. Sanders, W. D. Obal II, M. A. Qureshi and F. K. Widjanarko, “The UltraSAN Modeling Environment”, Performance Evaluation, 24, 1, 1995, pp. 89-115.
[18] R. D. Schlichting and F. B. Schneider, “Fail-Stop processors: An approach to designing fault-tolerant computing systems”, ACM Transactions on Computer Systems, 1, 3, 1983. [19] D. Szentiványi and S. Nadjm-Tehrani, “Building and evaluating a fault-tolerant CORBA infrastructure”, Proceedings of the Workshop on Dependable MiddlewareBased Systems (WDMS'02), International Conference on Dependable Systems and Networks (DSN 2002), Washington, DC, USA, June 23-26, 2002. [20] M. Villen-Altamirano and J. Villen-Altamirano, “RESTART: a straightforward method for fast simulation of rare events”, Proceedings of the 1994 Winter Simulation Conference, 1994, pp. 282-289.