Alessandro S .Santos, Leopoldo R. Yoshioka, Claudio L. Marte, Jorge P. Cintra, Caio Fontana
WSEAS TRANSACTIONS on SYSTEMS
Optimal placement of sensor network hosted in public transport vehicles for environmental monitoring ALESSANDRO S .SANTOS, LEOPOLDO R. YOSHIOKA CLAUDIO L. MARTE, JORGE P. CINTRA University of S˜ao Paulo - Polytechnic School Av. Prof. Luciano Gualberto, Trav. 3, n. 158, S˜ao Paulo BRAZIL
[email protected],
[email protected] [email protected],
[email protected]
CAIO FONTANA Federal University of S˜ao Paulo Department of Sea Sciences Av. Alm. Saldanha da Gama, 89 Santos - S˜ao Paulo BRAZIL
[email protected]
Abstract: Smarter cities provide sustainable economic growth and prosperity to their citizens. Their leaders should have the tools to analyze municipality data from its environment to support best decisions, anticipating problems to resolve them proactively and to coordinate resources to operate effectively. For this reason, smart cities become sensitive, when instrumented with technological framework to collect environmental information. Providing a comprehensive view of the city requires a large number of sensors, in addition to a constant increase in order to follow the growth of the city. However, if the sensors are hosted on public transportation vehicles, the route is verified to cover the main populated areas, with a dynamic principle of growth, which adapts to the development of the city. Taking advantage of these principles, this paper proposes the best placement for the components of sensor network for environmental monitoring, which is maintained by the information from the sensors embedded in buses that capture data along their journey. Different communication patterns are simulated using Realistic mobility models for bus corridors in S˜ao Paulo city to define the best positioning to better disseminate the information collected. Key–Words: GIS, ITS, WSN, environment, gas emissions
1
Introduction
should continue to be improved during the next few years of recovery period [3].
Urban mobility is in the agenda of big cities, including discussions regarding the impacts and benefits generated by transport. Motor vehicles are the most significant source of air pollution in urban areas, and improving the knowledge about the amount of pollutants from the vehicle fleet becomes a high priority research question for authorities who are responsible for managing vehicle emission impacts on air quality [1]. The BRIC countries have an important growing economic, demand for energy and industry development. Consequently, a sustainable ecosystem is a big challenge for city managers. For example, in Brazil, there is a restriction for vehicles in limited areas in S˜ao Paulo city, as well as a discussion about the various initiatives to minimize the effects of CO2 emissions. A program called ”EcoFrota”, which fosters the use of buses with emission characteristics below traditional levels, has been identified as a successful initiative, with more than 2500 deployed units, reaching 16% of the Fleet [2]. In China, the energy and environment are considered as high priority inside government plans for economic stimulus, and includes overall approach to environmental protection, which
E-ISSN: 2224-2678
In the context of cities, the question arising is how to measure the rates of environmental pollution. Since the indices are identified, it would be possible to evaluate the results of initiatives to minimize the harmful impacts of pollution generated by transportation. In addition to the emission reduction goals, an analysis of other factors (level of noise, light, efficient traffic flow, etc.) could be used to support the public managers decision to define strategies for improving the quality of life of citizens. For this reason, smart cities become sensitive, and the alternative is to create a technological framework for environmental monitoring, instrumenting the whole city with sensors. However, in order to provide broad geographic coverage, this requires a large number of sensors, demanding a constant increment in order to track the growth of the city. On the other hand, if we observe the behavior of the urban transport network, this has dynamic growth characteristics that accompany the more densely populated areas and the city development. Taking advantage of the characteristics of the urban transport network, this paper proposes that busses
177
Volume 13, 2014
Alessandro S .Santos, Leopoldo R. Yoshioka, Claudio L. Marte, Jorge P. Cintra, Caio Fontana
WSEAS TRANSACTIONS on SYSTEMS
host sensor network components for environmental monitoring, which capture data along their journeys. These buses travels over expressways to public transportation, part of transport models called Bus Rapid Transport (BRT). BRT presents itself as the most recommended choice for medium capacity transport systems, their trunks provide: increased operating speeds, higher capacity vehicles, segregated lanes, off-boarding billing, electronic payment, boarding at the level, traffic signal priority, among others [4]. The buses host these sensors and standard architecture from this ecosystem usually adopts Intelligent Transport Systems (ITS) for control and traffic monitoring. ITS refer to the state of the art technologies to provide better mobility experience. These systems involve vehicles, drivers, passengers, road operators and managers, besides covering the interactions between these components and the environment, linking them to core infrastructures [5]. In other words, Intelligent transport systems (ITS) connect information technologies with transport engineering [6]. Furthermore, ITS services are standardized [7] and categorized in eleven service domains, such as Operation and traffic management, public transport, and climate and environmental monitoring. Ecosystem and technological standards will be detailed in next sections aiming at better disseminating the information collected by sensors embedded in public transport vehicles. Thus, information from ITS enable the visualization of the environmental conditions of the city, in real-time or historic way, via Geographic Information Systems (GIS), Fig. 1. The network managment in mobile network has some advanteges when it uses a distributing model [8]. However, this paper proposes a centralized model, because this model is enough to evaluate the placement of components.
This paper aim at the best placement of the components of the sensor network. for this reason, it simulates different positions using different standards of wireless communication. We propose to establish models for communication using realistic mobility patterns of a bus corridor in So Paulo city (Brazil), in order to define the technological standards aiming at the better dissemination of the information collected by embedded sensors.
2
Many researchers have been studying sensor networks for vehicular settings, this environment being characterized as VANET (Vehicular Ad-hoc Network) which is a special kind of Mobile Ad-hoc Network (MANET) [9]. In these types of networks, one of the most important properties is mobility, which must be modeled in a simulation system. Thus, VANETs simulations should consider traffic models and mobility. In the community transport, traffic models are usually classified according to their level of detail [10]: • Macro Models: where vehicles are not considered individually but are incorporated into the models directly related to fluid dynamics. • Mesoscopic Models: usually describe individual entities in detail , but ignore interactions between vehicles. • Micro Models: represent the entities and interactions with a high level of detail. The behavior of a vehicle depends on the state of neighboring cars and even the characteristics of the driver. This section provides a discussion of related work, considering architectures and methodologies employed in micro simulation models for VANETs. A related work explores the possibility of placing ”mobile gateways” for selecting vehicles to provide connectivity to other vehicles in their neighborhood [11]. Their simulations used a scenario where nodes and mobile gateways were uniformly distributed on a long straight road. In addition, they assumed Markov models to characterize the motion of vehicles. Our work adopted mobility pattern, which considers realistic paths and movements of buses in a metropolitan city, particularly a bus corridor in the city of So Paulo (Expresso Tiradentes). Another scenario proposes the ”application of mobile devices” in ad hoc networks, for use in a taxi dispatch system in order to investigate the technical and financial viability [12]. The work assessment used a model city as a grid of size 5 km x 5 km, with 300
Figure 1: Simplified Architecture for monitoring E-ISSN: 2224-2678
Vehicular Ad-hoc Networks
178
Volume 13, 2014
Alessandro S .Santos, Leopoldo R. Yoshioka, Claudio L. Marte, Jorge P. Cintra, Caio Fontana
WSEAS TRANSACTIONS on SYSTEMS
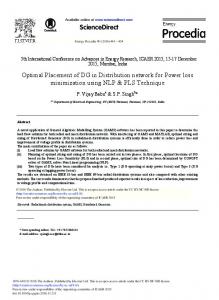
ify, add, delete and query the environmental information [16]. Nowadays, several pieces of information are necessary for a good urban planning, and there is growing importance in environmental variables, such as level of audible noise, air pollution coming from various sources (vehicles, industries, etc..), climatic conditions (heat islands, excessive rainfall, etc.), particularly those that may be or are affected by the way cities are urbanized. Some research lines use different approaches to extract environment information. According to Lobardo, which uses post processing of satellite images to map heat islands in large cities, to understand heat islands, the relationship established between the land use and urban morphology must be analyzed (Fig. 2).
taxis distributed within this area. They assessed the effect of parameters such as the density of nodes, congestion, and coverage, and concluded that the net effect is satisfactory under most operating conditions. The focus, however, was to study the performance of an application on a purely ad hoc network, unlike our work which verifies the feasibility of capturing information in a Delay-Tolerant Network (DTN), in which latency is not a primary factor. In another study [13], a case study was conducted to use buses as Data Mules to collect information from traffic sensors (detecting and counting vehicles) deployed on urban streets. Data can be collected by bus and then sent to a central traffic management through a few static or mobile gateways. Albeit a similar scenario with this work, it performs a statistical study and not through simulation; another difference is the fact that the bus is hosts of sensors.
2.1
Perspective for environmental monitoring
Technological advances have provided new possibilities in the analysis of urban perspectives. Wireless Sensor Networks (WSNs) belong to a particular case of ad-hoc networks, sharing their main characteristics, such as flexible routing and latency management strategies, among others. A WSN is composed by a set of interconnected sensor nodes. Sensor nodes are small devices, commonly consisting of a microcontroller, a short range radio unit and one or more transducers acting as sensors [14]. In other words, WSN is an event-based system with several sensor nodes. Reliable data transfer at the sink is based on collective information provided by sensor nodes [15]. Using this environment, the cities can rely on an arsenal of technological devices (especially sensors) that collect information from urban scenarios in an automated way, creating a knowledge base that enables correlation of historical information and real time measurable factors of an urban conglomerate. These correlations allow creating an intelligent layer to make the city more efficient. However, the urban conglomerates should be reconsidered to adapt and to take advantage of new opportunities, motivating a new public management vision. Urban planning is usually linked with Geographic Information System (GIS), and use static images from territorial coverage with several layers to represent different perspectives of cities. According to Gao Lingling et all., spatial decision support tool (GIS platform) assists the government with receiving effective information from the territorial ecosystem, which provides the greatest likelihood of beneficial outcomes. This system also enables officers to manage, modE-ISSN: 2224-2678
Figure 2: Heat islands in Recife (biggest city in northeast of Brazil). Source: [6] Glareh et all [17] use a different layer to represent the , simulation results regarding the effect of emission exposure from trucks in a delimited area of Toronto (Fig. 3). Both cases use post processing to create a static view of the environment; however, for some cases, it is very important to recognize the behavior according to the period of the day, month or year. Automation enables to better address the considerations of the time factor. For example, the temperature of city has a variable profile depending on the time of day or according months. In the same way, the noise has its peak times, and vegetation may have different behavior depending on the season. The management of all this information, with more granularities in space and in time, has become possible with the development of conceptual tools, such as SOLAP [18]. An alternative to creating a technological framework for collecting environmental information is in179
Volume 13, 2014
Alessandro S .Santos, Leopoldo R. Yoshioka, Claudio L. Marte, Jorge P. Cintra, Caio Fontana
WSEAS TRANSACTIONS on SYSTEMS
volume data to be transmited and collect simulation logs for assessment.
3.1
Wireless communication
Different scenarios was used for communication, because the radio coverage and kind of transmission are fundamental for choose the best place to put the components. For these paper, the following wireless networks models are adopted frequently: • Ad-hoc Networks (802.15.4): in this model, the transmission is propagated between nodes in communication towards a concentrator (sink). This model is traditionally used by wireless sensor networks. Figure 3: Simulation of pollution concentration. Source: [17]
• Wifi (802.11p): The family 802.11 is the most popular wireless network, which uses the central points (Hotspot), which communicate with the sensors within a radius of action.The IEEE 802.11p standard is based on IEEE 802.11a was approved by the American Society for Testing and Materials (ASTM) as the platform of the physical layer and MAC layer models for DRSC (Dedicated Short Range Communications). ”The 802.11p standards” are considered as WAVE (Wireless Access in Vehicular Environment) and were set to work in highly dynamic environments such as modern roads. The multi-channel architecture enables the delivery of safety and nonsafety applications.
strumenting the entire city with sensors to collect data. There is a variety of sensors, which can collect information, such as: CO; Noise; Microphone; Dust PM-10; Ultrasound (distance measurement); Temperature; Humidity; Luminosity; Pressure/Weight; Bend; Vibration; Impact; Hall Effect; Tilt; Liquid Presence; Liquid Level; Presence (PIR); Stretch. As seen in Fig. 4.
• GPRS cellular network: Network communication data present in GSM cellular networks, which uses narrowband and proprietary network of mobile operators, with associated cost. The technological standards aiming at better disseminating the information collected by sensors will depend on the communication kind used for transferring. Therefore, this paper simulates Ad-hoc and Wifi models, which can be configured using the legacy communication network with the amortized cost, due to the establishment of previous corporate network infrastructure. In this case, the communication network via GPRS is only used for calculating transmission volume monthly, to estimate the cost.
Figure 4: Sensors. Source: [19]
3
Simulation 3.2
The simulation are the base to evaluating the optimal placement from components of wireless sensor networks with ITS scenarios for environment monitoring. Tools for simulation configure types of wireless communication standards, scenario of urban mobility, E-ISSN: 2224-2678
Simulation tools
Stanica (2011) did a paper review of several tools for simulation that cover network simulators, vehicle mobility simulators and integration tools [9]. After the analysis of a series of tools options, we will use the 180
Volume 13, 2014
Alessandro S .Santos, Leopoldo R. Yoshioka, Claudio L. Marte, Jorge P. Cintra, Caio Fontana
WSEAS TRANSACTIONS on SYSTEMS
ns2 network simulator and traffic simulator of urban mobility, called SUMO [20]. SUMO is an open source simulator for micro traffic simulation models. Because of its high portability and license to use, SUMO has become the most used traffic simulator for vehicular networks [9]. A key component for VANET simulations is a realistic model of mobility to ensure that the conclusions of the simulation are closer to the actual implementations. In this sense, an approach to create a more realistic model is presented by the tool, MOVE (MObility model generator for VEhicular networks) [21]. Besides the capabilities of automatic generation of artifacts for simulation, it exposes a methodology that involves the development of urban street maps, defining the flow of movement and the creation of network traffic (Fig. 5). In our case, the sinks are placed in bus stations; the buses are simulated as mobile nodes, and bus corridor lines and bus schedule was used for mapping. This configurate was inserted in MOVE plataform to generate the files to network simulation (Fig. 6) .
Figure 6: Simulation methodology using the MOVE tool ical coverage of the city. In this sense, the network of urban bus corridors in the city of S˜ao Paulo was selected for the base simulations, such as conceptual approach of the project (Fig. 7). In more details, One specific corridors was choosen to be a test bed for experimentation, the Expresso Tiradentes. The corridor Expresso Tiradentes is a BRT system [4] and it has favorable characteristics for the simulation: • Constant average speed. • Regular distance between bus stops.
Figure 5: Simulation methodology
• Regular Stop time at bus stops.
3.3
• Geographical coverage of a certain region well above the traditional flow of vehicles.
Modelling the scenario
We analyze a realistic public transport (bus) scenario that hosts environmental sensors, with inherent mobility, and provides a path that enables a good geographE-ISSN: 2224-2678
• Constant number of buses in the corridor with regular programming. 181
Volume 13, 2014
Alessandro S .Santos, Leopoldo R. Yoshioka, Claudio L. Marte, Jorge P. Cintra, Caio Fontana
WSEAS TRANSACTIONS on SYSTEMS
in the simulation environment (Table 1).
Figure 7: Network of bus corridors in Sao Paulo city, highlighting the Expresso Tiradentes. Source: [22]
Figure 8: Aerial view from Expresso Tiradentes
The configuration of these items can be included in the tool that generates XML files, otherwise it is direct development of the XML file. For implementing the scenario Expresso Tiradentes, we illustrate an excerpt of the XML files creation of bus stops and urban roads: ...
...
Figure 9: Path and markers of bus stops on Google Earth
For a real scenario, we identified the path of the bus and the bus stops of the Expresso Tiradentes, via Google Earth (Fig. 8 and Fig. 9). The latitude and longitude positions were obtained by visual location in Google Earth, and were converted into UTM coordinates (x, y, z in meters) via online services from Brazilian Institute for Spacial Research(INPE) [23]. In addition, the coordinates of the Terminal Parque Dom Pedro (TPDP) were used as the zero reference E-ISSN: 2224-2678
3.4
Modelling the mobility
The flow of vehicles along this corridor is exclusive for buses, traveling in an elevated section. The bus lines circulating in Expresso Tiradentes has an average speed of 35 km / h without traffic lights at crossings. At peak times, departures occur every two minutes. Table 2 presents the parameters incorporated for 182
Volume 13, 2014
Alessandro S .Santos, Leopoldo R. Yoshioka, Claudio L. Marte, Jorge P. Cintra, Caio Fontana
WSEAS TRANSACTIONS on SYSTEMS
Table 1: Tiradentes
4
Reference coordenates for Expresso
Local
Original Coordenate (UTM meters) X Y
Coordenate for simulate environment X Y
Terminal I Bus stop I Bus stop II Bus stop III Bus stop IV Bus stop V Bus stop VI Terminal II
333714.0023 333937.2370 335207.9796 335543.7395 336399.7476 336957.4250 337028.2010 336503.1075
0 223.23467 1493.977309 1829.73717 2685.745288 3243.422666 3314.198673 2789.105175
7394954,65 7394577.858 7393659.141 7393106.086 7391952.799 7390106.101 7389353.475 7388773.848
Results
The ns2 simulator built the trace files for assessing performance indicators. The specific trace (Nam trace) is used by NAM tool to visualize the simulation (Fig. 10).This Figure 10 presents the visualization of running simulation with nodes, sinks and communications waves.
0 376.79193 1295.50893 1848.56457 3001.85141 4848.54895 5601.17572 6180.80197
simulations. Table 2: Parameters of mobility Parameters Quantity Number of bus stops Terminals Speed average Headway Distance Sink position Simulation time
Values 60 busses 6 2 35 kmh 2 minutes 8 km all bus stops and terminals 3600 s
For implementing the flow of buses, using the method of Figure 5 method, set the amount of vehicles, the route, and the runtime flow being specified in the XML file:
Figure 10: Visualization of Wifi simulation in NAM tool Other indicators were used, but the throughput (amount of data in bytes per second) was the main factor assessed. This was estimated from the data received by sinks from the nodes at a rate of 70bps. Each simulation used different positions of the sink, making it possible to evaluate the best position to host the sink. Figs 11 and 12 show the throughput values for Adhoc network and WiFi.The total volume of incoming data is presented in Table 3.
This study used the methodology and tool presented by MOVE mapping Expresso Tiradentes, considering the positions of bus stops, the average speed of the stretch, the flow of city vehicles during peak hours, etc. In this regard, we prepared Mapping, the mobility pattern to be integrated in network simulator. We illustrate an excerpt of the files with ns commands:
$ns_ $ns_ $ns_ $ns_ $ns_ $ns_ $ns_ $ns_
at at at at at at at at
0.0 0.0 1.0 1.0 2.0 2.0 3.0 3.0
"$node_(0) "$node_(1) "$node_(0) "$node_(1) "$node_(0) "$node_(1) "$node_(0) "$node_(1)
E-ISSN: 2224-2678
setdest setdest setdest setdest setdest setdest setdest setdest
5
19.95 22.73 0.13" 2799.16 6188.09 0.11" 19.95 22.88 0.15" 2799.16 6187.89 0.20" 19.95 23.08 0.20" 2799.16 6187.75 0.14" 19.97406 23.24790 0.18" 2799.16 6187.63 0.13"
183
Discussion
The analysis showed some common points; the Throughput revealed higher data transmission when the sink is in any of the terminals. Parameters such as transmission rates, latency time for connection, range, disposal of antennas are taken into consideration by the network simulator ns2; this is one of the factors causing low transmission at breakpoints. When buses are stopped at the terminals, they favor the formation of Adhoc networks, in which each node can forward the data to the sink node neighbor. In the case of Volume 13, 2014
Alessandro S .Santos, Leopoldo R. Yoshioka, Claudio L. Marte, Jorge P. Cintra, Caio Fontana
WSEAS TRANSACTIONS on SYSTEMS
Table 3: Volume of data received with Wifi networks (Kbytes) Local Terminal I Bus Stop I Bus Stop II Bus stop III Bus stop IV Bus stop V Terminal II
Amount(Kbytes) 4757.3 614.8 637.1 655.8 680.8 603.3 4706.0
amount of data generated by the model of Wifi Network (˜4MBytes) per terminal for 1 hour, which is a reference value for evaluating the cost of the major cell phone operators. Table 4 presents pros and cons of technologies.
Figure 11: Sink throughput in Ad hoc network
Table 4: Pros and cons for wireless communication and sink positions Adhoc hosted in terminals
Wifi hosted in terminals
2. Good Capacity and Volume Data.
Figure 12: Sink throughput in Wifi network
Wifi networks, the style of the antenna allows multiple buses to be within the same coverage area. In view of the sink at the bus stop, the radio wave of sink just cover few sensor nodes(usually one), and has only the stopping time to communicate (30 segs), and for the two types of networks, the throughput values are not significant. The simulation setup and deployment models in sections of stops could be improved; however, they would always be less efficient than if installed at terminals. Another difference is the greater ”transmission rate” of Wifi Networks as compared to Adhoc networks; yet, depending on the size of the terminal, more Wifi hotspots will have to integrate the infrastructure. This fact, in the Adhoc network is minimized, since the model allows reconfiguration of routes, transmitting data from the sensor nodes to the sinks, for alternate routes to other sensor nodes. With respect to the GPRS model, Table 3 shows the E-ISSN: 2224-2678
Pros 1. Infrastructure costs: Low 2. Adaptive routing allows routing information of sensor nodes to the sink via support from other sensor nodes. 1. Infrastructure costs: Median
Sink in Bus stops
1. Update time greater than or equal headway(2 minutes).
GPRS
1. Real-time response to the information collected by sensors
6
Cons 1. Lower capacity data transmission 2. Update time greater than or equal to the time to travel between the terminals. 1. Update time greater than or equal to the time to travel between the terminals. 2. Need for planning and ”site survey” to determine the distribution of HotSpots within the terminal. 1. Biggest infrastructure cost due to implementates of more sinks. 2. The amount data transfered will be less if compared with placment in terminals. 1. High Cost of transmission if the operators charge for data volume.
Conclusions
We show that it is possible to implement a mobile sensor network, hosted on public transportation vehicles to gather environmental information from a broad geographic region. Use models were proposed using simulation realistic mobility patterns of a bus corridor 184
Volume 13, 2014
Alessandro S .Santos, Leopoldo R. Yoshioka, Claudio L. Marte, Jorge P. Cintra, Caio Fontana
WSEAS TRANSACTIONS on SYSTEMS
[9] R. Stanica, E. Chaput, and A. Beylot. Simulation of vehicular ad-hoc networks: Challenges, review of tools. Computer Networks, 55:3179– 3188, June 2011.
in S˜ao Paulo city, in order to set a technological standard to better disseminate the information collected by embedded sensors. The simulation results showed that the sinks are best used if hosted at the terminals while the bus stops did not obtain good conditions for reading sensor data. The method proposed has the advantage of allowing the collection of environmental data from a geographical region spread over a few points through wireless networks (Wi-Fi or Ad-hoc), e.g. terminals. These will be further processed in a monitoring center, without requiring a technological infrastructure at bus stops or using GPRS networks.
[10] E. Lieberman and A. Rathi. Traffic simulation. In Revised Monograph on Traffic Flow Theory, pages 10.1–10.23. Transportation Research Board, 2012. [11] V. Namboodiri, M. Agarwal, and L. Gao. A study on the feasibility of mobile gateways for vehicular ad-hoc networks. In ACM international Workshop on Vehicular Ad-Hoc Networks (VANET), 2004.
References:
[12] E. et al Huang. Towards commercial mobile ad hoc network applications: A radio dispatch system. In ACM MOBIHOC, 2005.
[1] A. Shuhaili, A. Fadzil, S. Izan Ihsan, and W. Fekry Faris. Air pollution study of vehicles emission in high volume traffic: Selangor, malaysia as a case study. WSEAS Transaction on Systems, 13:65–75, 2013.
[13] L Dong. Opportunistic media access control and routing for delay-tolerant mobile ad hoc networks. Wireless Network, 18(8):949–965, November 2012.
[2] SPTRANS. Programa ecofrota: sustentabilidade na gest˜ao no transporte. SPTRANS, S˜ao Paulo, SP, 1 edition, 2012.
[14] M. Rosales, G. Garcia, and G. Sanchez. Efficient message authentication protocol for wsn. WSEAS Transactions on computers, 8(6):895– 904, June 2009.
[3] W. Zhanglan, T. Jie, and W. Dong. The study on the 3e system coordination evaluation: Evidence from china. WSEAS Transaction on Systems, 12:67, 2014.
[15] G. Lee, S. Na, and E. Huh. Modeling for congestion prediction in wireless sensor network using traffic demands analysis. Mathematical Methods for Information Science and Economics, 1(1):206–211, December 2012.
[4] Claudio Marte, Leopoldo Yoshioka, Jorge Medeiros, Cledson Sakurai, and Caio Fontana. Intelligent transportation system for bus rapid transit (its4brt). In Recent Researches in Telecommunications, informatics, Electronics and Signal Processing, volume 1, pages 242– 249. WSEAS Press, Baltimore, USA, 2013. [5] B. Williams. Intelligent Transport Systen Standards. Artech house, USA, 1 edition, 2008.
[16] Y. Zhao and L. Daoling. A gis-based support system for environmental impact assessment of rehabilitation of coal mine dump. 3rd IASME/WSEAS Int. Conf. on Energy, Environment, Ecosystems and Sustainable Development, 12:481–486, July 2007.
[6] M. Svitek, Z. Votruba, T. Zelinka, V. Jirovsky, and M. Novak. Transport Telematics - Systemic View. WSEAS press, USA, 1 edition, 2013. ISBN: 978-1-61804-144-9.
[17] G. Amirjamshidi, T. S. Mostafa, A. Misra, and M. J. Roorda. An emissions exposure modelling system for assessing impacts of low emission truck technology. In WCTR 2013, June 2013.
[7] ISO. Iso 14813-1:2007 -intelligent transport systems - reference model architecture. Technical report, International Standard Organization, 2010.
[18] C. H. Sim oes. Analytical geovisualization: development of a prototype of an analytical information system for the management of the selective collection of recycled urban solid waste. Master’s thesis, University of S˜ao Paulo, S˜ao Paulo - Brazil, 2010.
[8] Filippo Neri. Pirr: a methodology for distributed network managment in mobile networks. In WSEAS Transactions on information science applications, volume 5, pages 306–311. WSEAS Press, Wisconsin, USA, 2013. E-ISSN: 2224-2678
[19] Libelium Comunicaciones Distribuidas. Connecting sensors to the cloud @ONLINE. http://www.libelium.com/ 185
Volume 13, 2014
Alessandro S .Santos, Leopoldo R. Yoshioka, Claudio L. Marte, Jorge P. Cintra, Caio Fontana
WSEAS TRANSACTIONS on SYSTEMS
products/meshlium/wsn/, Acessed on 05 dez. 2013.
2013.
[20] Michael Behrisch, Laura Bieker, Jakob Erdmann, and Daniel Krajzewicz. Sumo - simulation of urban mobility: An overview. In SIMUL 2011, The Third International Conference on Advances in System Simulation, Barcelona, Spain, October 2011. IARIA. ISBN: 978-1-61208-169-4. [21] F.K. Karnadi, Zhi Hai Mo, and Kun chan Lan. Rapid generation of realistic mobility models for vanet. In Wireless Communications and Networking Conference, 2007.WCNC 2007. IEEE, pages 2506–2511, 2007. [22] SPTRANS. Olho vivo @ONLINE. http://olhovivo.sptrans.com. br/#pDeOlhoVia, 2012. Accessed on: 05 dez 2013. [23] INPE. Calculadora geografica @ONLINE. http://www.dpi.inpe.br/calcula/, 2013. Acesso em: 14 dez. 2013. [24] Alessandro Santos, Adriano Leal, Jose Oliveira, Jose Moreira, Edson Pistoni, Mario Miyake, and Claudio Marte. Methodologies for quality assessment of highway operators based in governance best practices with emphasis on toll collection ecosystem. In World Conference for Transportation Research - WCTR 2013, June 2013. [25] Alessandro Santos, Adriano Leal, Claudio Marte, and Mario Miyake. Assessment of maturity and efficacy of toll collection ecosystems. In IEEE Intelligent Transport System - IEEE ITS 2013, September 2013. [26] Alessandro Santos, Adriano Leal, and Henrique Puhlmann. Automated test platform to evaluation of conformance of intelligent transport system to brazilian regulation. In ITS WORLD 2013, Japan, October 2013. [27] Filippo Neri. Quantitative estimation of market sentiment: a discussion of two alternatives. WSEAS Transactions on Systems, 11(12):691– 702, December 2012.
E-ISSN: 2224-2678
186
Volume 13, 2014