Int. J. Wireless and Mobile Computing, Vol. x, No. x, 200x
101
Placement of network services in a sensor network Jennifer Yick* Computer Science Department, University of California, One Shields Avenue, Davis, CA 95616, USA Fax: (530) 752-4767 E-mail:
[email protected] *Corresponding author
Gregory Pasternack Department of Land, Air and Water Resources, University of California, One Shields Avenue Davis, CA 95616, USA Fax: (530) 752-5262 E-mail:
[email protected]
Biswanath Mukherjee and Dipak Ghosal Computer Science Department, University of California, One Shields Avenue, Davis, CA 95616, USA Fax: (530) 752-4767 E-mail:
[email protected] E-mail:
[email protected] Abstract: An important challenge in designing a wireless sensor network is to maximise the network’s lifetime. In a hierarchical cluster-based network, a key design issue is the placement of cluster heads (data loggers) such that the total power consumed by the overall network is minimised. Another key design goal is the localisation of sensors. In this study, we consider the placement of beacons and data loggers in the Cosumnes River Preserve. We consider a hybrid network in which the wireless sensors are deployed randomly into an irregular terrain while the data loggers and beacons are placed in a planned manner to satisfy the following three objectives: •
provide complete area coverage
•
load balance each cluster
•
minimise the total power consumption for collecting the data.
We formulated an optimisation problem to determine the location of data loggers and beacons – which is solved using an Integer Linear Program (ILP). Keywords: data loggers; beacons; cluster heads; localisation; clustering; energy conservation; wireless sensor networks. Reference to this paper should be made as follows: Yick, J., Pasternack, G., Mukherjee, B. and Ghosal, D. (200x) ‘Placement of network services in a sensor network’, Int. J. Wireless and Mobile Computing, Vol. x, No. x, pp.xxx–xxx. Biographical notes: Jennifer Yick received the BS Degree in Computer Science and Engineering from the University of California, Davis, in 2001, and the MS Degree in Computer Science from the University of California, Davis, in 2004. She is currently a PhD candidate in the Department of Computer Science at University of California, Davis. Her current research interests include energy conservation, localisation, clustering, target tracking and network survivability in wireless sensor networks. Gregory Pasternack received the BA Degree in Earth and Environmental Science/Science in society with high honours, and MS Degree in Environmental Water Resources Engineering from the Wesleyan University, Connecticut, in 1993. He received his PhD in Geography and Environmental Engineering from Johns Hopkins University, Baltimore, in 1998. He joined the Department of Land, Air and Water Resources at University of California, Davis, in 1998, where he is currently a Professor. His research interests are watershed geomorphology, watershed-estuary interactions, volcanic lakes, chaos in hydrologic systems and urban rivers.
Copyright © 2006 Inderscience Enterprises Ltd.
102
J. Yick, G. Pasternack, B. Mukherjee and D. Ghosal Biswanath Mukherjee received the BTech. (Hons) Degree from Indian Institute of Technology, Kharagpur (India) in 1980 and PhD Degree from the University of Washington, Seattle, in June 1987. At Washington, he held a GTE Teaching Fellowship and a General Electric Foundation Fellowship. In July 1987, he joined the University of California, Davis, where he has been Professor of Computer Science since July 1995 (and currently holds the Child Family Endowed Chair Professorship), and served as Chairman of the Department of Computer Science during September 1997 to June 2000. His research interests include lightwave networks, network security, and wireless networks. Dipak Ghosal received the BTech Degree in Electrical Engineering from Indian Institute of Technology, Kanpur (India), in 1983, and MS Degree in Computer Science and Automation from Indian Institute of Science, Bangalore, India, in 1985. He received his PhD Degree in Computer Science from the University of Louisiana, in 1988. He is currently a Professor in the Department of Computer Science at the University of California, Davis. His primary research interests are in the areas of high-speed and wireless networks with particular emphasis on the impact of new technologies on the network and higher layer protocols and applications.
1
Introduction
The goal of this paper is to design a hybrid wireless sensor network to monitor and study the floodplain dynamics in the Cosumnes River Preserve and the adjoining overflow areas shown in Figure 1. The sensors are deployed in the Preserve in an un-planned ad hoc manner to monitor various system attributes such as flow and pressure. As these are wireless sensors, an overlay network of data loggers needs to be designed to provide two important services, namely, localisation and clustering. Using the localisation service provided by the data logger, the sensor nodes can determine their location accurately. Towards this end, the data loggers act as beacons and a sensor node uses multi-lateration to determine its location coordinates. Data loggers also act as cluster heads where the data from the sensors are aggregated in a manner which minimises the energy dissipation of the overall network. Our objective is to minimise the number of data loggers and determine their placement. Since the objective functions for the localisation service and the clustering service are different, we formulate two optimisation problems, which are solved in sequence. First, we consider the clustering problem and determine the number data loggers and their placement such that the overall energy consumed by the network is minimised. Note that the total energy consumed includes the energy to gather the data at the cluster head and the energy required by the cluster head to relay the data to the base station. In the second optimisation, we consider the minimum number of beacons and their placement such that all potential locations in the terrain are covered by the fixed number of beacons required by the multi-lateration algorithm. The starting set of locations for the second optimisation is the output of the first optimisation. Furthermore, the optimisation problem also considers the elevation of the terrain and considers the height of the data loggers as an input parameter, which is varied to optimise the number of data loggers.
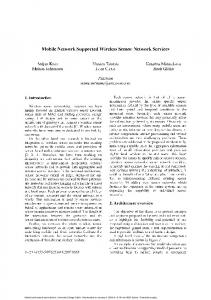
Figure 1
Aerial photo of the re-connected lower Cosumnes River floodplain. Arrows indicate general flow directions down channels as well as onto and off of floodplains through artificial breaches. Red markers are water-level and temperature sensor locations
The optimisation problems are solved using CPLEX. For a random placement of sensors, we performed a detailed sensitivity analysis with respect to the range of the sensors and the height of the data loggers. With respect to the clustering problem, simulation results show that as the cluster size increases fewer data loggers are required. Since the data loggers have a fixed range, having fewer data loggers reduce the total amount of energy required to transmit the data to the based station and increasing the
Placement of network services in a sensor network transmission range of the sensors reduces the number of data loggers. With respect to the energy required to aggregate the data at the data loggers, the total energy consumed increases with increase in the sensor transmission range. Based on these two components, we determined the transmission range and the number and the placement of the data loggers that minimises the total energy consumed by the network. With respect to the beaconing problem, simulation results also show that the number of data loggers required more than doubles over those required for clustering. In order to reduce the number of data loggers, we considered the height of the data loggers as an input parameter. Results showed that by increasing the height of the data loggers can significantly reduced the number of data loggers. As a result, we have found the minimum set and placement of data loggers required. We also compared the results of the optimisation problem, with a simple random placement of data loggers. The results show that random placement requires many more data loggers (almost double) than what is obtained from the optimisation formulation. The paper is organised as follows. In the next section, we give an overview of an example application scenario in the Cosumnes River Preserve area and define the problem. In Section 3, we provide an overview of related work on localisation and clustering in sensor networks. Section 4 defines the problem statement. In Section 5, we describe the problem formulation, assumptions and background information. Section 6 describes the experimental parameters and the first-order radio model. In Section 7, we discuss experimental results followed by the conclusions in Section 8.
2
Cosumnes River Preserve
Floodplains are among the most complex ecosystems on the surface of the earth. Their complexity arises partly from their landscape position at a boundary between terrestrial and aquatic systems. Unlike the coastal boundary, there is no overriding tidal or wind-driven force to provide a predictable spatio-temporal hydrogeomorphic gradient. Instead, the overriding physical force driving a floodplain is a poorly-predictable river-flooding regime. Another factor causing complexity on floodplains is the interdependence of physical and biological processes. Plant community structure derives from flooding patterns, but in turn redirects flow such that small deviations yield surprisingly significant landform changes. Also, the health of terrestrial and aquatic organisms using the floodplain is coupled through multi-directional nutrient fluxes associated with species’ life cycles and the community food web. As a result of this complexity, a universal model of coupled hydrogeomorphic floodplain evolution remains to be developed. A model that includes ecosystem mass/energetic flux and community dynamics is even more difficult to develop. Thus, field-based observation remains an essential tool for studying spatially-explicit and complex
103 linkages among geomorphic, hydrology and ecologic variables. While there are strong conceptual models of floodplain functioning over the 103–106 years time scales neglecting any primary role for vegetation (Bridge, 1984; Goodbred and Kuehl, 1998; Matthew and Elder, 1984; Cotton et al., 1999; Brown, 1997), the importance of and benefits provided by floodplains from ecological and management perspectives have gained increasing attention recently. The River Continuum Concept (Vannote et al., 1980; Junk et al., 1989) and the flood pulse concept (Junk et al., 1989; Tockner et al., 2000) are particularly notable interdisciplinary frameworks for viewing floodplain functioning over 10–1–102 years time scales. Such frameworks have become imbedded into new environmental management strategies aimed at restoring, rehabilitating, enhancing and otherwise manipulating channel-floodplain complexes for societal and ecological benefit (Ward et al., 2001; Jennie et al., 2001; Buijse et al., 2002). Water budgets for floodplains are complicated by the highly open nature of these systems. In some cases (e.g., Thompson and Polet, 2000), stream gagging of all boundary channels is possible and can be used to develop a large-scale water budget. However, major fluxes can also occur due to overland sheet wash, direct rain input, groundwater input and evapotranspiration (Stewart1 et al., 1999). Satellite-based remote sensing of floodplains is an emerging tool for hydrological monitoring, but of little use as of yet in 10–2–101 km2 systems, which dominate throughout the US (Alsdorf et al., 2000). Efforts to model such highly-dynamic systems are improving rapidly (Anderson and Bates, 1994; Bates et al., 1997), but will require significantly improved field data collection at high spatial resolution for calibration and validation. This can be achieved with a rationally designed and efficient sensor network taking advantage of the latest advances in sensor and network theory. The Cosumnes River (Cosumnes River Preserve, 2002) located within the Sacramento/San Joaquin basin, constitutes one of the finest natural laboratories for the study of watershed-scale physical and biological systems. Since the Cosumnes River basin is relatively small (approximately 1,265 square miles), it is appropriate and accessible for detailed study. With limited urbanisation, and no significant dams, its hydrologic system is largely intact, affording a unique opportunity for monitoring and evaluation of the impacts of land-use change on ecosystem and watershed function. As this river forms a natural, uninterrupted link between the Sierra Nevada and the Bay-Delta Estuary, it has been the centerpiece of an ambitious public/private restoration effort. For the past decade, The Nature Conservancy has been acquiring and managing Cosumnes lands, including extensive floodplain tracts containing native riparian oak woodland. Floodplain tracts that were once disconnected from the natural river flow regime by artificial levees have been experimentally restored by breaching levees.
104
J. Yick, G. Pasternack, B. Mukherjee and D. Ghosal
In cooperation with The Nature Conservancy, the Cosumnes Research Consortium of the University of California, Davis, has been researching the response of the system to the restoration effort. The overall goal of the monitoring program is to ascertain the hydrogeomorphic and ecologic response of the system to a floodplain restoration program using directed levee breaches to reinstate natural processes on former riparian agricultural lands for the purpose of re-creating functioning floodplains that also reduce financial losses from floods. The supporting objectives assess both methodological concerns regarding how to address geomorphic problems with multi-temporal scaling issues as well as fundamental processes of water, sediment, and contaminant transport on floodplains. Specific automated monitoring networks in the study area include •
a water-level sensor network
•
a water-temperature sensor network
•
a water-velocity sensor network
•
a water-quality monitoring and sampling network.
In addition, •
an annual sediment accumulation measurement network
•
an invertebrate sampling network
•
a fish sampling network are in use but cannot be automated.
Finally, aerial photography and photogrammetry have been used to create a high-resolution topographic map of the study area. The sensor network application described above and other deployed sensor networks systems such as Want et al. (1992), Juang et al. (2002), Mainwaring et al. (2002), Kumar et al. (2000), Srivastava et al. (2001), Chakraborty et al. (2000), http://www.mobilitytechnologies.com/ntdc/, have generally been successful at their tasks and have both advanced the state of the art and placed it on a practical footing. However, several aspects of these sensor networks could be improved in future generations. First, these devices are manually deployed and monitored. Sensor nodes are hard wired to a data logger that stores all the information. Data collection requires a person to go to these data loggers onsite throughout flooding season and gather the data from these devices. This not only incurs high deployment and management costs but also increases environmental disruptions. We propose to automate this process by deploying a hybrid wireless sensor network in the Cosumnes River Preserve consisting of ad-hoc placement of sensors and planned placement of data loggers. Data loggers will have the functionality of cluster heads that will collect all the data from the sensors in its range and send the information back to the base station. Inexpensive sensor nodes will be used to gather data. These inexpensive sensor nodes will not have GPS receivers to determine their positions (please see Section 3). Instead, data loggers will also function as
beacons using which the sensor nodes will compute their own position. It is a critical concern that sensor nodes have accurate location for the following reasons. Many metrics in hydrology are a function of distance. For example, water surface slope is a key metric in floodplain hydrology. This is the vertical difference in water level divided by the distance between the points. Similarly, a model that predicts water level and water velocity is a function of location. Other models such as habitat mapping, biological productivity mapping and sediment distribution mapping are also function of location. Hence, accurate location of the sensor nodes is very important. Our goal is to minimise the number of data loggers as this will reduce the cost as well as to reduce the amount of environmental disruptions. This optimisation will be performed while considering the topological information of the terrain since the surface is not flat.
3
Related work
There are many approaches that have been suggested to address the issue of localisation (Bulusu et al., 2000; Savvides et al., 2001; Younis and Fahmy, 2004). One of the easiest techniques is to install Global Positioning System (GPS) receivers in all the nodes (Bergamo and Mazzini, 2001). However, a sensor network consisting of a large density of sensor nodes equipped with GPS would lead to a very high cost. Aside from the high cost, GPS has certain problems: it does not work indoors, under water, under dense foliage, etc., and it has high power consumption at the node (Bergamo and Mazzini, 2001). Since we are considering a wireless sensor network in the floodplains, GPS is not an effective method for the nodes to determine their spatial coordinates. Another approach for localisation is to use another device such as a Personal Digital Assistant (PDA) with a GPS receiver to register the node’s location. However, this method is insufficient since there may be inaccessible locations that we cannot reach in the plains to register the nodes. Hence, we consider another approach in which beacons are used instead to determine each node’s spatial location in our network. Beacons, which already know their spatial coordinates, will signal their information to other sensor nodes for the latter to calculate their own position. One way of achieving sufficient beacon coverage of the network area is to deploy a dense collection of beacons. However, beyond a certain threshold, having an excess number of beacons covering each node does not necessarily improve the accuracy (Bulusu et al., 2001a) of the localisation. Also, if too many beacons are on at the same time, they may interfere with one another. Bulusu et al. (2001b) describe STROBE – an algorithm for adaptive operational density. In this technique, a dense initial deployment of beacons is made. Beacons have three states – beacon only, listen and beacon and sleep. The beacons cycle through these states based on the information received from their neighbouring beacons. For a given beacon, when the number of neighbouring beacons
Placement of network services in a sensor network that are awake crosses a given threshold, the beacon goes to sleep with a certain probability. Estrin et al. also describe an algorithm for adaptive beacon placement where, after an initial deployment of beacons has been given, locations where additional beacons could be placed are identified. Schurgers et al. (2002) adopt a similar approach in which some of the sensor nodes are in monitoring state while the others are asleep. When some event of interest occurs, the sleeping nodes are woken up by the monitoring nodes. Nodes which are sleeping will wake up periodically to listen for ‘wake-up’ signals from the other nodes. To ensure that the wake-up process does not interfere with the data transfer process, the sensor nodes are fitted with two radios each. For applications that require scalability, clustering is an effective way to organise a network comprising of hundreds or thousands of nodes. Even in a single hierarchy, it is suitable for these nodes to be divided into clusters to reduce energy consumption. Early literature (Ephremides et al., 1987; Gerla and Tsai, 1995; Ramamoorthy and Srivastava, 1987) on clustered networks illustrates the effectiveness of clustering with cluster heads. Applications that require data aggregations are good candidates for clustering. Clustering protocols have been investigated in wireless ad-hoc sensor network (Kwon and Gerla, 1999; Bandyopadhyay and Coyle, 2003; Amis et al., 2000) or as a routing protocol (Gerla et al., 2000; Heinzelman et al., 2002). Improvements of clustering protocols are proposed in Heinzelman et al. (2000), Wang and Chandrakasan (2001) and Lindsey and Raghavendra (2002), which demonstrate better energy utilisation. The study reported in Lindsey and Raghavendra (2002) discusses the importance of clustering and low-energy communication. In Low Energy Adaptive Clustering Hierarchy (LEACH) (Heinzelman et al., 2000), static sensor nodes are randomly scattered across a rectangular area. Clusters are formed where cluster heads are elected to transmit information back to the base station. In comparison to conventional communication protocols, LEACH is shown to be more energy efficient. Power-Efficient Gathering in Sensor Information Systems (PEGASIS) (Lindsey and Raghavendra, 2002) improves upon LEACH. Instead of clusters, it forms a chain of nodes where one leader node transmits information to the base station. Each node has to aggregate the data and pass it on to the next node till the data reaches the leader node. PEGASIS outperforms LEACH in prolonging the network lifetime since chaining does not require broadcast elections and re-clustering after various intervals in time. The work in Younis and Fahmy (2004) presented a protocol, called HEED (Hybrid Energy-Efficient Distributed clustering), that selects cluster heads according to a hybrid combination of the node’s residual energy and node proximity of its neighbours or node degree. Sensor nodes with high residual energy become cluster heads since the responsibility of cluster heads requires more energy. The second parameter, node proximity of its neighbours or node degree, is used to load balance each cluster. The HEED
105 protocol was able to achieve fairly uniform cluster head distribution and low overhead from processing cycles and message exchanging. The results in HEED demonstrate that its performance is better than other weight-based clustering protocols in prolonging the network lifetime. The work in Bandyopadhyay and Coyle (2003) presented a distributed, randomised clustering algorithm. The objective was to observe energy savings as the number of levels in cluster hierarchy increases. Similar to LEACH, each sensor node becomes a cluster head with a probability of p (called volunteer cluster head). A volunteer cluster head advertises to all sensor nodes that are no more than k hops away. Sensor nodes receiving these messages determine which cluster head to join and become a member node. Sensor nodes that are not cluster head or a member node to a cluster head at the end of the joining phase will automatically become forced cluster heads. Clustering in this protocol works in a bottom-up fashion where level-1 cluster heads are elected, then level-2 cluster heads, and so forth. The idea is that level-1 cluster heads elect themselves with a certain probability p1 and k1 hops; level-2 cluster heads with a certain probability p2 and k2 hops; etc. Simulation results show that such a multi-level hierarchical clustering method performs better than one-level clustering.
4
Problem statement
We model the floodplain terrain as a rectangular area which is divided into small grids. Each grid point has an elevation. Sensor nodes are deployed in an ad-hoc manner into random locations. Our goal is deployment of data loggers in the terrain with the following goals: •
provide complete coverage of the network
•
load balance each cluster
•
minimise the total energy consumed to gather sensor data and transmit them to a base station.
Given an area in which sensor nodes are to be deployed, we determine the optimal number of data loggers required for complete coverage. Our proposed algorithm for clustering balances the load on each cluster to approximately serve the same number of sensor nodes. The overall system will be balanced since each data logger will process, receive, and transmit approximately an equal amount of data. In addition, the algorithm also optimises the transmission distance from sensor to data loggers and vice versa. Minimising the distance between the sensor node and the data logger reduces the energy dissipation. Data loggers that act as beacons also require complete coverage. Complete coverage means that all the nodes in the network will be connected to at least three beacons to determine their location. In this case, we have placed a beacon at every grid cross point location. A grid cross point is the intersection of the horizontal and vertical grid lines. Determining the minimum number of beacons, which should be turned on, to cover the entire sensor network is an optimisation problem. The goal is to cover the entire
106
J. Yick, G. Pasternack, B. Mukherjee and D. Ghosal
network while minimising the total number of beacons used. At the same time, the localisation error also should be minimised. Localisation error is defined as the difference between the actual location and the calculated location. Obviously, when there are an insufficient number of beacons, the localisation error is more as the nodes have insufficient information to accurately calculate the position. We formulated this problem into two ILPs to compute the number of data loggers required. The optimisation is performed while considering the topological information of the terrain since the surface is not flat. Ray tracing is used to determine if any two nodes are in direct line of sight. We first optimise the number of data loggers that will act as cluster heads then as beacons. Cluster heads gather information from sensor nodes and transmit the information back to the base station. The first ILP formulation determines the number and placement of cluster heads required for clustering. Since cluster heads provide an important service throughout the lifetime of the network, the size of the cluster and node placements are very important. Conversely, beaconing may only be done occasionally, say once a day, to re-determine a node’s position. The second ILP formulation determines the number of beacons required for complete coverage of the sensor nodes. The selected cluster head in the first formulation will automatically be chosen to act as beacons. The correlation between the two ILPs allows us to achieve an equal number of cluster heads and beacons. Thus, we can deploy a minimal number of data loggers which contain both of these functionalities. Note that this is only a case study for deploying a small-scale wireless sensor network in a specific environment. For deploying a large-scale sensor network, heuristics will be required.
5
5.1 Minimising the number of data loggers The objective of clustering is to minimise the energy dissipation of the overall network for collecting the data and transferring them to a base station. Besides the length, width, elevation, granularity of the terrain, and the total number of sensor nodes, the following parameters are also inputs to the problem: •
transmission range of the data logger (which is denoted by r)
•
the maximum number of sensor nodes that a data logger is allowed to support (which is denoted by m).
Given: •
Nx,y = 1 implies that there is a node at (x, y). Nx,y = 0 implies that there is no node at (x, y). •
R( x1 , y1 )( x2 , y2 ) ∈ {0,1} ∀N x2 , y2 R( x1 , y1 )( x2 , y2 ) = 1 represents that node (x2, y2) is within the
transmission range of node (x1, y1). R( x1 , y1 )( x2 , y2 ) = 0 represents that node (x2, y2) is not
within the transmission range of node (x1, y1). Variables: •
Cx,y ∈ {0, 1} Cx,y = 1 represents a data logger at position (x, y). Cx,y = 0 represents no data logger at position (x, y).
•
X ( x1 , y1 )( x2 , y2 ) ∈ {0,1} X ( x1 , y1 )( x2 , y2 ) = 1 represents that node (x2, y2) is within
Problem formulation
The problem of determining the minimum number of data loggers and beacons and their specific locations in the irregular terrain can be formulated as an ILP with an objective function, a set of variables, and a set of constraints. We consider a rectangular area of a given length l and width w which is divided into small square grids of size g. Based on the topological information of the terrain, each grid cross point has an elevation denoted by e. We assume that the total number of sensor nodes is t, and the sensor nodes are uniformly and randomly distributed in the rectangular area. For the ILP, the locations of the sensor nodes are approximated to the nearest grid cross point. We assume that nodes have zero height. Similar to the sensor nodes, the location of the beacons and data loggers will be constrained to grid cross points. We will consider that data loggers and beacons to have a height, denoted by h. We will vary the parameter h to determine the minimum number of data loggers and beacons.
Nx,y ∈ {0, 1}
transmission range of a data logger Cx1 , y1 located at N x1 , y1 . X ( x1 , y1 )( x2 , y2 ) = 0 represents that node (x2, y2) is not
within transmission range of a data logger Cx1 , y1 located at N x1 , y1 . Optimise: Based on the above definitions the optimisation problem is to minimise the number of data loggers and is formulated as follows: Minimise:
∑
x, y
Cx , y .
Constraints: •
There must be a node at the grid cross point in order for it to be a data logger, i.e., Cx , y ≤ N x , y
∀( x, y ).
Placement of network services in a sensor network •
If there is a sensor at (x2, y2), then that node may be in the transmission range of a data logger at Cx1 , y1 , i.e., X ( x1 , y1 )( x2 , y2 ) ≤ R( x1 , y1 )( x2 , y2 )
•
the transmission range of data logger node (x1, y1), i.e.,
•
•
∀( x1 , y1 )( x2 , y2 ).
The sum of all the sensor nodes around node (x1, y1) has to be greater than 1. If there are no nodes next to node (x1, y1), node (x1, y1) becomes the data logger,
∑X
( x1 , y1 )( x2 , y2 )
≥ 1 ∀( x2 , y2 ).
A data logger can support up to m member nodes, i.e.,
∑X
( x1 , y1 )( x2 , y2 )
•
Bx,y = 0 implies that there is no beacon at (x, y). •
•
Given: •
Nx,y ∈ {0, 1} Nx,y = 1 implies that there is a node at (x, y). Nx,y = 0 implies that there is no node at (x, y).
λx,y ∈ {0, 1} λx,y = 1 implies that the beacon at (x, y) is on. λx,y = 0 implies that the beacon at (x, y) is off.
Optimise: The goal into minimise the total number of beacons which are turned on, i.e., Minimise:
∑
x, y
λx , y .
Constraints: •
Consider a node at location (xk, yk). All the beacons within a radius of R around (xk, yk) can reach the node at (xk, yk). So, given a location of a beacon (x1, y1), if ( x1 − xk ) 2 + ( y1 − yk ) 2 ≤ R, i.e., if the node is within
the transmission range of the beacon, then the beacon (x1, y1) can reach the node (xk, yk). Since we need each node to be reachable by at least n = 3 beacons, for a given node location (xk, yk), (x1, y1)k (i.e., all the beacons within the circle of radius R centred at the node at (xk, yk)),
∑
x1 , y1
λ x , y ≥ n. 1
1
i.e., a node at position (xk, yk) should be able to listen to at least n = 3 beacons.
5.2 Minimising the number of beacons As mentioned before, we do not consider the beaconplacement problem as a completely separate problem. Rather than determining a completely new set of points to become beacons, we consider the data loggers determined by the previous ILP as positions where beacons will be placed and turned on. Our objective is to determine if additional beacons should be turned on, to cover the entire area. The goal is to cover the entire network with the minimum number of beacons used. For localisation, each sensor node should be reachable by at least n beacons in order to compute their spatial coordinates. It has been shown that the minimum value of n is three (Savvides et al., 2001). As before, we assume that the total number of sensor nodes is t, and the sensor nodes are uniformly and randomly distributed across the sensing area. Beacon and node locations are approximated to grid cross points. The height of the beacon is denoted by h.
R is the transmission range of the beacon.
Variables:
≤ m ∀( x2 , y2 ).
In our prior work (Yick et al., 2004), we determined the minimum number of data loggers when nodes and data loggers have zero height, i.e., when we have a flat terrain. Building upon the existing ILP formulation, we introduced an additional parameter h which denotes the height of the data loggers. We require a Line Of Sight (LOS) for sensor nodes to communicate with data loggers. We use a ray-tracing algorithm to determine the LOS between two arbitrary points. For two sensors to be in LOS, the elevation of the terrain between the two points cannot be higher than the elevation computed from the LOS equation. Clearly, increasing h allows more nodes to be in direct LOS of the data loggers; however, increasing h may also lead to intrusive environmental impact.
Bx,y ∈ {0, 1} Bx,y = 1 implies that there is a beacon at (x, y).
∀( x1 , y1 )( x2 , y2 ).
A data logger may exist at node (x1, y1). For X ( x1 , y1 )( x2 , y2 ) to be 1, a member node (x2, y2) has to be in X ( x1 , y1 )( x2 , y2 ) ≤ Cx1 , y1
107
•
A beacon Bx,y can be turned off or on only if there is a beacon present at location (x, y). This is captured by the relationship:
λx , y ≤ Bx , y .
6
Experimental setup
The above optimisation problem was solved as reported in this section.
6.1 Radio model In our work, we assume the same simple radio model proposed in Heinzelman et al. (2000). The radio dissipates Eelec = 50 nJ/bit to run the transmitter or receiver circuitry and εamp = 100 pJ/bit/m2 for the transmit amplifier. For our simulation experiments, we assume that data transmission is performed in a Time-Division Multiple Access (TDMA) scheduling fashion. When a radio is not in use, it can be turned off to save energy and to avoid receiving unwanted transmissions. We also assume that energy loss is
108
J. Yick, G. Pasternack, B. Mukherjee and D. Ghosal
proportional to channel transmission distance squared. The radio expends the following amount of energy to transmit a k-bit message across a distance of d: ETx (k , d ) = ETx − elec (k ) + ETx − amp (k , d ) = Eelec × k + ε amp × k × d 2 .
To receive this message, the amount of energy required is: ERx (k ) = ERx − elec (k ) = Eelec × k .
the height of the grid point measured in meters with respect to the sea level. Note that besides being within range of the node’s transmission radius, a direct line of sight is necessary between the two neighbouring nodes that need to communicate directly. For example, node A can be within the transmission radius of node B; however, they can be on the opposite sides of a hill and will not be able to communicate. Figure 2
Topological data of the Cosumnes River Terrain
The above equations illustrate the cost of both transmitting and receiving data. The number of transmissions and receptions should be minimised. In order to obtain consistent results, we use the same constants to calculate the energy costs. We set k to be a 2000-bit message. We assume also that the radio channel is symmetric where the energy to transmit a message from node A to node B is the same as that for transmitting from node B to node A.
6.2 Experimental parameters The above two problems were coded into an ILP solvable by ILOG CPLEX (http://www.ilog.com/products/cplex/). The length and width of the Cosumnes area, the total number of nodes, the grid granularity, and the range of a data logger and beacons are needed for localisation and clustering. These parameters can be specified by the user. The results are based on a rectangular area with length l = 1600 meters and width w = 800 meters. The granularity of the grid is 100 meters. Note that the granularity of the grid does not affect the number of data loggers and beacons that are required since it is bounded by the constraint requirements stated above. The total number of sensor nodes in the given area is 153. The minimum number of beacons required for localisation is n = 3. The range of the data loggers vary from R = 200 to R = 1000 meters. We need to determine the total number of data loggers that are needed to cover the entire network and also the locations at which they need to be placed. There are no restrictions on the places where a data logger can be placed for the experimental results reported here – it can be placed at any grid cross point. A data logger that acts as a cluster head should contain at least one member node and at most m member nodes in its cluster. Similarly, a data logger that acts as a beacon is placed such that at least n = 3 beacons cover each and every grid point.
7
Results and discussion
For the first set of simulation experiments, we incorporated the measured topological information of the area to determine the number of data loggers required for clustering. A ray-tracing algorithm is used to determine if two nodes that are within transmission range of each other are also in direct line of sight in the 3-dimensional space. As shown in Figure 2, the x and y coordinate values are expressed in meters, and they represent the distance of a point from a chosen origin on the terrain. The elevation h is
In this set of experiments, we first determine the minimum set of data loggers required for clustering and their 3-dimensional placement. The results from these experiments indicate that the required number of data loggers does not change with the increase in the height of the data loggers but changes with the size of each cluster. From Table 1, we observe that, as the transmission range increases, the required number of data logger decreases for all cluster sizes. As an example, when each cluster head can support at most five sensors, i.e., m = 5 and the transmission range is above 300 meters, the number of data logger converges to 31. This is the minimum number of data loggers required to provide complete coverage based on the set of constraints that we have used in this problem and a total of 153 sensor nodes randomly placed in the area. It is interesting to note that the selected data loggers are located at the highest points in the terrain. For m = 10, the number of data loggers does not vary with the increase in the transmission range. This can be explained by the fact that the data loggers are supporting close to the optimal number of sensor nodes based on the parameter we have chosen. Thus, increasing the transmission range does not decrease the number of data loggers required. We do however see a decrease in the number of cluster heads when m = 20. Hence, we see how various values of m can affect the number of data loggers required. We extended this experiment to determine if increasing the height of the selected data loggers would further reduce the required number of data loggers. Experimental results show that there is no difference in the number of data loggers required whether the data logger is on the ground or 2 meters above
Placement of network services in a sensor network the ground since it is limited by the transmission range and the cluster size. In the following paragraph, we discuss how the value of m is chosen to reduced network wide energy consumption. Table 1
node that can no longer perform its required functionality because it has no energy left. Figure 3
Overall network energy dissipated with considering terrain topology as a function of the sensor node’s transmission range for different cluster sizes (m)
Figure 4
Overall network energy (and the constituent parts) dissipated as a function of the sensor node’s transmission range. Terrain topology is considered and m = 20, g = 100
Comparison of number of data loggers with different cluster size (m) with considering terrain topology and grid size g = 100
Transmission range (m) 200 225 250 275 300 400
109
m=5
m = 10
m = 15
m = 20
32 32 32 32 31 31
16 16 16 16 16 16
16 11 11 11 11 11
16 10 10 10 8 8
In order to extend the lifetime of the network, the cost of transmission needs to be minimised. Transmission contributes to a large portion of the energy dissipation. Figure 3 shows the energy spent in the network for a single round of transmission which consists of data being transmitted from the sensor nodes to the data loggers and from the data loggers to the base station. We use the simple radio model described in Section 7 to compute the energy dissipation. We assume that all sensor nodes transmit at the same power level. From this figure, we observe that, as the cluster size increases, there is a decrease in energy dissipation of the system. When we increase the cluster size, we require fewer data loggers, as shown in Table 1. Data loggers have the role of transmitting data back to the base station which, in this problem is located at the top right corner of the rectangular area. Having fewer number of data loggers in effect reduces the amount of energy required for long-range transmission. This results in reduced overall energy dissipation in the network. This is best illustrated in the figure with a comparison of the energy dissipation between m = 5 and m = 20. Figure 4 shows explicitly how the energy of the overall system is computed. Transmission power is constant for all sensor nodes. The amount of energy required for all the sensor nodes to transmit their data to the data loggers grows exponentially as the transmission range increases, as shown in the figure. The energy required for data loggers to transmit to the base station decreases as the sensing transmission range increases. For a larger sensing transmission range, we can form larger clusters; so, fewer numbers of data loggers are required. The overall energy dissipation decreases with the number of data loggers. A critical intersecting point is shown at the transmission range of 275 m where the two energy curves – from sensors to data loggers and from data loggers to the base station – intersect. At this intersection point, sensor nodes and data loggers have equal amount of transmission energy expenditures. Having equal expenditures eliminates certain nodes dying out early than other nodes in the network and extending the lifetime of the network. A dying node is a
In the first set of experiments, we studied how data is transferred to the base station. For the second set of experiments, we will determine the minimum number of beacons required to provide complete coverage and their 3-dimensional placement. Data loggers selected in the clustering experiment will now also act as beacons. We considered the measured topological information of the area and included the ray-tracing algorithm. In addition, we study if adding height to the beacons will further reduce required number of beacons. Experimental results in Figure 5 show the minimum number of beacons required for complete network coverage at various transmission range and height values. As shown, by adding height to the beacons from h = 0 m (ground level) to a height of 2.06 m can significantly reduce the number of beacons required. However, if we continue to increase the height beyond 2.06 m (e.g., to h = 3.0 m), the reduction in the required
110
J. Yick, G. Pasternack, B. Mukherjee and D. Ghosal
number of beacons is very small. Notice also that the required number of beacons remains fairly constant at a transmission range of 850 m or higher. Examining the curve for h = 2.06 m, we observe that, at a transmission range of 850 m, the required number of beacons is equal to the number of data loggers that can also act as beacons. Hence, at this transmission range and height, no additional beacons are necessary. Figure 6 shows the placement of these data loggers. Figure 5
Comparison of number of beacons (data logger) required as a function of the data logger’s transmission range with different height (h) values of beacons
with ray tracing, a random selection of 140 nodes is required to provide complete coverage. Conversely, fixed beacon placement required only 54 beacons. The amount of beacons required almost triples for random beacon placement. A similar trend is also observed with no ray tracing. The number of beacons required is still more than in that fixed selection. As we increase the transmission range, the number of beacons required for fixed beacon placement converges to 3, which is the required minimum number of beacons necessary for a sensor node to determine its position. With random beacon placement, the number of beacons required is still triple the amount for fixed beacon placement. Hence, more beacons are required when a random selection of beacon is used whereas beacons are minimised with fixed selection. Table 2
Comparison of number of beacons required for fixed and random placement with ray tracing (i.e., considering terrain topology) and no ray tracing (i.e., considering the terrain to be a flat two dimensional surface) (other parameters: h = 2.06 m, g = 100 m) Ray tracing
Transmission range (m)
Figure 6
The placement of data loggers with data logger’s transmission range = 850 m, sensor node’s transmission range = 275 m, m = 20, g = 100 m, and h = 2.06 m
In the above two sets of experiments, we determined the minimum number, 3-dimensional placement, and transmission range of data loggers. We also determined the transmission range of the sensor nodes. We will now compare the results of fixed and random beacon placement. For fixed beacon placement, we determine the optimal placement of these beacons based on the position of the sensor nodes. For random beacon placement, beacons are randomly placed in the coverage area. Table 2 illustrates the average of these results. We observe that random beacon selection requires more beacons to provide complete coverage. For example, at the transmission range of 200 m
No ray tracing
Fixed beacons
Random beacons
Fixed beacons
Random beacons
200
54
140
46
140
400
25
70
16
70
600
16
40
7
30
800
13
20
6
20
1000
10
20
3
10
In our final experiment, we analyse the overall system with random sensor node placement and density of 0.5 and 1 (in Figures 7 and 8, respectively). Density in our case is a measure of the number of sensor nodes per grid square. Our granularity is 100 meters which corresponds to 128 grid squares in our rectangular area. For density of 0.5 (Figure 7), we have random placement of 64 sensor nodes. Correspondingly, we have 128 sensor nodes for density of 1, and 640 sensor nodes for density of 5. These sensor nodes are uniformly distributed in the rectangular area and approximated to the nearest grid cross point. Similar to our previous analysis, when the cluster size increases, we observe a decrease of energy consumption in the overall system. From Figure 7, we observe that, when the transmission range is 300 m, there is close to a 1 Joule of energy drop in the overall system energy consumption for m > 5. This is the result of a decrease in the number of data loggers required. At a transmission range of 400 m, the overall system energy increases since sensor nodes are transmitting across a larger range. Figure 8 illustrates the results for a higher density of sensor nodes. From these results of density experiments, we are still able to achieve an optimal set of data loggers and their placements to minimise the overall network energy consumption.
Placement of network services in a sensor network Figure 7
Figure 8
8
Comparison of the overall network energy usage as function of the sensor node’s transmission range with sensor node density = 0.5 (64 sensor nodes) and various cluster sizes denoted by m
Comparison of the overall network energy usage as a function of the sensor node transmission range for different cluster sizes (sensor node density = 1 (128 sensor nodes))
Conclusion
Data loggers are equipped with the functionality of a cluster head and a beacon. In our work, we minimised the number of data logger and determined the placement of these nodes in a 3-dimensional space. In this study, we have better enhanced our ILP formulation to determine their optimal placement in a sensor network. Our results show a minimum number of data loggers needed when data loggers have both of the functionalities. In addition, we have found the transmission range of the sensors and data loggers which minimises the energy spent in the network. An important observation is that increasing the height of the data loggers can significantly reduce the number of data loggers. We have also found that random placement of beacons will incur more beacons compare to fixed placement. As future work, we intend to investigate how mobility will affect the number of data loggers that need to be deployed.
111
References Alsdorf, D.E., Melack, J.M., Dunne, T., Mertes, L.A.K., Hess, L.L. and Smith, L.C. (2000) ‘Interferometric radar measurements of water level changes on the Amazon floodplain’, Nature, pp.174–177. Amis, A., Prakash, R., Vuong, T. and Huynh, D. (2000) ‘Max-min D-Cluster formation in wireless ad hoc networks’, Proceedings of IEEE INFOCOM, March, Vol. 1, pp.32–41. Anderson, M.G. and Bates, P.D. (1994) ‘Evaluating data constraints on two-dimensional finite element models of floodplain flow’, Catena, pp.1–15. Bandyopadhyay, S. and Coyle, E. (2003) ‘An energy efficient hierarchical clustering algorithm for wireless sensor networks’, Proceedings of IEEE INFOCOM, Vol. 3, pp.1713–1723. Bates, P.D., Anderson, M.G., Hervouet, J.M. and Hawkes, J.C. (1997) ‘Investigating the behaviour of two-dimensional finite element models of compound channel flow’, Earth Surface Processes and Landforms, pp.3–17. Bergamo, P. and Mazzini, G. (2001) ‘Localization in sensor networks with fading and mobility’, Proceedings of IEEE PIMRC, Lisbon, Portugal, September. Bridge, J.S. (1984) ‘Large-scale facies sequences in alluvial overbank environments’, Journal of Sedimentary Petrology, Vol. 54, No. 2, pp.583–588. Brown, A.G. (1997) Alluvial Geoarchaeology: Floodplain Archaeology and Environmental Change, Cambridge University Press, Cambridge. Buijse, A.D., Coops, H., Staras, M., Jans, J.H., Van Geest, G.J., Grift, R.E., Ibelings, B.W., Oosterberg, W. and Roozen, F.C.J.M. (2002) ‘Restoration strategies for river floodplains along large lowland rivers in Europe’, Freshwater Biology, pp.889–907. Bulusu, N., Heidemann, J. and Estrin, D. (2000) ‘GPS-less low cost outdoor localization for very small devices’, IEEE Personal Communications, Special Issue on ‘Smart Spaces and Environments’, Vol. 7, pp.28–34, October. Bulusu, N., Heidemann, J. and Estrin, D. (2001a) ‘Adaptive beacon placement’, Proceedings of the Twenty First Internamtional Conference on Distributed Computing Systems (ICDCS-21), Phoenix, Arizona, April. Bulusu, N., Heidemann, J., Bychkovshiy, V. and Estrin, D. (2001b) ‘Density-adaptive beacon placement algorithms for localization in ad hoc wireless networks’, UCLA Computer Science Department Technical Report UCLA-CS-TR010013, July. Chakraborty, A., Priyantha, N. and Balakrishnan, H. (2000) ‘The cricket location-support system’, Proc. 6th ACM International Conference on Mobile Computing and Networking, pp.32–43. Cosumnes River Preserve (2002) http://www.cosumnes.org/. Cotton, J.A., Heritage, G.L., Large, A.R.G. and Passmore, D.G. (1999) ‘Biotic response to late Holocene floodplain evolution in the River Irthing catchment, Cumbria’, in Marriot, S.B. and Alexander, J. (Eds.): Floodplains: Interdisciplinary Approaches, Special Publications, Geological Society, London, pp.163–178. Ephremides, A., Wieselthier, J. and Baker, D. (1987) ‘A design concept for reliable mobile radio networks with frequency hopping signaling’, Proceedings of IEEE, Vol. 75, pp.56–73.
112
J. Yick, G. Pasternack, B. Mukherjee and D. Ghosal
Gerla, M. and Tsai, T. (1995) ‘An access-based clustering protocol for multihop wireless adhoc networks’, IEEE J. Selected Areas in Communication, Vol. 19, pp.1201–1210. Gerla, M., Kwon, T. and Pei, G. (2000) ‘On demand routing in large ad hoc wireless networks with passive clustering’, Proceedings of WCNC, Vol. 1, pp.100–105. Goodbred, S.L. and Kuehl, S.A. (1998) ‘Floodplain processes in the Bengal Basin and the storage of Ganges-Brahmaputra river sediment: an accretion study using 137Cs and 210Pb geochronology’, Sedimentary Geology, pp.239–258. Heinzelman, W., Chandraksan, A. and Balakrishnan, H. (2000) ‘Energy-efficient communication protocol for wireless microsensor networks’, Proceedings of Hawaii International Conference on System Sciences, Maui, Hawaii, January. Heinzelman, W., Chandraksan, A. and Balakrishnan, H. (2002) ‘An application-specific protocol architecture for wireless microsensor networks’, IEEE Transactions on Wireless Communications, Vol. 1, October, pp.660–670. Jennie, H.E., Simons, J., Bakker, C., Schropp, M., Jans, L., Kok, F. and Grift, R. (2001) ‘Man-made secondary channels along the river rhine (The Netherlands)’, Results of Post-Project Monitoring Regulated Rivers: Research and Management, pp.473–491. Juang, P., Oki, H., Wang, Y., Martonosi, M., Peh, L. and Rubenstein, D. (2002) ‘Energy-efficient computing for wildlife tracking: design tradeoffs and early experiences with zebra net’, Tenth International Conference on Architectural Support for Programming Languages and Operating Systems (ASPLOS-X), pp.96–107. Junk, W.J., Bayley, P.B. and Sparks, R.E. (1989) ‘The flood pulse concept in river-floodplain systems’, Canadian Special Publication of Fisheries and Aquatic Science, pp.110–127. Kumar, S., Alaettinoglu, C. and Estrin, D. (2000) ‘Scalable Object-tracking through Unattended Techniques (SCOUT)’, Proceedings of the Eighth IEEE International Conference on Network Protocols, pp.253–262. Kwon, T. and Gerla, M. (1999) ‘Clustering with power control’, Proceedings of MilCOM’99, Vol. 2, pp.1424–1428. Lindsey, S. and Raghavendra, C. (2002) ‘PEGASIS: power-efficient gathering in sensor information systems’, Proceedings of 2002 IEEE Aerospace Conference, March, pp.1125–1130. Mainwaring, A., Polastre, J., Szewczyk, R., Culler, D. and Anderson, J. (2002) ‘Wireless sensor networks for habitat monitoring’, ACM International Workshop on Wireless Sensor Networks and Applications (WSNA’02), Atlanta, GA. Matthew, H.C. and Elder, J.F. (1984) ‘Nutrient and detritus transport in the Apalachicola River, Florida’, US Geological Survey, Washington DC, Water-Supply Paper 2196-C. Ramamoorthy, A. and Srivastava, J. (1987) ‘Reliable clustering techniques for large mobile packet radio networks’, Proceeding IEEE INFOCOM, pp.218–226.
Savvides, A., Han, C. and Strivastava, M.B. (2001) ‘Dynamic fine-grained localization in ad-hoc networks of sensors’, Proceedings of MOBICOM, pp.166–179. Schurgers, C., Tsiatsis, V., Ganeriwal, S. and Srivastava, M.B. (2002) ‘Optimizing sensor networks in the energy latency-density design space’, IEEE Transactions on Mobile Computing, Vol. 1, pp.70–80. Srivastava, M., Muntz, R. and Potkonjak, M. (2001) ‘Smart kindergarten: sensor-based wireless networks for smart developmental problem-solving environments’, Proceedings of the Seventh Annual International Conference on Mobile Computing and Networking, pp.132–138. Stewart1, M.D., Bates, P.D., Anderson, M.G., Price, D.A. and Burt, T.P. (1999) ‘Modelling floods in hydrologically complex lowland river reaches’, Journal of Hydrology, pp.85–106. Thompson, J.R. and Polet, G. (2000) ‘Hydrology and land use in a Sahelian floodplain wetland’, Wetlands, Vol. 20, pp.639–659. Tockner, K., Malard, F. and Ward, J.V. (2000) ‘An extension of the flood-pulse concept’, Hydrological Processes, pp.2861–2885. Vannote, R.L., Minshall, G.W., Cummins, K.W., Sedell, J.R. and Cushin, C.E. (1980) ‘The river continuum concept’, Canadian Journal of Fisheries and Aquatic Science, pp.130–137. Wang, A. and Chandrakasan, A. (2001) ‘Energy efficient system partitioning for distributed wireless sensor networks’, Proceedings of IEEE International Conference on Acoustics Speech and Signal Processing, Vol. 2, pp.905–908. Want, R., Hopper, A., Falcao, V. and Gibbons, J. (1992) ‘The active badge location system’, ACM Transactions on Information Systems, Vol. 10, pp.91–102. Ward, J.V., Tockner, K., Uehlinger, U. and Malard, F. (2001) ‘Understanding natural patterns and processes in river corridors as the basis for effective river restoration’, Regulated Rivers: Research and Management, pp.311–323. Yick, J., Bharathidasan, A., Pasternack, G., Mukherjee, B. and Ghosal, D. (2004) ‘Optimizing placement of beacons and data loggers in a sensor network – a case study’, Proceedings of IEEE WCNC, Atlanta, GA, March, Vol. 4, pp.2486–2491. Younis, O. and Fahmy, S. (2004) ‘Distributed clustering in ad-hoc sensor networks: a hybrid energy-efficient approach’, Proceedings of IEEE INFOCOM, Vol. 1, pp.629–640.
Websites Traffic Pulse Technology, http://www.mobilitytechnologies.com/ ntdc/. ILOG CPLEX, http://www.ilog.com/products/cplex/.