64th Annual Assembly & International Conference of the International Institute of Welding 21-22 July 2011, Chennai, India
OPTIMISATION OF WELDING PARAMETERS FOR THE CONTINUOUS DRIVE ROTARY FRICTION WELDING PROCESS ON SIMPLE TUBULAR GEOMETRIES FOR STEEL V. Madhavan1,a, L. D’Alvise1,b, I. Lepot1,c, A. Vatovec2,d and M. Nunn3,e 1
2
a
Cenaero, Rue des Frères Wright 29, Gosselies BE6041, Belgium Messier-Bugatti-Dowty, Cheltenham Road East, Gloucester GL2 9QH, England 3 TWI Limited, Grant Park, Gt Abington, Cambridge CB21 6AL, England b
c
d
[email protected],
[email protected],
[email protected], andraz.vatovec@messiere dowty.com,
[email protected]
Abstract The effectiveness and applicability of using the finite element analysis approach to determine the optimum welding parameters for the Continuous Drive or Driven Friction Welding (DFW) process was investigated. The study was performed on an aerospace grade steel Ferrium S53. The optimum welding parameters were obtained by coupling a finite element process model to an optimisation code. The process model was a staggered thermomechanical scheme where the weld heat was generated from a temperature dependent Coulomb friction law. The model was validated against experimental data such as temperature evolutions (embedded thermocouples), material upsetting (axial shortening evolutions), hardness profiles and weld duration. This model was coupled to an optimisation code. This was done to perform a surrogate assisted multi-objective optimisation to determine the optimum welding parameters for a given configuration. The optimisation varied the input parameters such as the rotation speed, friction pressure, forge pressure and burn-off distance to determine a set of optimum welding parameters based on the level of upset, the size of the heat affected zone and the duration of the weld. Concurrently, an experimental study was performed by TWI Limited, UK on the same configuration to obtain the optimum welding parameters. The results of the optimisation predicted near-optimum welding parameter sets for the current case. Keywords: friction welding, finite element analysis, surrogate model, optimisation, driven
friction welding, visco-plastic, Coulomb friction
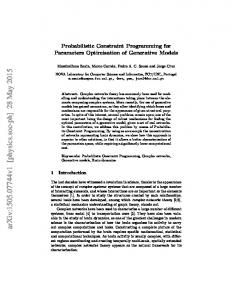
1. Introduction Friction welding is a solid-state bonding process used to weld heat resisting materials (mostly metallic) for structural components. In this process one component is held stationary while the other component is rotated. The two parts are pressed against each other under an axial force. Heat is generated at interface of the two components (welding interface) due to friction as the surfaces continue to rub against each other. Plastic deformation in the material is induced due to the elevated temperatures and the axial load and eventually the material starts to extrude radially outwards forming a collar known as the ‘flash’ [1]. This flash formation results in a global shortening of the component which is known as the ‘upset’. The process is illustrated in Figure 1.
Figure 1: Principle of DFW process [2] This study focuses on the optimisation of the process parameters of the Driven Friction Welding process by simulating the process via FEM techniques. In order to be able to predict the optimum parameters using optimisation techniques, it is first essential to build a model which accurately represents the behaviour of a weld. This model should be robust enough to be able to handle a range of welding parameters and produce reliable results. There
has been considerable research on the simulation of rotary type friction welding (both driven and inertia friction welding). Most of this research has been carried out on single cases and for a single material configuration (similar or dissimilar welds). Successful simulations were able to accurately predict the correct temperature profiles, axial shortening and flash formation as in the case of the research done by D’Alvise [3]. He used a 2.5D staggered thermo-mechanical scheme in the FEM code FORGE2 to simulate various cases of geometries and material combinations for the inertia friction welding process. He developed and characterised a friction law capable of accurately predicting the heat generation due to friction which was temperature and pressure dependent. More recently, Mousavi [4] made use of the FEM code Abaqus to perform 3D simulations of the driven friction welding process. The temperature distributions and flash formation were predicted with the model, as well as the plastic strain and in-process VonMises stresses. Yeom et Al. [5] developed a similar model for the driven friction welding of inconel and steel using the DEFORM 2D FEM code but included a metallurgy module to predict the hardness profile across the weld after cooling. However, there has not been any significant research carried out in coupling this type of analysis to an optimisation tool to be able to predict the optimum welding parameters. Benyounis [6] highlighted some research carried out on weld parameter optimisation but this included only non-solidstate welding techniques. Sathiya [7] built an artificial neural network which was trained by real experiments to predict the tensile strength in the weld and the material loss due to axial shortening and used the model to minimize these factors. This still required considerable input data from experiments but was able to obtain near optimum welding parameters based on these two criteria. Most optimisation studies for friction welding involve a trial and error approach with the developed finite element model. The aim of this study is to use a surrogate model assisted multi-objective optimisation which utilises a process model (FEM) to determine a set of operating parameters which would yield a good quality weld. This study was carried on similar material welds (Ferrium S53). The geometry used for the study was a simple tube as can be seen in Figure 2. The DEFORM 2D finite element code was used to simulate the weld behaviour in a 2.5D axi-symmetric approximation and the optimisation was performed using Minamo [8]. An additional study was carried out to predict
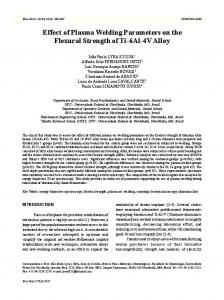
the hardness variation across the welded region and all models were validated against experimental data provided by TWI. TWI also carried out an experimental optimisation to determine the optimum welding parameters and this was compared to the results obtained from the numerical optimisation.
Figure 2: Tube geometry In order to maintain confidentiality of MessierBugatti-Dowty proprietary information, the welding velocity, forging load and material hardness have been scaled in this paper.
2. Weld manufacture and analysis The welds manufactured as practical validation for the modelling results were produced at TWI using a 328kW drive power, 1500kN axial forge force continuous drive rotary friction welding research machine. The machine was equipped to monitor and record welding forces, power, displacements and speeds at a rate of 20Hz. Parameters previously developed for welding Ferrium S53 were employed. Ferrium S53 is an ultra high strength corrosion resistant steel with physical properties similar to stainless steels and approaching those of heat resistant alloys. When selecting the welding process parameters, given in Table 3, higher forces and longer heating periods were chosen in comparison to those which would be required for more conventional engineering steels. Optimum welding conditions were selected based on tensile, bend and hardness testing and metallographic evaluation. Weld temperatures were monitored using stainless steel sheathed type-K (+ve nickelchromium/-ve nickel-aluminium) thermocouples which were inserted into drilled holes in the tube wall at a range of positions relative to the weld interface and tube bore. In total, there were 8 thermocouples at 8 radial positions with 4 positions relative to the weld interface and 2 positions relative to the central axis. Weld temperature data was logged at a rate of 10Hz. Thermocouples initially positioned close to the weld interface were consumed in hot forged weld metal but continued to function and report data (albeit with a triple material couple
64th Annual Assembly & International Conference of the International Institute of Welding 21-22 July 2011, Chennai, India
including the Ferrium S53). Micro hardness surveys were conducted on metallographic sections taken from the aswelded material using 500g Vickers hardness indenter at a spacing of 0.15mm. The hardness and temperature data were used to validate the model results as discussed later.
3. Process description
two parameters; the relative velocity of the friction surfaces and the compressive axial load applied during the process. Based on theory and practice, the key features of a high quality driven friction weld have been summarised and listed below [9].
For the purposes of this work the process can be categorised into three stages: 3.1. Stage I: Friction Stage In this stage, a constant angular velocity is maintained at the weld interface and a constant axial load is applied to press the two components together. During this stage we see axial displacement (burn-off) occurring at a slow rate as the material at the interface starts to heat up, soften and is expelled as flash. The upset during the friction stage is commonly known as ‘burn-off’. The friction stage ends after a predetermined burn-off distance is achieved [9]. During the friction stage, oxides and other foreign materials present on the original surface are broken up and dispersed. 3.2. Stage II: Intermediate Stage At the end of the friction stage, a braking force is applied to the rotating part and is brought to rest. Simultaneously the axial load is ramped up to a predefined ‘forge’ value. The reducing angular velocity and increasing axial loading result in a period of high torque. The rate of axial displacement is rapid during this stage resulting in a significant volume of flash expulsion. The duration of this transition from friction to forge stage has a large influence on the total upset of the welded assembly at the end of the cycle [9]. 3.3. Stage III: Forging Stage In this stage, the predefined axial forge load achieved at the end of the intermediate stage is maintained while the parts are held stationary (no rotation occurs). The period for which the forge force is maintained is termed the ‘hold time’. The primary purpose of this stage is the hot working and refinement of the heat affected zone. Additionally, the forging load ensures that a high percentage of the material initially located at the weld interface is expelled as flash. This is critical to the quality of the weld since the initial contact interface may contain impurities (oxides etc...) which may reduce the weld quality if not dispersed or expelled. 3.4. Weld Quality The quality of the welded joint and the efficiency of the process depend largely on the
Limited heat affected zone (HAZ) size Final assembly shape within tolerances Sufficient movement of material and upset to ensure self cleaning (high proportion of original weld interface expelled as flash) Acceptable cooling rate to avoid adverse metallurgical effects.
4. Numerical model The numerical model developed in DEFORM 2D consists of a coupling between the thermal and mechanical effects. The mechanical problem is solved using a mixed velocity-pressure formulation in a 2.5D axi-symmetric configuration where the material was modelled using a tabulated visco-plastic behaviour law in DEFORM [10]. Material torsion tests were performed to obtain the mechanical material behaviour from room temperature to the solidus temperature for a range of strain-rates. Based on a modified version of the research carried out by D’Alvise [11], a temperature dependent Coulomb friction law was used to model the friction behaviour during the heating stage. To predict the correct levels of upset, a feature of DEFORM called the ‘Limiting Strain Rate’ [12] approach was used. This prevents material flow below a certain level of strain-rate (0.02) and was required to compensate for the fact that the model utilised a visco-plastic and not an elastovisco-plastic material behaviour [13]. In this process, the material undergoes large temperature gradients which directly affect the mechanical solution. For this reason, there is a coupling of the thermal and mechanical solutions at each time step. The temperature computation from the thermal solution is used to evaluate the mechanical material properties. The computed friction effect from the mechanical solution is used to compute the heat generated due to friction in the thermal analysis. The clamping system was modelled as rigid bodies while the rotating and stationary components were meshed using an unstructured quad element mesh. Figure 3 shows the model setup for the simulation. It can be seen that for time step t=0 an initial mesh refinement was introduced where a ratio of 0.5 was used between the smallest and largest elements. A re-meshing algorithm with a strain
criterion was applied to the mesh to ensure high element quality with the changing geometry during the process.
Figure 3: 2.5D Mesh for DFW process model The three stages of the process were simulated using three different models with stage specific boundary conditions. The intermediate and forging stages start from a model restart of the previous stage (using the updated mesh, temperature, stress and velocity states). An additional stage was added at the end of the simulation chain to study the metallurgical transformations in the model. This stage was a pure thermal analysis which simulated the cooling down of the component to room temperature. 4.1. Friction stage model Rotating and forging boundary conditions were applied to the clamping system. A sticking contact was applied to prevent relative motion between the clamping system and the components. At the weld interface a sliding contact algorithm was applied with a pressure and temperature dependent Coulomb friction law. A convection coefficient of 0.02 N/sec/mm/C was applied to all the external edges of the model. The ambient temperature was fixed at 20 °C. The end of this stage was determined by a predetermined burn-off value. This is in accordance to the methodology followed by TWI in their experimental tests. 4.2. Intermediate stage model In this stage, the angular velocity applied to the rotating clamp is reduced to zero and the friction load is increased to the forging load. The duration of this stage is usually less than one second. The model setup is identical to the friction stage. 4.3.
Forging stage model
In this stage, the angular velocity is set to zero and the applied axial load is kept constant at the forging load. The model setup is identical to the friction stage. Towards the end of this stage, the axial velocity tends to zero as the material starts to cool down. This results in the strain-rate tending to zero. As this behaviour is not supported in a visco-plastic formulation, the forging stage needs to be halted once the axial velocity has almost reached zero. In the case of these simulations, the stopping criterion was chosen to be a minimum axial velocity of 0.001 mm/sec. This velocity was determined via a trial and error method based on the convergence limits of the simulation. 4.4. Cool-down model This stage is different from the previous ones as it is simulated using a purely thermal formulation as opposed to a staggered thermomechanical formulation. The purpose of this stage is to account for the metallurgical phase transformations while cooling down to room temperature and eventually to determine the final variations in hardness across the welded components. In addition, the width of the heat affected zone can be measured at the end of this stage. 4.5. Metallurgy Model As discus earlier, a metallurgy model was set up for the simulations. From information provided by Questek (developers of Ferrium S53) [14], it was determined that the initial phase state for the base material was Tempered Martensite. The transformation kinetics were derived from information available for Ferrium S53 on the Carpenter (distributor/manufacturer of Ferrium S53 alloy) website [15]. The transformations taken into consideration in the metallurgy model are discussed in the following sections. 4.5.1 Austenite to Martensite (cooling only)
Deform’s ‘Martensitic type’ (tabular input) model was used applying the martensitic start temperature as 100 °C and the 50% level temperature as 88 °C. The 50% temperature was evaluated from Koistinen Marburger (Equation (1) [9]) law and start/end transformation temperatures. (1) Where, is the initial fraction of austenite which we assume to be 1, is a multiplying coefficient, is the martensitic start temperature, and is the fraction of martensite at a temperature T. Since and (martensitic end temperature) are known values, by applying to be 99% (representing
64th Annual Assembly & International Conference of the International Institute of Welding 21-22 July 2011, Chennai, India
the martensite fraction at the martensitic end temperature) and T to be equal to , we can calculate the value of . Then by setting to 50% and applying the calculated value of , we can estimate the value of [10]. 4.5.2 Martensite/Tempered Martensite to Austenite (heating only)
Deform’s ‘Diffusion type (simplified)’ model is shown in Equation (2) [10]. (2) Coefficients A and D were taken to be 2 and 5 [16] while and (start and end temperatures) were 740 and 780 °C. Only the thermal effects of the metallurgy were taken into account since the hardness in the weld thermo-mechanically affected zone was to be determined. The mechanical aspects such as the residual stresses could not be evaluated due to the lack of an elasto-visco-plastic material law (limitation of DEFORM 2D v9.0).
5. Optimisation study The purpose of this study was to determine the optimum welding parameters for a given geometry and material. In an optimisation study there are three types of parameters which need to be identified. In the case of the DFW optimisation they are as follows:
Operating parameters: input parameters for the simulation/machine Constraints: introduced to constrain the optimisation by limiting the number of possible combinations of the operating parameters Objectives: results from the simulation which need to be either minimised or maximised.
Minamo [8] implements mono- and multiobjective Evolutionary Algorithms (EAs). These methods are stochastic, population-based search techniques and are widely used as efficient global optimizers in the engineering world. They are robust and able to cope with noisy, discontinuous, multi-modal, nondifferentiable, highly non-linear and uncomputable functions. However, one drawback of EAs is that they may suffer from slow convergence due to their probabilistic nature. As a consequence, for engineering applications involving expensive high-fidelity simulations, the CPU time required for a pure EA is usually not practical. In order to reduce the number of calls to these simulations, the optimisation process in Minamo is significantly accelerated by the use of cheap-to-evaluate surrogate models. This methodology has been adopted in
the current study. The first step consists in building a Design of Experiments (DoE) by choosing, via the Latin Hypercube Sampling technique, a set of points in the design space and running the numerical model at these points. Based on this DoE, surrogate models (in this case radial basis function networks) are trained in order to build an analytical relationship between the input parameters and the numerical model responses. Using these surrogates, an optimisation is then carried out to identify the optimum, at least in the sense of the surrogates. The accurate numerical model is used to evaluate the response values for this optimum in order to check the accuracy of the surrogates at the optimal solution. The new simulation results are added to the database which is therefore continuously improved with new design points, leading to increasingly accurate surrogate models all along the design. This design loop is repeated until the maximum number of iterations is reached. The final output of the optimisation process yields the input parameters with the most favourable objective outcomes. The ranges for operating parameters were determined based on literature and the machine specifications for different grades of steel [17]. The parameter ranges used in the optimisation can be seen in Table 1. Table 1: Welding parameter ranges [17] Parameters
Min
Max
Angular Velocity (RPM)
240
550
Friction Load (kN)
260
800
Forging Load (kN)
800
1550
Burn-Off (mm) 4.0 10.0 As a rule of thumb, when using the upset control methodology for the DFW process for welding tubes, the friction upset value should be almost equal to half the wall thickness of the tube. In the current case the wall thickness of the tube is 25 mm so the final value of the upset at the end of the friction stage should be approximately 12.5 mm. However, since this value differs from the upset obtained by TWI in their welds, the burn-off was introduced as a parameter ranging from 4 mm to 10.0 mm [17], [18]. The approximate value of the total upset required to ensure that all the material at the weld interface has been expelled in the form of flash can be determined. However, it is possible that this amount of flash is not achieved. It can be seen in a typical upset curve shown in Figure 4 that soon after the intermediate stage, when the material starts to cool down, the curve plateaus and does not
increase further. If the desired amount of upset is not obtained at this stage, there will not be any significant further axial displacement. For this reason, using the axial displacement as a stopping criterion for the forging stage would not provide a realistic generalised model of the process. Instead, a more appropriate stopping criterion would be a minimum axial velocity. As mentioned in a previous section, this also suits the visco-plastic velocity pressure formulation which will cease to converge as the strain-rate tends to zero.
Where, and
is the solidus temperature of the material is the peak temperature in the weld. (4)
Where, is the shortening (axial) at the end of the forging stage and is the required amount of shortening to ensure that all the initial interface material has been expelled in flash. (5) Where, is the total time taken for the friction, intermediate and forging stages.
6. Results
Figure 4: Example of an upset evolution curve Based on the physics of the DFW process, the temperature generated at the friction interface should be very close to the solidus temperature of the material. It is possible that with certain combinations of welding parameters this temperature could be significantly below the solidus temperature due to lower levels of heat generation. This adversely affects the quality of the weld and should be avoided. Since the heat generation is directly related to the friction at the interface (resistance to sliding), the temperature cannot exceed the solidus temperature as the behaviour of the material above this temperature is more like a fluid than a solid and the friction reduces. The parameters used in the optimisation have been summarised in Table 2. Table 2: Summary of optimisation parameters Parameters
Constraints
Objectives
Angular Axial Time Velocity Velocity Friction Temperature Upset Load Forging Temperature load Burn-off Computation of objective functions can be seen in equation (3), equation (4) and equation (5). (3)
6.1. Validation of DFW models In the development process of a numerical model to simulate a manufacturing process using finite elements, it is essential to perform a validation study. This is done to ensure that the model captures all the physical aspects of the process and to verify that the assumptions made during the generation do not have adverse effects on the final results. The results provided by TWI were in the form of time evolutions for upset, angular velocity, axial loading and temperature as well as microhardness profiles. The upset represents the actual behaviour of the material while the angular velocity and loading curves can be used to ensure that the end of each of the stages is predicted accurately. The temperature evolutions provide insight to the validity of the material models used while the hardness profiles validate the metallurgy models set up for the model. The optimum welding parameters from the study performed by TWI were used to validate the DFW model. The experiment welds were performed twice for the sake of repeatability. Table 3 lists the welding parameters (scaled) of the two welds used in the validation study. Table 3: Validation study parameters [18] Weld No.
Angular Velocity
Friction Load
Forge Load
Burnoff
W16F
0.529
0.629
1.079
5
W17F 0.529 0.629 1.079 5 It is to be noted that, since the Deform model adopts a geometry approximation of axisymmetry, there is no variation of temperatures in the radial direction. For this reason,
64th Annual Assembly & International Conference of the International Institute of Welding 21-22 July 2011, Chennai, India
effectively for the 2.5D model, there are only 4 thermocouple locations (as opposed to 8 as discussed in Section 2). Welds W16F and W17F performed by TWI were simulated (as both welds have the same welding parameters, the model was run only once). The input parameters for the model were the burn-off, friction load, forging load and the angular velocity. The load, angular velocity and upset evolutions were extracted from the model and compared to the experiment data. In addition to this, the temperature evolutions were compared for the two welds. Figure 5 and Figure 6 show the comparison of upset, angular velocity and loading for welds W16F and W17F respectively.
results of approximately 0.5 mm in Figure 5 and Figure 6. It may also be noticed that there is a lag in time between the experimental results and the simulated results (less than 0.5 sec). These may be due to material characterisation or simply smoothing of the input welding parameters. However, these discrepancies are small and may be considered to be approximation errors. The temperature time-histories for all valid thermocouple results can be seen in Figure 7, Figure 8 and Figure 9. It can be seen that there is a good correlation between the experimental measurements and the simulation results.
Figure 7: Temperature evolution results for thermocouples 1 and 3 (W17F)
Figure 5: Comparison of scaled results (W17F)
Figure 8: Temperature evolution results for thermocouples 5 and 6 (W17F)
Figure 6: Comparison of scaled results (W16F) There is a small discrepancy between experimental upset levels and the simulated
Figure 9: Temperature evolution results for thermocouples 7 and 8 (W17F)
In the section dedicated to the identification of a good weld it was mentioned that self cleaning is one of the pre-requisites of a good weld. The weld interface of the un-welded components may contain impurities such as oxides, oily residues, etc. which are not visible to the naked eye. These impurities could lead to a low quality weld (regions of weak or no bond etc.). To ensure that there are no foreign/undesirable inclusions at the weld interface, it is important that a high proportion of the material initially present at the interface is expelled as flash and that any remaining material is disrupted and dispersed within the weld volume. Using the results from the FE simulation, it is possible to track the flow of material and determine where it originated from. This is a useful tool which can be used to determine whether all the material at the weld interface has been extruded out in flash. As shown in
Figure 11: Hardness profile across the weld adjacent to the inner surface
Figure 10, the simulation of the optimum weld determined by TWI showed a good level of upset which resulted in most of the material at the interface being extruded out in the flash. However, there was still some material (~15% of interface) which was not expelled in the flash. This, however, is very difficult to predict or see in experimental tests.
(a) Before Weld
(b) After Weld
Figure 10: Material flow tracking of the flash Experimental micro-hardness tests were performed by TWI [18] for the optimum weld parameters as listed in the previous section. These tests were performed on metallographic sections adjacent to the inner and outer surfaces and mid wall thickness position on the weld test specimen. Each of these tests was carried out at 3 different radial positions resulting in 9 sets of hardness profiles spanning from the weld interface to the base material. Due to the axi-symmetry assumption of the model, the hardness profiles at each section were averaged resulting in the comparison of the hardness profiles adjacent to the inner and outer surfaces and at mid wall thickness of the weld test specimen. The hardness profiles (scaled) across the weld have been plotted in Figure 11 to Figure 13. We see quite a good correlation of results for the hardness profiles between the simulation and the experimental results.
Figure 12: Hardness profile across the weld at the mid wall thickness
Figure 13: Hardness profile across the weld adjacent to at the outer surface The more subtle changes in hardness seen in the experiment are not captured in the model. The most likely reason for this is the assumption that the martensitic transformation is solely based on the temperature. In reality, we would expect this transformation to be dependent on the kinetic effects, stress effects,
64th Annual Assembly & International Conference of the International Institute of Welding 21-22 July 2011, Chennai, India
strain effects and heating/cooling rate effects as well. However, to be able to capture these effects, a significant amount of information would be required about the metallurgical behaviour of the material. 6.2. Results from optimisation study The first part of this optimisation study was to build a surrogate model which accurately represented the DFW simulation. This was done by running a DoE of 150 experiments. Using an in-house cross-validation analysis tool (Leave One Out, LOO) the accuracy of the surrogate model was tested for each objective function. The correlation coefficient is a measure of how well the predicted values from the surrogate model fit with the real data, the higher the correlation coefficient the better. The correlation coefficients from the DoE analysis for the three objectives have been listed in Table 4. It is to be noted that this study was a first trial of using an optimisation strategy within this framework. In this case, as the numerical model is not numerically expensive, it was possible to generate a large number of points in the initial DoE to construct reliable surrogates as indicated by the correlation coefficients in Table 5. For future work, the number of sample points in the DoE may be reduced.
Table 5: Summary of optimum results (percentage deviation from experimental optimum) Angular Velocity
Friction Load
Forge Load
Upset
% diff
% diff
% diff
mm
27
17%
12%
0%
11.7
100
-1%
-10%
-41%
11.6
285
21%
-11%
-44%
11.8
228
18%
9%
-33%
11.8
Exp. No.
120 20% 12% -34% 12.3 The table indicates the experiment and its welding parameters as well as the final upset and the deviation of temperature from the solidus temperature. These results have been provided as a percentage deviation from the base optimum parameters obtained by TWI (for example, in experiment 27, the angular velocity has a 17% deviation from the optimum angular velocity determined by TWI in their experiment tests). All cases resulted in less than 2 mm of initial interface material remaining at the final welding interface (~8% of initial surface).
Time 99% Starting from the initial DoE, the optimisation process described in Section 5 was run for 200 design iterations and the results from the optimisation were studied using Pareto diagrams. Figure 14 shows a Pareto surface representation of the experiments run in the optimisation study. This highly multimodal Pareto surface highlights the necessity of using a multi-objective optimisation tool.
TWI determined the optimum weld parameters for this case which were indicated in Table 3. The simulations showed that these parameters would produce good welds based on the level of upset and the duration of the welds. However, the optimisation identified a wider range of parameters which would produce the same level of upset. Considering the cases Experiment 285 (increased angular velocity) or Experiment 27 (increased axial load), a higher machine inputs produces faster welds. The advantage of this is that the amount of heat generated would be less, directly resulting in a smaller heat affected zone. However, this obviously means a larger power input from the machine/higher machine loads. Eventually, picking the optimum weld parameters would require some sort of trade off between these two conditions. It is to be noted that TWI restricted their study to a single angular velocity in this work based on past experience of welding similar materials. In order to test the validity of the results obtained by TWI, an optimisation study would need to be performed where the rotation speed is kept constant while varying the loads and levels of burn-off. This, however, was not one of the objectives of this study.
Figure 14: Pareto surface representation of all experiments in the optimisation study The list of optimum parameter sets for the weld have been summarised in Table 5 (nonextensive).
Through the results presented, it can be inferred that the 2.5D DEFORM DFW process model was able to predict the behaviour of the
Table 4: Correlation coefficients from LOO Objective
Corrl. Coefficient
Temperature
85%
Upset
81%
7. Conclusion
weld with reasonable accuracy. This FEM model was used in a surrogate assisted multiobjective optimisation to determine the optimum weld parameters using the code Minamo [8]. The results from the optimisation showed that a larger burn-off was required in order to obtain a complete cleaning of the weld interface. The optimisation produced a list of close to best operating parameter sets from which an optimum solution could be chosen based on a trade-off between machine power input and weld strength. To summarise, the numerical optimisation has shown the ability of broadening the conception space for this process which is in-feasible in the case of experimental optimisations.
8. References [1]. American Welding Society. Welding Handbook. 9th Edition. Vol. 3. [2]. FPE Gatwick Joining Technologies. [Online] [Cited: 13 May 2011.] www.fpe.co.uk. [3]. Finite element modelling of the inertia friction welding process between dissimilar materials. L. D'Alivse, E. Massoni, S.J. Walloe. 2002, Journal of Material Processing Technology 125-126, pp. 387-391. [4]. Experimental and Numerical Studies of the Effects of Process Parameters in the Continuous Friction Welding Process. S.A.A. Akbari Mousavi, A. Rahbar Kelishami. 2008, Materials Science Forum Vols. 580-582, pp. 335-338. [5]. Characterization of Friction Welding for IN713LC and AISI 4140 Steel. J-T Yeom, J-H Lee, N.K. Park. 2004, Materials Science Forum Vols. 449-452, pp. 53-56. [6]. Optimisation of different welding processes using statistical and numerical approaches - A reference guide. Benyounis, K.Y. and Olabi, A.G. s.l. : Advances in Engineering Software, 2008, Vol. 39, pp. 483-496. 2008. [7]. Optimization of friction welding parameters using evolutionary computational techniques. Sathiya, P., et al. s.l. : Journal of materials processing technology, 2009, Vol. 209, pp. 2576-2584. [8]. Global Optimization with Expensive Functions - Sample Turbomachinery Design Application. Sainvitu, C., Iliopoulou, V. et Lepot, I. s.l. : Springer, 2010, Vol. Recent Advances in Optimization and its Applications in Engineering, pp. 499-509. [9]. Friction Welding. Wang, K.K. 1975, Welding Research Council Bulletin . 204.
[10]. Scientific Forming Technologies Corporation. DEFORM 2D Manual. 2007. [11]. D'Alvise, L. Simulation numérique par éléments finis du soudage par friction inertielle. Thèse de doctorat en Sciences et Génie des Matériaux. s.l. : Ecole des Mines de Paris, 11 10 2002. [12]. Scientific Forming Technologies Corporation. DEFORM 2D Keyword Documentation. 2007. [13]. Lemaitre, J. and Chaboche, J.-L. Mechanics of Solid Materials. s.l. : Cambridge University Press, 1988. [14]. Questek Innovations LLC. Questek. [Online] [Cited: 09 February 2011.] http://www.questek.com/ferrium-s53.html. [15]. Carpenter. Carpenter Ferrium S53 Alloy Technical Datasheet. [Online] Carpenter. [Cited: 29 July 2009.] www.cartech.ides.com. [16]. Vort, G.F. Vander. Atlas of TimeTemperature Diagrams for Irons and Steels. s.l. : ASM Interational, 2004. [17]. Humphreys, B A. A Practical Guide to Friction Welding. Halesowen : Thompson Friction Welding Ltd., 1998. [18]. Nunn, M. Rotary friction weld temperature evolution and micro-hardness measurements. s.l. : TWI, UK, 2009. Report No. 19322/1/09.