Advances in Computational Intelligence, Man-Machine Systems and Cybernetics
Optimization Model based on Genetic Algorithms for Oil Wells EDGAR CAMARGO*, JOSÉ AGUILAR**, ADDISON RÍOS**, FRANCKLIN RIVAS***, JOSEPH AGUILAR-MARTIN^ *Doctorado en Ciencias Aplicadas, Facultad de Ingeniería Universidad de los Andes Mérida 5101 VENEZUELA **CEMISID, Facultad de Ingeniería, Universidad de los Andes Mérida 5101 VENEZUELA ***Laboratorio de Sistemas Inteligentes Universidad de los Andes Mérida 5101 VENEZUELA ^ Grup SAC, Universitat Politècnica de Catalunya Campus de Terrassa ESPAÑA
[email protected],
[email protected],
[email protected],
[email protected],
[email protected]. Abstract: The Processes of optimization of oil wells involve an objective function that maximizes the commercial price and minimizes the production cost. For the solution of this type of problem, in the last decade the evolutionary technologies have demonstrated to be an effective and efficient tool. In this work is presented an Evolutionary System to improve the performance of the Industrial Production in petroleum wells that require gas lift (LAG). The system must optimize an objective composed by two criteria: to maximize the production of oil and to minimize the flow of gas injection, based on the restrictions of the process and the operational cost of production. Key-words: Problem of optimization, evolutionary computation, wells by artificial gas lift, model of production of well. The Evolutionary Algorithms (AE) are technologies of optimization and search inspired by the natural evolution. These algorithms define a population of individuals, each of them representing a possible solution to the proposed problem. Every individual of the population is defined genetically, this way, the best individuals are those that possess better genes. The best individuals are combined between them so that they form new solutions that possess better genes that their antecessors [5].
1. Introduction The search of new and better conditions of work, the protection of the environment, the safety of the resources, take every day more importance, and must be a premise in the desire for productivity increase in the companies. Particularly, the oil and gas companies carry out constant efforts to optimize their Systems of Production [5,6]. These efforts are directed to maximize the total daily production of hydrocarbons, minimizing the environmental costs, between others.
ISBN: 978-960-474-257-8
131
Advances in Computational Intelligence, Man-Machine Systems and Cybernetics
objective function of the problem in question. Every individual of the population represents a potential solution of the problem. Initially, the population is generated randomly, and then it evolves by means of operators', which include recombination of individuals, crossings and mutations. This evolution is guided by a strategy of selection of the individuals most adapted to the resolution of the problem, according to their values of "fitness". The Fig.1 presents a generic scheme of an AE. The intention of the Selection is to emphasize in the most capable individuals of the population, hoping that their children have a "fitness" better than that of the parents. The crossing combines several individuals to generate new individuals, and the Mutation is a random process where a gene is replaced by other for produce a new genetic structure. The Replacement is a process that substitutes individuals of the population (normally the worst) for the new individuals created (normally the best). As soon as a new population has been produced, the "fitness" of the individuals in the new population can be determined and restarts the process.
These new solutions generate a new population of individuals replacing the previous one [5]. The Evolutionary Algorithms (AE) are robust and effective methods for the resolution of problems of optimization. In [6] is presented an example of application in the Petroleum Industry, for the development of the concept " intelligent fields ", in which it is used for the analysis and interpretation of a great quantity of information, combined with neural networks. In [7], a concept of industrial automation for control and optimization of the production of hydrocarbon based on genetic algorithms is presented. So, in this work we propose a system for the optimization of wells using the Evolutionary Algorithms, specifically for wells that need gas lift (LAG). In this case we have determined two objectives to optimize: maximize the production of hydrocarbons and minimize the gas injection, which generates a zone of negotiation that allows finding the ideal production. The optimization system is composed of one phase (component) of well model generation (using techniques of Mass and Energy Balance) and one phase (component) of optimization of the productive process for the identified scenario. This paper is structured as follows: Theoretical aspects about Evolutionary Algorithms and the Production Process of well are presented in Section 2. The design of the Evolutionary Optimization System is presented in Section 3, while the results are shown in Section 4. The paper ends with conclusions.
Begin (P(0)) generation=0 Test (P(0)) While (no CriterionStop) do Father = Selection (P(generation)) Sons = Operadores de Reproduccion (Father) NewPop = Replacement (Suns, P(generation)) generation ++ Fig. 1. Scheme of an AE
2.2 Gas Lift Method
2. Theoretical Framework
The Gas Lift method consists of injecting gas at an established pressure at the lower part of the well pipe’s fluid column, at different depths, with the purpose of decreasing its weight, thus helping the reservoir fluids rise from the bottom of the well to the surface. That way, in the wells exploited by the Gas Lift method the gas is continuously injected into the well in order to mix with the fluids of
2.1 Evolutionary Algorithms The Evolutionary Algorithms (AE) simulate the process of natural evolution [4]. They consist of an iterative technology that applies operators over a set of individuals of the population with the intention of improving their "fitness", a measure related to the
ISBN: 978-960-474-257-8
132
Advances in Computational Intelligence, Man-Machine Systems and Cybernetics
the well and reduce the density of the fluid column, thus decreasing the difference in pressures between the bottom-hole and the surface.
pressure-production rate ratio is called “Inflowr” of reservoir energy and “Outflow” of energy of the surface installation. Finally, from the intersection of these curves the production well model is obtained starting from the nodal analysis [2].
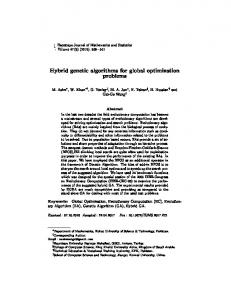
The production curve of a well that produces by the gas injection method (see Fig. 2) indicates that as the Gas Lift Flow increases (GLF, expressed “mpcdg” thousands of gas cubic feet days), the production rate (Qprod, expressed “BNPD” Daily Production Net Barrels) also increases until reaching its highest value (Stable Region), such that additional increases in the injection will cause a decrease in the production (Unstable Region) [1,2].
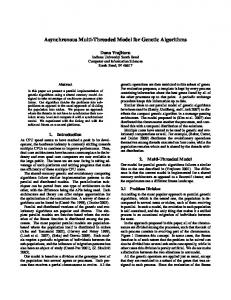
The field implantation of this GL method needs an instrumentation and control arrangement. For that, the measurement and control of the following variables are required (see Fig. 3): Gas Lift Flow ( GLF ), Production Rate ( Q prod ), Gas Lift Pressure ( GLP ), Gas Lift Differential Pressure ( GLDP ), Casing Pressure ( CHP or Pg ,inj ), and Production Tubing Pressure ( THP or Pthp ). Also, there are other variables that could be considered for embellishing the characterization of the process, such as bottom-hole pressure ( Pwf ) and temperature ( T f ), which let us identify the conditions of the hydrocarbon production zone.
Fig. 2. Artificial Gas Lift well behavior´s model
The well’s production curve is obtained by the characterization of the well and mass and energies balance techniques [1,3]. The mechanical completion installed at the bottom and surface of the well allows the characterization of the physical properties of the fluid (Gravity of the oil, water cut, Bottom-hole pressure, Gas-liquid ratio); all of this is necessary because the oil production behavior in the wells injected with gas depends of variables, both of the reservoir and of the mechanical design (valves, production pipes, among others) [1]. After that, techniques based on Mass and Energy Balances called Nodal Analysis will be applied [1,4]. For its calculation, a node (point of implementation of the energy balance) must be chosen at any place of the production system. After choosing the node, the pressures with which the reservoir will yield the production rate at the node’s entrance and exit will be determined. This
ISBN: 978-960-474-257-8
Line of Injections Gas
Line of Production
Fig.3. Schematic design of the well with Extraction Gas Lift Method
3. Design of The Evolutionary Optimization System 3.1. First Phase: Generation of the Well Production Model Obtaining the Production Model of a Well at field level, consists of comparing the pressures profile from the wellhead ( Pthp ) to the bottom-hole ( Pwf ) of the well, in order to determine the real capacity of production ( Q prod ) that the well exhibits through the gas
133
Advances in Computational Intelligence, Man-Machine Systems and Cybernetics
production pipe. This is described by the following restrictions:
injection rate ( Qiny ). In order to do that, the method called Nodal Analysis [1, 2] is used. Thus, a simple gas lift model is proposed: the oil and gas “Inflow” of the reservoir is modeled by the use of the productivity index (existing ratio between the production rate
c ρ (P − P ) si P 〉 P g g ,iny T ,iny g ,iny T ,iny Qiny = 0 de lo contrario
( Q prod ) and the differential between the reservoir pressure ( Pws ) and the flowing
Where:
pressure at the bottom of the well ( P wf ). For that, the equation (1) is used, which determines the capacity of contribution of the oil reservoir. This equation represents an instant snapshot of such capacity of contribution of the reservoir towards the well, in a given time of its productivity life. Such capacity decreases through time, for reduction of permeability of the well surroundings, and for the increase of viscosity of the oil. This equation is considered, from here on, as the energy offer or fluid affluence curve, that the reservoir yields to the well ( Pwf vs Q prod ). 1,25 * Q prod P = Pws * 1,266 − wf Qo
0,5
Pg ,iny = Pressure of Injection Gas to the Valve
PT ,iny = Pressure of the Production Pipe at the Point of Injection
ρ g = Gas Density c = Constant related to the characteristics of the valve Qiny = Gas Injection Rate For the model, the node at the gas injection valve is assumed in order to establish the capacity of production of the lifting system [2]. Thus, the production of the system responds to an energy balance in the form of pressure between the capacity of energy contribution from the reservoir and the energy demand from the installation [2,3], which is following expressed in the node:
− 0,125 (1)
Where Qo represents a base production rate, which is determined through reservoir core tests. For the “outflow”, gas is injected at a given depth to reduce the weight of the column and to reduce the bottom pressure of the well. That allows to establish a given production rate in which the capacity of fluid contribution from the reservoir equals the capacity of fluid extraction from the well. In this sense, in order to inject gas, it is assumed that the pressure at the level of the bottom injection valve located in the casing must be greater than the pressure in the space of the production pipe at the injection point (Pg ,iny 〉 PT ,iny ) , in order to ensure a displacement of the gas towards the
ISBN: 978-960-474-257-8
(2)
Node arrival pressure:
Pvalve (inf low ) = Pws − ∆ Py Node exiting pressure:
Pvalve ( outflow ) = Pthp − ∆ Pp Where:
∆Py = Pws − Pwf (Pressure
Drop
in
the
Reservoir).
∆Pp = Pthp − PT ,iny (Pressure Drop in the Well).
Qiny = C iv ρ g ,iny ( Pg ,iny − Pthp )
134
(3)
Advances in Computational Intelligence, Man-Machine Systems and Cybernetics
From (1), (2) and (3) the mathematical model that describes the behavior of a well by gas lift is obtained:
Qprod =
(
The restrictions are contextualized in the operational scenarios and the reservoir conditions. We assume that: Pws is a constant, due to the slow dynamics of the reservoir; and Pwf is lower than the pressure
)
)
2
Qo* Pthp + Pg,iny − ((Qiny / Civ )2 ) / ρg + 0,125 − 1,266 1,25
of the reservoir. From the well model we establish the maximum production capacity that a reservoir can contribute Q prod , max , and
(4)
the gas lift flow Qiny . It is a limited resource of variable availability, which depends on the gas plant assignment. Below we present the objective function with its respective restrictions:
3.2. Second Phase: Optimization of the Production Process The optimization problem of GL wells consists of Increasing the Production of Oil and Minimizing the Flow of injected Gas,
f = (PVPPetróleo −CostoPr oducciónCrudo)*Qprod −(CostoCompresiónGas)*Qiny
based on three variables: Q prod , Cost and
Subject to: Pws = Const,
Qiny . This optimization problem is described
Pwf 〈Pws ,
by the objective function of the equation (5), with the respective restrictions of the process. Fig. 4 illustrates our system, a well is connected to a reservoir and wellhead through a common pipe. The production pipe is modeled with the pressure gradients “Pressure Drop in the Reservoir” and “Pressure Drop in the Production Pipe”, through the well model presented in the first phase. The union of the pressure gradients is modeled as a “Node at the Injection Valve Level at the Bottom of the Well”, as it was previously explained.
Qprod ≤ Qprod,max Qiny,min ≤ Qiny ≤ Qiny,max Pwf ,min ≤ Pwf ≤ Pwf ,max
(5)
Where:
PVPPetroleum = Selling price of oil in terms of the daily barrel, Bs/bl, Cost Pr oduction = Production Cost, CostGasCompression = In Bs/Mpcn, The intervals regarding the restrictions in (equation 5) depend on the identified operational scenario, which are characterized in the following Table 1.
Well Head
These ranges will be used by the optimization technique, according to the operational scenario identified.
Node in Valvule
Reservoir
Fig. 4. Optimization Objective to Level of Valvule Injection.
ISBN: 978-960-474-257-8
135
Advances in Computational Intelligence, Man-Machine Systems and Cybernetics
Table 1. Values of the Variables for each Operational Scenario
Operational
Qprod,max Q inj , min Q inj , max P wf
, min
Pwf
, max
Scenario
Under-
235
291
681
410
1100
2umber of individuals: random: between 2 and 10. 2umber of generations: 25, Objective function: equation (5), including its respective restrictions. Crossover operator: single point cross with 0.7 probability. Mutation operator: random with 0.03 probability. Space for search: a population of individuals was gathered with the set of values allowed to variables Pthp and Pg ,inj , according to the operational scenario identified in the previous phase (the specific values for the variables
injected
Qiny ,min , Qiny ,max , Pwf ,min , Pwf ,max
2ormal
244
682
793
200
630
Over-
250
764
818
10
300
for the restrictions of the equation (5), depend on the operational scenario (see Table 1)). That means, the population of individuals will be specific to the operational scenario identified in the previous phase, so that the genetic algorithm may establish the optimum value of the equation (5) for that operational scenario. To evaluate the equation (5), the equations (3) and (4) are required. By optimizing (5), the optimum value of production and injection is established in the current operational scenario.
injected
3.3. Third Phase: Resolution of The Problem of Optimization using Genetic Algorithm The optimization problem of GL wells consists of Increasing the Oil Production and Minimizing the Gas Lift Flow, based on the objective function and the operational restrictions described in equation (5). In order to solve that problem, the genetic algorithm evolutional technique is used, which presents the following components:
4.- Results 4.1. First Phase: Generation of The Well’s Production Model The identification of the mathematical model of the well by GL constitutes an important step towards the operation of a supervision system. For the purposes of the construction of the GL well mathematical model, as it was previously indicated, the node in the gas injection valve is assumed, with the purpose of establishing the production capacity of the lifting system. The pressures at which the reservoir yields the production rate at the entrance and exiting of the node, the energy “Inflow” of the reservoir, and the energy “Outflow” of the surface installation are established. If a constant reservoir pressure Pws = 2400 psi and a base production rate
Structure of individuals: coded in real numbers composed of two fields, Casing pressure ( Pg ,inj ) and Tubing pressures ( Pthp ). These variables are used, because they are related to the gas behavior and surface level production, and they can be manipulated at an operational level with a field instrumentation arrangement. This is important, because such pressures can be adjusted in terms of the optimum values recommended by the genetic algorithm, and thus achieve the best performances of the producing well.
Qo = 150 bpd are assumed, the results of the “Inflow” of the reservoir are shown in Fig. 6.
ISBN: 978-960-474-257-8
136
F
Advances in Computational Intelligence, Man-Machine Systems and Cybernetics
made (both pressures are determined from both curves (see Fig. 8)). That is, it is where for a given Pwf the fluid contribution
Inflow
Bottom Pressure (Psi)
1200 1000
capacity of the reservoir “inflow” and “outflow” is known, in order to establish the gas injection ( Qinj ) required. With the value
800 600 400
of ( Qiny ) the production rate ( Q prod ) can be
200 0 180
calculated, using equation (4). 190
200
210
220
230
240
250
260
Rate of Production (BNPD)
Curves "Inflow" and "Outflow"
Rates of Production and Injection Gas
Fig. 6. Curve “Inflow” of Reservoir.
In order to establish the “Outflow” of energy from the installation, equation (3) is used, which says that gas ( Qiny ) must be injected with a fixed density, as it will not change the concentration of the gas (the way it is done in an experimental manner, where ρ g ,iny 0,8 lbs/foot3), to decrease the bottom pressure ( Pwf ), so as to extract the oil up to the wellhead
generating
a
production
1000 900 800 700 600 500 400 300 200 100 0 1093,7 871,46 760,5
649,9 539,49 429,54 320,3 212,22 105,88 3,5787
Bottom Pressure
Fig. 8. Curve “Inflow and Outflow” of well.
pipe
In this sense, the theoretical model follows the habitual dynamics of the GL wells: as gas is injected to the well pipe, the reservoir fluids rise from the bottom to the surface of the well, decreasing the difference in pressures between the bottom and the surface of the well until reaching the maximum capacity of production of the reservoir.
pressure Pthp . Civ corresponds to the valve adjustment constant. In Fig. 7 the results determined for the “Outflow” of the production system are shown, based on the production model. Curve "Outflow"
1200
Curve of Production
1000
300
Rate of Production (BNPD)
Bottom Pressure
800
600
400
200
0 500
550
600
650
700
750
800
850
900
950
1000
-200 Rate of Injection (mpcndg)
250
200
150
100
50
0 550
Fig. 7. Curve “Outflow” of Installation
600
650
700
750
800
850
900
950
1000
Gas Lift (mpcndg)
Fig. 9. Theoretical Productions Curve by Pressure of Reservoir to 2400 psi.
The curves (for a same value of Pwf ) show the volumes of production of oil and gas of the well, from which the energy balance is
ISBN: 978-960-474-257-8
137
Advances in Computational Intelligence, Man-Machine Systems and Cybernetics
than the one of 596,6 mpcndg (1,64892 b/d), but more gas flow is required. In this case, the profit differential is 165141 Bs/d, which indicates that this case could be interesting (more optimum) because it better combines the two costs.
Table 2. Results Obtained.
Qprod
Gana ( Bs / d )
Pthp
Pg ,inj
Qinj
(psi)
( psi)
(mpcndg) (b/ d)
170
1022
596,6
232
29794346
170,4
1109,8
619,1
230,2
29544303
172,5
1226,3
689,1
233,7
29959487
5.- Conclusion The Production Model obtained by using the Characterization of the GL Process using Nodal Analysis allows predicting the production rate the well can produce. Similar results are obtained with commercial applications], which are used for modeling and optimizing the behavior of a well. These models show the behavior from the “inflow” variables of the reservoir and surface pipe flow for any fluid. In our case, the Intelligent System allows obtaining similar results at reservoir and wellhead levels. The advantage of our well model is related to the fact that it is implanted at wellhead level and not at a distant computer (which would generate delays in the decision making processes).
4.2 Second and Third Phases: Optimization using Genetic Algorithm The Genetic Algorithm was applied for one of the operational scenarios identified in the previous phase (normal). The final population given by the Genetic Algorithm for that operational scenario is shown in Table 2 (an individual is the value of ( Pthp ) and ( Pg ,inj ) specified on a row of that table, which objective is the value of Pr ofits of that row). That is, the optimum values of that operational scenario of the variables Tubing Pressure ( Pthp ) and Casing Pressure ( Pg ,inj ),
The production of the GL method was optimized in terms of the integrated subsoil and surface information, which will allow minimizing costs and guaranteeing the best distribution of the injecting gas maximizing the production of oil. The subsoil-surface integrated approach is innovative in the sense that it integrates the reservoir/wellhead infrastructure behavior. This is done through an objective function, with the respective restrictions of the process, which allows contextualizing such objective function in the operational scenario and the reservoir conditions identified in the supervision scheme. The genetic algorithm establishes the optimum production and the gas injection value for the identified operational scenario from the relationship of the two costs of the productive process: reduce the production costs and optimize the gas injection.
shown in Table 2, are used in the models of gas injection well and in the objective function, giving the results of Qinj , Q prod and Pr ofits shown in the same Table 2. According to the results of the Table 2, the production system presents an optimum behavior at a gas injection rate of about 596,6 mpcndg, with an associated production of 232,06 b/d, a casing pressure of 1022 psi and production pipe of 170 psi. On the other hand, for a gas flow of 619,1 mpcndg its production rate is 230,21 b/d, generating a smaller profit and greater consumption of gas with respect to the case of 596,6 mpcndg. Regarding the gas flow of 689,1 mpcndg, a production of 233,71 b/d is expected, higher
ISBN: 978-960-474-257-8
138
Advances in Computational Intelligence, Man-Machine Systems and Cybernetics
Acknowledgment:
Evolutionary Computation, Volume 16, 225255, 2008.
This work has been supporterd in part by FONACIT under grant 2005000170, CDCHT-ULA under grant I-820-05-02-AA, and PCP Automation Integrated to Processes of Production No. 200500380.
[7] Shahab, D,M., ”Recent Development in Application of Artificial Intelligence in Petroleum Engineering”. paper SPE 89033. Society of Petroleum Engineers. 2005. [8] Popa A., Ramos R., Cover A., “Integration of Artficial Intelligence and Lean Sigma for Large-Field Production Optimization: Application to Kern River Field”, Paper SPE 97247, pp 34-45, 2005.
References: [1] Edgar Camargo, José Aguilar, Addison Ríos, Francklin Rivas, Joseph AguilarMartín, “Un modelo de Producción de Pozos por Levantamiento Artificial utilizando Análisis Nodal”. Aceptado para su publicación en la Revista Ciencia e Ingeniería. Universidad de los Andes. Vol.30, Pp. 23-28.Nº 1. 2009. [2] Edgar Camargo, José Aguilar, Addison Ríos, Francklin Rivas, Joseph AguilarMartín, “Nodal Analysis- based Design for Improving Gas Lift Wells Production”. WSEAS Transactions on Informations Science & Applications. Vol.5, No. 5, Pp. 706-715. 2008. [3] Edgar Camargo, José Aguilar, Addison Ríos, Francklin Rivas, Joseph AguilarMartín, “A Neo-Fuzzy Approach for Bottom Parameters Estimation in Oil Wells”, WSEAS Transactions on Systems and Control, Vol.4, No. 9, pp. 445-454, 2009. [4] Robles O, Román, R., “Un Modelo de Programación No Lineal para la Planeación de la Producción de Gas y Petróleo”. Paper SPE 112186 preseted at the 2008 Intelligent Energy Conference, Amsterdan, Netherlands. [5] Yang, D., Licheng J., Maoguo G. “Adaptative Multi-Objective Optimization Based on Nondominated Solutions” Computational Intelligence, Volume 25, Number 2, 2009. [6] Gong, M., L.C.Jiao., H.F.Du. “Multiobjective innmure algorithm with nondominated nieghbord-based selection”
ISBN: 978-960-474-257-8
139