are applied to a feature selection problem in on-line signature ver- ification. ..... Video-Based Biometric Person Authentication, AVBPA, ser. LNCS-3546. Springer ...
Feature Selection Based on Genetic Algorithms for On-Line Signature Verification Javier Galbally, Julian Fierrez, Manuel R. Freire, and Javier Ortega-Garcia Biometric Recognition Group–ATVS, EPS, Universidad Autonoma de Madrid, C/ Francisco Tomas y Valiente 11, 28049 Madrid, Spain email: {javier.galbally, julian.fierrez, m.freire javier.ortega}@uam.es
Abstract—Two different Genetic Algorithm (GA) architectures are applied to a feature selection problem in on-line signature verification. The standard GA with binary coding is first used to find a suboptimal subset of features that minimizes the verification error rate of the system. The curse of dimensionality phenomenon is further investigated using a GA with integer coding. Results are given on the MCYT signature database comprising 330 users (16500 signatures). Signatures are represented by means of a set of 100 features which can be divided into four different groups according to the signature information they contain, namely: i) time, ii) speed and acceleration, iii) direction, and iv) geometry. The GA indicates that features from subsets i and iv are the most discriminative when dealing with random forgeries, while parameters from subsets ii and iv are the most appropriate to maximize the recognition rate with skilled forgeries.
I. I NTRODUCTION In many pattern classification tasks, patterns are represented by a vector of feature values. This set of features does not always form the optimal group of parameters for all problems as they may be redundant, irrelevant, or dependent with each other depending on the scenario considered. The task of selecting the most discriminative features for a particular classification problem in a high dimensional space is known as feature selection. Given a d dimension problem there exist 2d possible subsets of features. Thus, for not-solarge values of d, exhaustive search is usually not feasible. Many different algorithms have been presented in literature to cope with this feature selection problem [1], being one of the most popular the Genetic Algorithms (GA) [2] [3]. GA are non deterministic methods which apply the rules of selection, mutation and recombination to a population of subjects each of them representing a possible solution to the problem. The goodness of each solution is computed according to some optimization criteria having the best individuals a higher probability of surviving to the next generation (natural selection). Following an iterative process a near to optimal solution is reached. In this work GA are applied to feature selection in an on-line signature recognition problem [4]. Each signature is represented by means of a 100 dimensional vector. The problem to be solved can be stated as follows: given a set of patterns (signatures) in a 100-dimensional space, find a subset of features of dimension d, with d < 100, where the
recognition rate of the system is maximized. Two different GA have been implemented: • GA with binary coding: it searches for a suboptimal solution in the complete space of 2100 possible solutions. • GA with integer coding: it searches for a suboptimal solution of a specified dimension µ d. In¶this case the 100 dimension of the search space is . d Four different scenarios are considered: skilled and random forgeries with 5 and 20 training signatures. The original features are divided into four different groups according to the signature information they contain, namely: i) time, ii) speed and acceleration, iii) direction, and iv) geometry. Comparative experiments are also given, resulting in some indications of the most discriminant information for the different scenarios considered. Results are given using all the 16500 signatures from the 330 subjects of the publicly available MCYT signature database [5]. The optimization criteria used for the convergence of the GA is the minimization of the system EER which is computed according to the similarity scores calculated using the Mahalanobis distance. GA showed remarkable performance in all the experiments carried out. This paper is structured as follows. The implementation of the GA is detailed in Sect. II. In Sect. III we present the data used in the experiments, the features extracted from the signatures and the experimental protocol followed. Results and further discussion are reported in Sect. IV. Conclusions are finally drawn in Sect. V. II. I MPLEMENTATION When applying a GA to a particular problem, there are three main points to be taken into account [2]: i) representation (coding) of the candidate solutions, ii) objective function to be maximized, and iii) genetic operators that will be used and their probabilities of occurrence. In the present work two different representations for the candidate solutions have been considered. • Binary coding: individuals (possible solutions) are represented by a binary vector of dimension 100. A bit set to 1 means that the corresponding feature is selected, and a bit set to 0 that it is not selected. No control is exerted on the number of 1’s of a particular solution so its
TABLE I S ET OF GLOBAL FEATURES CONSIDERED IN THIS CONTRIBUTION EXTRACTED FROM [6], AND SORTED BY INDIVIDUAL DISCRIMINATIVE POWER . T DENOTES TIME INTERVAL , t DENOTES TIME INSTANT, N DENOTES NUMBER OF EVENTS , AND θ DENOTES ANGLE .
# # Ranking 1 3 5 7 9 11 13 15
25 27
# #
Direction related feature Geometry related feature
Feature Description signature total duration Ts N (sign changes of dx/dt and dy/dt) standard deviation of ay (standard deviation of y)/∆y standard deviation of ax jrms t(2nd pen-down)/Ts A min =(ymax −ymin )(xmax −xmin ) Ppen-downs (∆ = (x −x ))∆
Ranking 2 4 6 8 10 12 14
Feature Description N (pen-ups) average jerk ¯ standard deviation of vy N (local maxima in x) standard deviation of vx N (local maxima in y) (average velocity v¯)/vx,max
16
(xlast pen-up − xmax )/∆x
(x1st pen-down − xmin )/∆x (y1st pen-down − ymin )/∆y (Tw v¯)/(xmax − xmin ) v¯/vy,max
18 20 22 24
(ylast pen-up − ymin )/∆y (Tw v¯)/(ymax − ymin ) (pen-down duration Tw )/Ts (ylast pen-up − ymax )/∆y v¯/vmax (xlast pen-up − xmin )/∆x (xmax −x min )∆y (ymax −y min )∆x T (vy > 0|pen-up)/Tw direction histogram s1 (xmax − xmin )/xacquisition range T (curvature > Thresholdcurv )/Tw T (vx > 0)/Tw T (vx > 0|pen-up)/Tw N (vy = 0) (standard deviation of x)/∆x (tangential acceleration rms at )/amax T (vy < 0|pen-up)/Tw t(3rd pen-down)/Ts (y3rd local max − y1st pen-down )/∆y direction histogram s5 T (vx < 0)/Tw T (vy < 0)/Tw (1st t(vx,min ))/Tw T (1st pen-up)/Tw direction histogram s4 (1st t(vx,max ))/Tw spatial histogram t1 θ(1st pen-down to 2nd pen-up) t(jx,max )/Tw jx,max θ(1st pen-down to 1st pen-up) ¯x (1st t(vmax ))/Tw θ(2nd pen-down to 2nd pen-up) spatial histogram t3 (2nd t(xmax ))/Tw (1st t(vy,max ))/Tw t(jy,max )/Tw (3rd t(ymax ))/Tw ¯y θ(initial direction) (2nd t(ymax ))/Tw
x
17 19 21 23
Time related feature Speed and Acceleration related feature
i=1
max |i
min |i
y
T ((dy/dt)/(dx/dt)>0) T ((dy/dt)/(dx/dt)0) T ((dx/dt)(dy/dt) 0)/Tw direction histogram s8 direction histogram s6 spatial histogram t4 (ymax − ymin )/yacquisition range (centripetal acceleration rms ac )/amax θ(1st to 2nd pen-down) direction histogram s7 spatial histogram t2 θ(1st pen-down to last pen-up) (1st t(xmax ))/Tw T (2nd pen-up)/Tw jy,max jmax (1st t(vy,min ))/Tw (3rd t(xmax ))/Tw t(jmax )/Tw direction change histogram c2 direction change histogram c4 direction change histogram c3 θ(before last pen-up)
search space comprises all the possible subsets, not just those of a specified size. A rank-based selection strategy [7] is used to avoid premature convergence, together with a one-point crossover operator [7]. Crossover and mutation probabilities were heuristically set to 0.85 and 0.01 respectively. We picked a population size of 100 and the GA ran for 250 generations. • Integer coding: individuals are represented by a vector of length M , being M the dimension of the subspace to be found. Each element of the vector is an integer in the range [1, 100] and selects the corresponding feature of the original set. As in sequential feature selection methods [1], in this case the dimension of the subset can be specified. Again a rank-based selection strategy is used together with an order crossover operator [8]. Mutation is carried out randomly changing an element value. Crossover and mutation probabilities, and population size were set to the same values as in the binary GA. The number of generations was 350. In both cases the evaluation function that measures the fitness (goodness) of each individual is f = 1/EER. The objective of the GA is to find the solution among all possible that maximizes f . The EER of the system is computed according to the similarity scores calculated using the Mahalanobis distance ((x − µi )T Σ−1 (x − µi ))1/2 , where x is the pattern being classified, µi is the mean of class i, and Σ is the covariance matrix. III. E XPERIMENTAL PROTOCOL A. Data set description Experiments were carried out on the MCYT Signature database which comprises 330 signers. Each user contributed with 25 original signatures and 5 forgeries of each of his 5 precedent donors. Thus, 25 original signatures and as many forgeries are available for each of the 330 subjects, to complete the 16500 signatures that conform the database. All of them were used in the experiments. An in depth description of the database can be found in [5]. B. Features considered The set of 100 global parameters considered to represent each signature is described in [6] and given here in Table I. We have generated four different groups of features according to the signature information they contain, namely: i) time (white cells in Table I), ii) speed and acceleration (light grey cells), iii) direction (dark grey cells), and iv) geometry (black cells). The features assigned to each class are the following (the numbering criterion followed is the same used in [6]). C. Scenarios Four different scenarios are considered: skilled and random forgeries with 5 and 20 training signatures. In the case of skilled forgeries impostors try to access the system imitating the genuine user’s signature. Client scores are computed comparing the test set (comprising signatures that were not used for the training) of each user with his trained
TABLE II C OMPARISON OF EER VALUES ( IN %) OF THE BINARY GA SOLUTION AND THE CASE OF USING THE WHOLE SET OF 100 FEATURES .
Skilled forgeries
Random forgeries
5 TR.
20 TR.
5 TR.
20 TR.
GA
10.01 (60)
3.31 (54)
4.11 (57)
0.78 (53)
100
14.52
4.70
5.94
2.60
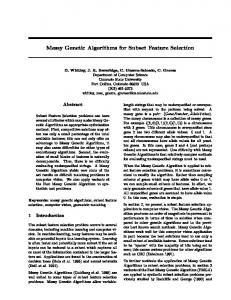
model. That is, 20 × 330, or 5 × 330 genuine scores for the cases of few/many training signatures, respectively. Impostor scores come from the comparison of the trained model with the 25 forgeries of the donor (25 × 330 impostor scores). In the random forgeries scenario impostors claim the genuine user’s identity using their own signature. Client scores are obtained the same way as in the skilled forgeries case. We compare one signature of each user with one signature of every other donor of the database to generate the 329 × 330 impostor similarity scores. IV. R ESULTS A. Experiment 1: Genetic Evolution In Fig. 1 (a), the evolution of the best individual of the binary GA for the case of skilled forgeries with 20 training signatures is shown. The dashed line shows the EER of the system for the case of using the whole set of 100 parameters. We can see that the GA converges in the iteration 100 (no real improvement is produced in the next generations) and that the subset of features found clearly outperforms the case of using all of the 100 parameters. In Table II the EER for the four scenarios considered and for the best subset of attributes found by the GA in each case is given in the first row. The dimension of the subspace solution is shown in brackets. In the second row the EER of the system when using 100 parameters is specified so that both EER values can be compared. The GA finds in all cases a subset of features that not only reduces the computation cost (it has about half number of features), but also provides a better classification accuracy. This fact shows the curse of dimensionality phenomenon that will be further studied using the integer GA. In Fig. 1 (b), the evolution of the integer GA is depicted for the case of skilled forgeries with 20 training signatures and M = 20, being M the fixed dimension of the subspace to be found. We see that the GA finds a subspace of dimension 20 where the system works better than in the 100 dimensional original space. B. Experiment 2: Curse of Dimensionality Experiments with the integer coding were also carried out in the skilled forgeries scenario for M = [5, 10, 20, 40, 60, 80, 90]. Results for 5 and 20 training signatures are shown in Fig. 2. The solid line shows the solution found by the GA and the dashed line is the performance of
SKILLED 20 TR
SKILLED 20 TR. M=20
10
10 100 param. EER GA EER
8
8
7
7
6
6
5
5
4
4
3
3 0
50
100 150 Number of generations
200
100 param. EER GA EER
9
EER (in %)
EER (in %)
9
250
0
50
100
150 200 250 Number of generations
(a)
Evolution of the binary GA (a) and the integer GA (b).
SKILLED 5 TR.
SKILLED 20 TR.
18
11 Top ranked GA
17 16
9
15
8
14
7
13
6
12
5
11
4
0
10
20
30
40
50
60
70
80
Top ranked GA
10
EER (in %)
EER (in %)
350
(b) Fig. 1.
10
300
90
3
0
10
20
M
Fig. 2.
30
40
50
60
70
80
90
M
Comparison between the GA and the feature selection top ranked scheme proposed in [6], where M is the feature subset size.
the system when adopting the top ranked individual feature selection strategy used in [6]. The GA clearly outperforms the other feature selection scheme. Interestingly, with the GA approach the curve drops faster for small M and the best EER value reached is lower. The curse of dimensionality phenomenon can be seen in Fig. 2. We can observe how the EER of the system decreases as additional features are considered, eventually reaching a minimum value and then starts to worsen with the introduction of more features. Worth noting this minimum is reached for around 60 features, as previously predicted by the binary GA. We also compared the best EER values found by the binary GA and those obtained with the integer GA for the two skilled forgeries scenarios considered and for the same dimension of the subspace. As expected, both results are very similar (< 8% relative difference), thus, the integer coding GA is also capable
of finding a near to optimal solution to the problem, with the advantage that the dimension of the feature subset can be fixed. C. Discussion From the curves depicted in Fig. 2 we can observe that the most discriminant features have already been found for M = 20 as the improvement for bigger values of M is very small (6.8% and 8.3% for 5 and 20 training signatures respectively). Based on this result we compared the best feature subsets of dimension 20 found by the GA for the skilled and random forgeries scenarios with 5 training signatures. The two feature subsets were analyzed and the results are summarized in Table III. In each cell the number of features of each class is shown. From the results shown in Table III we can see that the most discriminant features for skilled forgeries are those of groups regarding speed and acceleration (ii) and geometry of
0.4
Genuine signatures (all) Skilled forgeries (all) Random forgeries (all) Genuine Signature (shown) Skilled forgerie (shown) Random forgerie (shown)
Geometry Global feature 2
0.35
0.3
0.25 0.2
0.15
0.1
0.05 20
30
40 50 60 Geometry Global feature 1
70
80
0.07 Genuine signatures (all) Skilled forgeries (all) Random forgeries (all) Genuine Signature (shown) Skilled forgerie (shown) Random forgerie (shown)
Geometry Global feature 2
0.065
0.06
0.055 0.05
0.045
0.04
0.035 50
100
150 200 250 Geometry Global feature 1
300
350
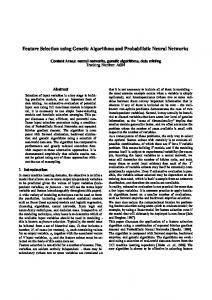
Fig. 3. Genuine signature (left), skilled forgery (top middle), and random forgery (bottom middle) of two different signers (top row and bottom row). On the right we depict two of the geometry parameters that were selected as most discriminant in the 20 dimensional subsets for both random and skilled forgeries scenarios. Features from the genuine signature and the two forgeries on the left are highlighted.
the signature (iv). For the random scenario the best features are groups regarding temporal information (i) and geometry (iv). Thus, we can conclude that the most informative parameters in either cases are the ones regarding geometry information and the least informative those based on angles and directions (iii). In Fig. 3 we depict two of the geometry parameters that were selected as most discriminant by the GA for both scenarios, skilled and random. We can see that for these two parameters a perfect classification of the random forgeries depicted is possible, and a fairly good separation of genuine and skilled forgeries. V. C ONCLUSIONS Two GA schemes were presented and applied to a feature subset selection problem for on-line signature verification. Four different scenarios (skilled and random forgeries with 5 and 20 training signatures) were considered. Both algorithms showed remarkable performance in all the experiments carried out, clearly displaying the curse of dimensionality phenom-
TABLE III N UMBER OF FEATURES FOR THE SKILLED (S) AND RANDOM (R) SCENARIOS WITH 5 TRAINING SIGNATURES AND M = 20 FEATURES BELONGING TO EACH OF THE FOUR GROUPS DESCRIBED IN S ECT. III-B.
Time
Speed
Direction
Geometry
S 5 TR.
4
7
2
7
R 5 TR.
8
1
0
11
enon. Different dimension subspaces were found in which the recognition rate of the system was improved compared to the original 100 dimensional space. It was shown experimentally that features regarding speed and acceleration information of the signatures are the most suitable for the skilled forgeries scenario, while those dealing with temporal information should be used in the random forgeries case.
VI. ACKNOWLEDGEMENTS J. G. is supported by a FPU Fellowship from Spanish MEC, and M. R. F. is supported by a FPI Fellowship from Comunidad de Madrid. The postdoctoral research of J. F. is supported by a Marie Curie Fellowship from European Commission. This work was supported by Spanish MEC under project TEC2006-13141-C03-03 and the European NoE Biosecure. R EFERENCES [1] A. K. Jain and D. Zongker, “Feature selection: Evaluation, application, and small sample performance,” IEEE trans. on Pattern Analysis and Machine Intelligence, vol. 19, no. 2, pp. 153–158, 1997. [2] M. L. Raymer, W. F. Punch et al., “Dimensionality reduction using genetic algorithms,” IEEE Trans. on Evolutionary Computation, vol. 4, no. 2, pp. 164–171, July 2000. [3] J. Yang and V. Honavar, “Feature subset selection using a genetic algorithm,” IEEE trans. on Intelligent Systems, vol. 13, pp. 44–49, 1998. [4] R. Plamondon and S. N. Srihari, “On-line and off-line handwriting recognition: a comprehensive survey,” IEEE Trans. on Pattern Analysis and Machine Intelligence, vol. 22, no. 1, pp. 63–84, January 2000. [5] J. Ortega-Garcia, J. Fierrez-Aguilar, D. Simon, J. Gonzalez, M. FaundezZanuy, V. Espinosa, A. Satue, I. Hernaez, J.-J. Igarza, C. Vivaracho, C. Escudero, and Q.-I. Moro, “MCYT baseline corpus: a bimodal biometric database,” IEE Proc. Vis. Image Signal Process., vol. 150, no. 6, pp. 395–401, December 2003. [6] J. Fierrez-Aguilar, L. Nanni, J. Lopez-Penalba, J. Ortega-Garcia, and D. Maltoni, “An on-line signature verification system based on fusion of local and global information,” in IAPR Intl. Conf. on Audio- and Video-Based Biometric Person Authentication, AVBPA, ser. LNCS-3546. Springer, 2005, pp. 523–532. [7] D. E. Goldberg, Genetic Algorithms in Search Optimization and Machine Intelligence. Addison-Wesley, 1989. [8] L. Davis, “Applying adaptive algorithms to epistatic domains,” in Proc. of the International Joint Conference on Artificial Intelligence, 1985, pp. 162–164.