The Nearest Neighbor algorithm is the simplification of pixel replication and decimation. Fractional resizing, i.e. to resize image such that it has m/n of the pixels.
(IJACSA) International Journal of Advanced Computer Science and Applications, Vol. 7, No. 6, 2016
Optimized Image Scaling Using DWT and Different Interpolation Techniques Wardah Aslam
Khurram Khurshid
Asfaq Ahmed Khan
Department of Electrical Engineering, Institute of Space Technology, Islamabad Pakistan
Department of Electrical Engineering, Institute of Space Technology, Islamabad Pakistan
Space and Upper Atmosphere Commission, Karachi, Pakistan
Abstract—Discrete Wavelet Transform (DWT) has gained much limelight in the past years. Wavelet Transform has precedence over Discrete Fourier Transform and Discrete Cosine Transform because they capture the frequency as well as spatial information of a signal. In this paper DWT has been used for image scaling purpose. To achieve higher visual quality image, DWT is applied on the gray scale image using a downscaling technique. The original image is recovered using IDWT by employing different interpolation techniques for upscaling. In this paper interpolation techniques used are: Nearest Neighbor, Bilinear and Bicubic. Peak Signal to Noise Ratio (PSNR) and Mean Square Error (MSE) is calculated for quantifying interpolated image effectiveness. Results show that the reconstructed image is better when using a combination of DWT and Bicubic interpolation. Keywords—Bilinear Interpolation; Bicubic Discrete Wavelet Transform Image Scaling
I.
Interpolation;
INTRODUCTION
In digital imaging, image scaling technique has wide range of applications from consumer electronics to medical field [1]. In image scaling, tradeoff is made between efficiency, smoothness and sharpness. Image can be scaled in two ways: up scaling and down scaling. As the name suggests, up scaling involves enlarging the image to fit the desired criteria. Upscaling is achieved by highlighting interesting features of the image. In case of down scaling amount of data required to represent the digital image is reduced. Down scaling is analogous to image compression. The process of interpolation is one of the fundamental processes in image processing. In image interpolation discrete data, within a known range of abscissa, is represented in the form of continuous data [2]. In interpolation values of the functions that lay at the position between samples is determined, this is attained by fitting a continuous function through discrete input samples. The quality of image depends on the interpolation technique employed. There are two categories of interpolation technique: deterministic and statistical. In deterministic technique, certain variability is assumed between sample points. In statistical interpolation, estimation error is minimized to approximate the signal. Nearest neighbor, bilinear interpolation and bicubic interpolation are commonly used interpolation techniques. Nearest neighbor is the simplest technique but in scaled image the effects of blocking and aliasing are present. Bilinear
interpolation is commonly employed technique in which horizontal and vertical directions are linearly interpolated to obtain target pixels [3]. In bicubic interpolation data points are interpolated on a two dimensional regular grid and the scaled image has much smoother results as compared to nearest neighbor and bilinear interpolation. The primary concept behind wavelets is to evaluate signal (image) at diverse scales or resolutions, this is known as multi-resolution. Temporal resolution is the competitive advantage of wavelet transform over Fourier transform since wavelet transform captures both frequency and location information (location in time).A wavelet family can be constructed from the mother wavelet. Unlike windowed Fourier analysis, a mother wavelet can change the size of widow by stretching or compressing. Due to this outstanding feature of wavelets, approximate and detail image can be attained, where approximate image of the signal is attained by large wavelets, while smaller wavelets give the detail information of the image. Therefore, by different sizes of windows, both high-frequency and low-frequency components of a signal can be adopted by the wavelets. Any little alter in the wavelet representation produces a corresponding little alter in the original signal, which means that local errors will not have an effect on the entire transform. The wavelets are favored for non-stationary signals, such as very concise signals and signals which have interesting components at diverse scales [4]. In this paper algorithm is proposed to interpolate image based on Discrete Wavelet Transform (DWT). Interpolated image is computed by first down sampling and then upsampling. Thereupon original image and interpolated image are compared through image quality measures. In the results it is shown that in order to achieve image of lower resolution, by employing diverse interpolation techniques, quality of image is affected. II.
LITERATURE REVIEW
The technique of image interpolation is as old as image processing. Initially, linear interpolation or nearest neighbor interpolation techniques were implemented for resampling an image. In late 1940’s when Shannon presented the information theory, the interpolation function was sinc function. Nevertheless, sinc function which is ideal interpolator has an infinite response, something which is not preferred for a local
294 | P a g e www.ijacsa.thesai.org
(IJACSA) International Journal of Advanced Computer Science and Applications, Vol. 7, No. 6, 2016
interpolation since local interpolation has finite impulse response. From statistical approach it has been suggested to approximate sinc function by using Lagrange polynomial. This concept is present in many numerical analysis based textbooks [5]. Various spline functions families have been used due to their numerical efficiency. In literature, at some places B-splines are mentioned as cubic splines [6], cubic interpolation refers as cubic splines [7], high-resolution spline interpolation [8] and bi-cubic spline interpolation [9]. Parker, Troxel and Kenyon published their very first paper 1983, entitled “Comparison of Interpolation Methods”, which was shortly followed by a analogous research put forward in 1988 by Maeland [10]. Moreover, prior effort of Keys, as well as Hou and Andrews, also shows the research done on the comparison between local and global interpolation [11], [12]. Parker et al. researched that the resampled image can have much better quality when cubic interpolation is used rather than nearest neighbor or B-spline interpolation, but at the expense of increased computational complexity. In order to avoid further continuation of mistaken belief, which has emerged over and over again in the literature, instead of interpolation it is preferred to address B-spline technique as Bspline approximation. Since 1990s, wavelet transforms are being productively used in image processing because of admissibility and regularity conditions which are two main properties of wavelets [13]. Image compression based on wavelet approach has proved to be an proficient and simplest method for image scaling. The principle objective behind wavelets is to calculate the high resolution details of the image. Previously, some prediction methods were proposed. Huang and Chang’s research [14] make use of multilayer perceptron (MLP) from neural networks; Chang and Carey et al [15],[16] proposed Mallat’s wavelet transform modulus maxima theory method [16]. Although Kinebuchi et al. [18] make use of Hidden Markov Trees (HMT) in order to predict coefficients present at higher scales, however, the drawback for HMT was the requirement of computationally extensive training procedure for parameter estimation. Therefore it was the need to introduce HMT-based methods which do not require any training data set [19]. A scheme proposed by Zhu et al. [20] makes use of statistical estimation. Wavelet analysis is an exciting novel method for solving difficult tasks in physics, mathematics and engineering, with modern application as diverse as data compression, wave propagation, image and signal processing, the detection of aircraft, pattern recognition, and submarines, computer graphics and other medical image technologies[21],[22],[23], [24] [25], [26]. Wavelet transform provides as efficient way for performing image fusion at multi scales with several advantages such as locality, multi resolution analysis, energy compaction and de– correlation [27]. Due to the admirable approximation ability of wavelet transform, image interpolation based on wavelets approach, performs well at the non-edge regions [28]. III.
DISCRETE WAVELET TRANSFORM
Discrete Wavelet Transform (DWT), as suggested by the name is a wavelet transform in which wavelets are discretely
sampled by multi-resolution analysis. The multi resolution decomposition procedure is the of distribution of a signal onto a set of wavelet basis functions. There are different DWT schemes which can be used for different sophisticated tasks. The most simple and most common DWT scheme is “Haar” wavelet. Haar wavelet can’t be differentiated because it is not continuous, which is a technical disadvantage of Haar wavelet [29].Application of DWT in 1-dimensional signal corresponds to 1-dimensional filter in each dimension [30]. While in case of images which are referred as 2-dimesional signal; application of DWT corresponds to 2D filter image processing in two dimension [31].Multi-resolution analysis decomposes the image into four non-overlapping subbands which contain approximation and detail coefficients. These sub-bands namely are LL1, LH1, HL1 and HH1[32]. In the proposed paper, these coefficients are computed using 5/3 Integer Wavelet. The advantage of using 5/3 filter is that it can be implemented in hardware using shift and odd operations. The analysis low- and high-pass 5/3 Wavelet filters are:
{h-2, h-1,h0,h1,h2}=
(1)
{g-1, g0, g1} = {
(2)
Suppose there is a one dimensional input signal s(t). In first level, s(t) by passing through high and low pass filter is decomposed into approximation and detail coefficients. In second level of decomposition, approximation coefficients obtained from first level is further decomposed into approximation and detail coefficients. Mathematically, s(t)= ∑
=∑ + ∑
(3)
Approximation coefficients, ‘ ’ are at scale index j. However approximation coefficients and detail coefficients ‘ ’ are at scale index j-1. ‘ ’and ‘ ’ are known as wavelet bases. Input signal is decomposed by using these wavelet bases. There exist orthogonality between wavelets and scale at each index level, coefficients ‘ ’ and ‘ ’ can be expressed in following equation: =∑
=∑
(m-2k)
(m)
(4)
(m-2k)
(m)
(5)
The approximation sub-band LL1; decomposed further in order to obtain next coarser scale of wavelet coefficients, until the desired scale “N” is obtained [34].
295 | P a g e www.ijacsa.thesai.org
(IJACSA) International Journal of Advanced Computer Science and Applications, Vol. 7, No. 6, 2016
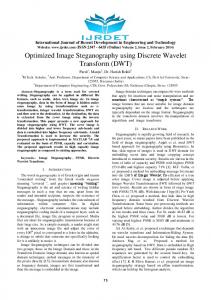
In above equation after convolution, it is downsample by the factor of 2. is scaling and is wavelet filter. The decomposition of a signal is not permanent. The decomposition of approximation and a detail can be inversed by using inverse transform. Inverse transform can be shown mathematically by similar expression but upsampling by a factor of 2will be used instead of down sampling and quadrature mirror filter (QMF). A. Analysis Image has two dimensional representations. Therefore, when dealing with image as an input signal we have to expand analysis and reconstruction in two dimensions.
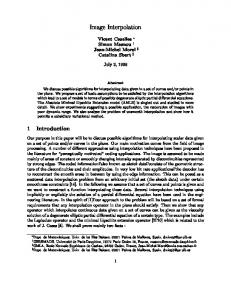
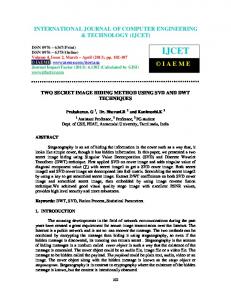
filter it is high-pass filter version. In doing so, spatial bandwidth gets half into each of subband. Such decomposition by passing the signal through low- and high-pass filter is 1D convolution followed by subsampling by factor 2 along rows and columns of image. Subsampling by the factor of 2; means that out of two consecutive samples, one of them was picked and the other was discarded. In the analysis case for one level decomposition, when downsample by the factor of 2 along row and column means that ‘ ’ contains 1/4th of the total number of image samples. In above Fig.1, h symbolized horizontal coefficients, v vertical coefficients and d detail coefficients. Fig.2. shows the decomposition of original image up to second level of decomposition. B. Synthesis Synthesis process reconstructs the original image. The subbands are first upscaled and then convolved with the respective filters. These upscaled convolved subbands are then added for original image reconstruction. This process is shown in Fig.3. The synthesis low- and high-pass filter coefficients:
{h-1,h0,h1}=
(6)
{g-2, g-1, g0, g1 , g2} =
} (7)
Fig. 1. Analysis Block Diagram
Fig. 3. Synthesis Block Diagram
Research shows that analysis filter for image minimization and reconstruction filters can be employed for image intensification. Due to their design and fractal nature wavelet filters have good interpolation properties.
Fig. 2. (a) Original Image (b) First level of decomposition (c) Second level of decomposition
When dealing with images, the image is decomposed into two subbands as shown in Fig.1: when image is passed through low pass filter the respective subband is low-pass filter version and when image is passed through high pass
For the proposed algorithm, xj was presumed to be the original image. Using lowpass filter analysis, it as downscaled by the factor of 2. Approximation of an original image, can be represented by lowpass filter coefficients xj+1. Since it is downsample by the factor of two it has height and width half of the original image. If analysis filter is normalized by Euclidean distance and the image is convolved with single normalized value instead of whole analysis filter, a better image is obtained. Moreover, in order to get better results the normalized value was multiplied with the factor of 3.Multiplying by the factor of 3 adjust the grayscale values.
296 | P a g e www.ijacsa.thesai.org
(IJACSA) International Journal of Advanced Computer Science and Applications, Vol. 7, No. 6, 2016
Afterwards, lowpass coefficients xj-1 , should be upscale.
A. Signal to Noise Ratio(SNR) SNR is the ratio between the average power of the signal and that of corrupting noise. Mathematically; ∑ ∑
∑ ∑
Fig. 4. Proposed Method
In Fig.4. Upsampling.
Symbolize downsampling.
Symbolize
“X” is to be multiplied by the corresponding normalized factor calculated. “Y” is analysis filters and “Y’” represents synthesis filters. IV.
INTERPOLATION TECHNIQUES
The original image is used for the evaluation of multiple interpolation techniques. Initially, the original image is downscaled which results in low resolution image. In order to magnify the image, interpolation is needed. In the proposed paper, different interpolation techniques were used and the resultant interpolated image was compared with the original image. In the literature, different approaches are discussed; some authors [35] have proposed using the same interpolation technique for downscaling as well as for upscaling and then comparing original image and interpolated image. Whereas, according to other approach [36] different interpolation techniques are used for upscaling and downscaling. Instead of scaling some authors have recommended image rotation [37]. On comparison of original image and interpolated images, results show that quality measures depend mostly on the downsampling method. Upsampling can also affect the results, it too can improve or degrade the results, but it doesn’t have much effect as compared to downsampling. In the domain of digital signal processing, interpolation is defined as the method of converting a sampled digital signal, by using a variety of digital filter methods, to signal with higher sampling rate. In the present research, the method used for downsampling was the same, whereas upsampling was achieved by using different interpolation techniques. Interpolation techniques for upsampling were used since upsampling by interesting zeros between original samples adds undesired spectral images which are centered on multiples of the original sampling rate. In order to avoid dreadful results interpolation was used. Nearest Neighbor, Bilinear and Bicubic interpolation techniques are used for upscaling. V.
QUNATIFYING INTERPOLATION EFFECTIVENESS
When image is interpolated, one of the several distortion or quality metrics can be applied to quantify the degree to which the interpolated image matches the test image. Some of quality metric measures are:
(8)
In the above expression, ‘ ’are pixels from test image and ‘ ’ are pixels of resultant interpolated image respectively. B. Mean Square Error (MSE) MSE is mean square error, which is given as; ∑
∑
(9)
Where; ‘m’ and ‘n’ describe height and width of the image. C. Structure Similarity Index Measure (SSIM) SSIM is used to evaluate the similarity between the tested and reconstructed image. Where MSE or PSNR estimate absolute errors, SSIM considers image degradation as perceived change in structural information. Mathematically; SSIM =
Where:
(
(
)
)
(10)
; average of x, ; average of y, ; variance of x, ; variance of y, ; covariance of x and y, 2 , 2 are the two variables used to stable the division with weak denominator, ; dynamic range of pixel values.By default = 0.01 and = 0.03 VI.
RESULTS AND CALCULATIONS
A. Traditional Interpolation Techniques Result a) Nearest Neighbor In this technique simply replicate the value from neighboring pixels. The Nearest Neighbor algorithm is the simplification of pixel replication and decimation. Fractional resizing, i.e. to resize image such that it has m/n of the pixels per column and m/n of the rows in the original (m and n are both integers) is also included in nearest neighbor technique. When applied on SINAN image the reconstructed image after using nearest neighbor technique is shown in Fig.5 (a). b) Bilinear Interpolation Bilinear Interpolation calculates new values for the pixels that have middle values between the original pixels. The result of bilinear interpolation is smoother but somewhat blurry. The pictorial functioning along with mathematical derivation of this scheme is depicted in Fig.5(b).
297 | P a g e www.ijacsa.thesai.org
(IJACSA) International Journal of Advanced Computer Science and Applications, Vol. 7, No. 6, 2016
c) Bicubic Interpolation In image processing, when speed is not an issue for image resampling, bicubic interpolation is often favored over bilinear or nearest neighbor interpolation techniques. Unlike bilinear interpolation which takes 4 pixels (2x2) into account, bicubic interpolation considers 16 pixels (4x4). Therefore, bicubic interpolation resampled images gives smoother results and have few interpolation artifacts. Image reconstructed by upscaling using Bicubic Interpolation technique is shown in Fig.5(c).
Fig. 6 (c) visually don’t show much difference as compared to Fig. 5 (c) but the image quality measure calculations shown in TABLE II show that the image reconstructed through proposed algorithm has “good” PSNR as compared to the image reconstructed earlier.
Image quality measure metrics SNR, MSE, PSNR and SSIM were also calculated as shown in TABLE I.
Fig. 6. (a) Nearest Neighbor (b) Bilinear (c) Bicubic Interpolation
These calculations support our algorithm. Reconstructed image quality is much better when proposed algorithm is used, as compared to traditional technique or previous algorithm. The proposed algorithm has more PSNR. The reconstructed images using proposed algorithm have less artifacts or blurring. Fig. 5. (a) Nearest Neighbor (b) Bilinear (c) Bicubic Interpolation
TABLE I.
B. Proposed Algorithm Results The quality of reconstructed image was better when proposed algorithm was used. Results are shown in Fig.6. Fig.6(a) shows the image reconstructed by using nearest neighbor technique for upsampling. It has much better quality as compared to image reconstructed earlier since that one has blocky affects. Fig.6 (b) has image quality much better as compared to Fig.5. (b). It has defined edges whereas in Fig.5.(b) edges were not that much sharp.
INTERPOLATION EFFECTIVENESS MEASURE VIA TRADITIONAL APPROACH
Interpolation Techniques
Mean Square Error (MSE)
Peak Signal to Noise Ratio (PSNR)
Signal to Noise Ratio (SNR)
SSIM
Nearest Neighbor
3.6362
45.6064
4.3354
0.0008
Bilinear
3.7644
65.7570
23.9636
0.0070
Bicubic
3.9790
65.9978
24.1771
0.0023
298 | P a g e www.ijacsa.thesai.org
(IJACSA) International Journal of Advanced Computer Science and Applications, Vol. 7, No. 6, 2016 TABLE II.
PROPOSED ALGORITHM INTERPOLATION EFFECTIVENESS MEASURE
Interpolation Techniques
Mean Square Error (MSE)
Peak Signal to Noise Ratio (PSNR)
Signal to Noise Ratio (SNR)
SSIM
Nearest Neighbor
7.2155
48.5826
7.24
0.0030
Bilinear
1.4867
61.7223
20.2524
0.0351
Bicubic
1.5131
61.7986
20.3116
0.0165
VII. CONCLUSION AND FUTURE WORK In this paper it is an efficient method to scale an image using discrete wavelet transform is proposed and the results proved the accuracy and efficiency of proposed methodology. It was observed how different interpolation techniques used in downscaling influence the reconstructed image. When nearest neighbor interpolation techniques used for downscaling the reconstructed image has artifact. Bilinear has much better results as compared to nearest neighbor. Moreover, Bicubic Interpolation technique gave the best reconstructed image. The method proposed for wavelet downscaling in this paper give appreciably better results for all quality measures metrics and upscaling method in comparison with traditional interpolation methods. In future, different interpolation techniques can be used for upscaling as well. These upscaled and transformed images can be used with different downscaled techniques to reconstruct the test image. Moreover, different quality measure such as MSE, PSNR and SNR can be calculated to support the proposed methods. In the proposed method multiplication and division was done by the factor of 0.5, in future any other factor can be used too, to observe the effect they have on reconstructed image. We have used an image “SINAN”, we can perform the same method on multiple images, i.e. Text image, medical image and animal image too, and compared the image quality measures for all these images. [1]
REFERENCES Shih-Lun, “VLSI implementation of a low-cost high-quality image scaling processor”, IEEE transaction. Circuit System II, Exp.Breifs, vol.60, No.1,pp.31-35,Jan 2013.
[7]
KEYS, R.G. Cubic convolution interpolation for digital image processing. IEEE Trans. Acoust, Speech, Signal Processing, 1981, vol. ASSP-29, no. 6, pp. 1153-1160.
[8]
MAELAND, E. On the comparison of interpolation Methods. IEEE Trans. Med.Imag., 1988, vol. MI-7, pp. 213-217.
[9]
PARKER, J. A., KENYON, R.V., TROXEL, D.E. Comparison of interpolation methods for image resampling. IEEE Trans. Med. Image., 1983, vol. MI-2, pp. 31-39.
[10]
DANIELSSON, P. E., HAMMERIN, M. High Accuracy Rotation of Images. Department of Electrical Engineering, Linkoping University, Sweden, Tech. Rep. LiTH-ISY-I-11521990.
[11]
DANIELSSON, P. E., HAMMERRIN, M. Note: High accuracy rotation of images. CVGIB: Graph. Models Image Processing, 1992, vol. 54, no. 4, pp. 340-344.
[12]
DODGSON, N. A. Quadratic interpolation for image resampling. IEEE Trans. Image Processing, 1997, vol.6, pp. 1322-1326.
[13]
MALLAT, S. A Wavelet Tour of Signal Processing.Second edition, Academic Press, 1999.
[14]
CHANG, S.G., CVETKOVIC, Z., VETTERLI, M. Resolution enhancement of images usingWavelet transforms extrema interpolation. IEEE ICASSP, pp. 2379-2382, May 1995.
[15]
CAREY, W.K., CHUANG, D.B., HEMAMI, S.S. Regularity preserving image interpolation.IEEE transaction.Image Process.1999, vol.8, no.9, pp.1293-1297.
[16]
MALLAT, S., ZHONG, S, Characterization of signals from multiscale edges.IEEE transaction. Pattern Analysis and Machine Intelligence, vol.14, no.7, pp. 710-732. July 1992.
[17]
HUANG, Y.L., CHANG, R.F. MLP interpolation for digital image processing using wavelet transform. In Proceedings of IEEE ICASSP99, Phoenix (Arizona, USA), pp. 3217-3220.
[18]
KINEBUCHI, K., MURESAN, D.D., PARKS, T.W. Image interpolation using wavelet-based Hidden Markov Trees.In Proceedings of IEEE Inter. Conf. Acoustics, Speech and Signal Processing, vol.3, pp.1957-1960. May 2001.
[19]
WOO, D.H., EOM, I.K., KIM, Y.S. Image interpolation based on interscale dependency in wavelet domain. IEEE ICIP, vol.3, pp.16871690. Oct 2004.
[20]
[20] ZHU, Y., SCHWARTZ, S.C., ORCHARD, M.T. Wavelet domain image interpolation via statistical estimation. In Proc. IEEE Inter. Conf. Image Proc. Vol.3,pp.840-843. Oct 2001.
[21]
HATICE GUNES, MAJA PANTIC. Automatic, Dimensional and Continuous Emotion Recognition .I.J of Synthetic Emotions, 2010, pp 68-99.
[22]
CHAVAN, TALBAR. Multimodality Medical Image Fusion using MBand Wavelet and Daubechies Complex Wavelet Transform for Radiation Therapy. I.J of Rough Sets and Data Analysis, 2015.
[2]
THÉVENAZ, P., BLU, T., UNSER, M. Image interpolation and resampling. In Handbook of Medical Imaging, Processing and Analysis, I.N. Bankman, Ed., Academic Press, San Diego CA, USA, pp. 393420,2000.
[23]
SOURAV SAMANTA, ALKOPARNA CHOUDHURY, NILANJAN DEY, VALENTINA EMILIA BALAS. Quantum Inspired Evolutionary Algorithm for Scaling Factors Optimization during Manifold Medical Information Embedding. ELSEVIER
[3]
Jensen.K and Anastassiou.D, “Subpixel edge localization and the interpolation of still images.” IEEE transaction.Image Process, vol.4, no.3, pp. 285-295, Mar 1995.
[24]
[4]
B.B. Hubbard, The World According to Wavelets, A K Peters Wellesley, Massachusetts, 1995.
VIKRANT BHATEJA, ABHINAV KRISHN, HIMANSHI PATEL, AKANKSHA SAHU. Medical Image Fusion in Wavelet and Ridgelet Domains: A Comparative Evaluation. I.J of Rough Sets and Data Analysis, 2015, vol. 2, Issue 2, pp 78-91.
[25]
SHIVASHANKAR B. NAIR, W. WILFRED GODFREY, DONG HWA KIM. On Realizing a Multi-Agent Emotion Engine.I.J of Synthetic Emotions, 2011.
[26]
NILANJAN, SOURAV, YANG, ACHINTYA DAS, SHELI SHINA CHAUDHURI. Optimisation of scaling factors in Electrocardiogram signal watermarking using cuckoo search. I.J. Bio-Inspired Computation, 2013, vol. 5, pp 316-326.
[5]
FAIRES, J.D., BURDEN, R.L. Numerical Methods. Boston, MA: PWS, 1993.
[6]
HOU, H. S., ANDREWS, H.C. “Cubic splines for image interpolation and digital filtering”. IEEE Trans. Acoust, Speech, Signal Processing, 1978, vol.ASSP-26, no.6, pp.508-517.
299 | P a g e www.ijacsa.thesai.org
(IJACSA) International Journal of Advanced Computer Science and Applications, Vol. 7, No. 6, 2016 [27]
SHEEFA RUBY GRACE, MARY IMMACULATE SHEELA. A Comparison on Performance Evaluation of Various Image Fusion Techniques.I.J of Emerging Technology and Innovation Engineering, 2015, vol. 1, Issue 3, pp 129- 136.
[28]
S. ZEESHAN ABBAS, K. KHURSHID. High Speed, Noise Resistant Data Transferring System for LEO Satellite Mission. I.J of Computer and Communication System Engineering, 2015, vol. 2, pp 238-245.
[29]
NILANJAN, SAYANTAN, ACHINTYA DAS, SHELI SHINA CHAUDHURI. Analysis of P-QRS-T Components Modified Blind Watermarking Technique Within the Electrocardiogram Signal for Authentication Wireless Telecardiology Using DWT.I.J. Image, Graphics and Signal Processing, 2012, vol. 7, pp 33-46.
[30]
NILANJAN, MOUMITA, ACHINTYA DAS. A Session Based Blind Watermarking Technique within the NROI of Retinal Fundus Images for
Authentication Using DWT, Spread Spectrum and Harris Corner Detection. I.J. of Modern Engineering Research, 2012, vol. 2, Issue. 3, pp 749-757. [31]
TANMAY, NILANJAN, S.R. BHADRA CHAUDHRI. A Novel Session Based Dual Steganographic Technique Using DWT and Spread Spectrum. I.J. of Modern Engineering Research, 2012, vol. 1, Issue. 1, pp 157-161.
[32]
NILANJAN, SOURAV, SAYAN, ACHINTYA DAS, SHELI SHINA CHAUDHURI, S. JASJIT SURI. Firefly Algorithm for Optimization of Scaling Factors During Embedding of Manifold Medical Information: An Application in Ophthalmology Imaging. Journal of Medical Imaging and Health Informatics, 2014, vol. 4, Issue 3, pp 384-394.
300 | P a g e www.ijacsa.thesai.org