Orientation Map: A Reaction-Diffusion Based Model Basabi Bhaumik Department of Electrical Engineering, Indian Institute of Technology, Hauz Khas, New Delhi-110016, India. e-mail:
[email protected]
Chota.M.Markan Department of Physics & Computer Science Dayalbagh Educational Institute Dayalbagh, Agra - 282005, India e-mail:
[email protected]
Abstract We show that models for orientation map formation, which invoke convolution in the dynamic equation, are in fact invoking non-local reaction diffusion. In the early stages of development it is unlikely that non-local interactions take place. We present a non-linear reaction diffusion model based on near neighbour interaction for formation of orientation map. Besides capturing all the essential topological qualities of experimental orientation, our model also deals with the interspecies variations in the orientation map. Keywords: Visual cortex, Feature Maps, Orientation preference, Reaction diffusion. 1. Introduction A large number of models have been proposed in literature f3r formation of orientation map. These models can satisfactorily explain the broad features of development of orientation map. Efforts are now being made to compare these models and to develop a more comprehensive picture (Erwin et.al., 1995; Grossberg and Olson, 1994; Yuille et.al., 1996). Most of these models, despite apparent differences, are based on some or other principles of 'spatial filtering' which corresponds to lateral interaction amongst the cortical cells, excitory in near neighbourhood and inhibitory beyond. Such filters usually employ a Mexican hat (or a difference of gaussians ) type function for convolution. Analysis of these models show that they necessarily involve non-local or long range inter-action. However, it is unlikely that long-range intra-cortical connections exist in the very early stages of development (Nelson and Katz, 1995; Durac and Katz, 1996). It seems more plausible that cortocortical interaction takes place through nearest neighbour, or local interaction. It would be very satisfying to have a model, which uses only local interaction, as it will provide a physical mechanism for development of intra-cortical interactions. Recent experiments have established that long-range potentiation (LTP) can spread to synapses on neighbouring neurons by diffusible signal (O'Dell et al., 1991; Schuman and Madison, 1991, 1994). The diffusiable messenger may be nitric oxide or other retrograde messengers such as carbon monoxide, arachidonic acid etc (Williams et al., 1993). LTP is thought to play a central role in the development of memory and brain. In the light of these experiments it is our belief that the physical mechanism responsible for formation of orientation map is diffusion. In the present paper we develop a reaction-diffusion model for development of orientation map without involving any non-local interaction in the cortex. 2 Orientation Map: Filter based Models Three different forms of bandpass filters have been used in literature to generate orientation map. (i) Gaussian ring filter (Rojer and Schwartz, 1990; Schwartz 1994), (ii) Difference of gaussian (DOG) filter or DOG cortical interaction (Miller, 1994; Obermayer et al., 1992, 1995; Swindale, 1992 and (iii) ideal bandpass filter( Grossberg and Olson, 1994). It is instructive to examine bandpass filtered signal W(x,t) in one dimension .
(h*W)= jh(X-z)W(z,t)dz = jhG/)W(X-y,t)dy where, y = x — z ; Expanding W(X — y, t) about x and using the symmetry of Gaussian or Mexican hat kernel used in the literature to model the lateral connectivity in cortex we can write
= h0W(x,t)+h2
ax2
dx
228
where, h, = \ h(y)dy, h, = j — h(y)y2dy1 etc. We study Swindale's model in particular. The results can be extended to other convolution based models. The orientation map formation in Swindale's model ( 1982) is governed by the equation
Ot 1
(Y\
where w = (x,Y) is a vector. IW( and 4 = — tan cortical
cell
2 h(r) iis
respectively.
x2 +y2
h(x,y)=b,ex(
' |represent the tuning and orientation specificity of a
[X,
the
DOG
- b, exp
Using the analysis outlined above we can express (3) as
dW
H
d2W{x,y,t) dx2
• - (1-[W'W
where, h0 =7T\pldi —b2d2) ,h2 = — \p\d]
d2W(x,y,t)\ (3)
dAW{r,t) '-+2 2 2 dx dy
dx4
t
•}
—b2d2 J and h4 = — l^i^i ~b2d2 J
Swindale's model invokes non-local diffusion through 4'h and higher order moments of the kernel h(x,v). All models invoking convolution in their dynamic equation are reaction diffusion systems with non-local diffusion. In the next section we show that the presence of near neighbour diffusive Hebbian learning mechanism is sufficient for the formation of orientation map. Long range intra-cortical connectivity or non-local effects are not necessary for formation of orientation map. 3 Orientation Map: the Reaction Diffusion Model with Pin-wheel as Local Structure The general form of reaction diffusion is given by
dW ^ - = f{W) + D.V2W dt
(4)
for various functionsf() and constant matrix D. For formation of orientation map we propose a two morphogen (X, Y) model where where N is an integer and N 21. We therefore write dW i/ 7. T % 2
—— = W(y -[W W] ) + D.V W dt
(5) r
where W = [X
v
[Dx
0 7
Y\ and D = |_ 0
W Wrepresents tuning, 4 = tan
DY J —'- represents orientation preference of a cortical cell and 0 < 3 I 1. With
\X J N=l, for W W = y the reaction term becomes zero. Note the first term on RHS of (3) is same as the reaction
229
term f(w) in our model (with N = 1 and 3 = 1 )except for the multiplication factor h,. Two morphogens (x,U) represent the effect of any two antagonistic mechanisms that may contribute to orientation selectivity i.e the receptive field properties of a cortical cell. W is orientation vector and the two morphogens X and Y are the components of orientation vector W. An important element in the structure or formation of real pattern is the existence of well defined local structures or "defects". Pinwheel is the characteristic local structure in orientation map. We shall next show that pinwheel is a local structure in our model. The time independent case of reaction diffusion equation in (5) for N=l and y= 1 can be expressed in polar co-ordinate (r, e) as •|2,
ro'r
c/r
r
dd
Let W(r,6) = R(r)exp[i(n6 + 6 , ) ] b e a solution of (6). R is the orientation tuning. The angle 8 represents orientation specificity I$ and n is an integer. For r > 0 the modulus W(r) satisfies the following boundary value problem D —-- + — — •
dr
r dr
.
r"
with R(0) = 0 and R(m) = 1. R(0) = 0 preserves the continuity of W at r = 0. R ( - ) = 1 is consistent with uniform states W = e x p ( i 6 , ) as r —+ W. Asymptotic behaviour of R(r) (Neu 1990) can be expressed as R(r) E arln' +o(r1n'+2)
asr+o
Dn R(r) ~ i z- + o(i/r~ ) Dnasr-+2r Note that for n = 1 orientation specificity § decreases from 180" to 0" with clockwise motion around r = 0 i.e we get a -ve pinwheel centre. For n = -1 we get a +ve pinwheel centre. For D = 0.03 R(r) —+ 1 for r 2 5. Pinwheels with n = +1 and n = -1 are topologically stable. Pinwheels or vortices with In1 2 2 are unstable (Crewick and Morrison, 1980; Neu, 1990). Our simulation studies on interaction of vortices or pinwheels with In1 2 2 confirms the numerical studies reported in (Carlson and Miller, 1986). A vortex with n = +1 (or n= -1) retains its vortex structure as long as it remains separated from it neighbouring vortex with n = -1 (or n = +1) by a distance greater than a core radius. Core radius is a characteristic distance from the center of the vortex at r = 0 over which R(r) is significantly less than 1. 4. Orientation Map: Simulation Results A 100x100 array of cells, each cell represented by a two-dimensional variable (X; y), having no-flux boundary conditions was simulated by difference equation method with parallel update. Diffusion constant D, = Dy = D = 0 . 0 2 5 . The diffusion constant in (5) determines the lateral distance within the cortex over which the synapses on one cell can influence the nearby cells. Initial values for both X and Y were small and chosen randomly so that corresponding orientation tuning is small and orientation preferences are random. 10,000 Iterations were performed. The characteristics of simulated maps are summarized in Table 1. The iteration number in our model represent "developmental time" represented by "t". We split the spatial distribution of the orientation values into four types of regions. When two nearby cells have orientation difference of (0"-2") it is referred as Saddle region, (2"-18") as Linear region, (18"-63") as Fracture region, (63"-90") as Singularity or pinwheel centre. On analysing these maps we find a number of pinwheels. Moving around a pinwheel centre orientation smoothly changes from 0" to 180". If such orientation changes are in clockwise direction around a pinwheel we call the pinwheel centre as positive singularity. In a negative singularity orientation changes in anticlockwise direction. Pinwheels most often have a tendency of occurring in pairs (see Table 1) which are close together. At later stages of development pinwheels are well spaced out with occasional relatively large area free of singularities. This has also been observed in experimental results (Swindale, 1992). The number of pinwheels decreases and distance between pinwheel pairs increases with increasing "t" i.e. iteration number (see Table 1). Almost uniform representation of all orientations was found in the orientation map through all iterations.
230
Table 1: Pinwheel statistics for the orientation maps for (i) constant y (= 1) and (ii) varying y where y = 0.1 at the start and increases in steps of 0.9/10000.
s. No.
Iteration No.
1.
800
2.
2,000
3.
4,000
4.
6,000
5.
10,000
No. of antic ockwise(-) & clockwise(+) linwheels for y constant growing +156 +106 -102 -165 +31 +80 -76 -32 +52 + 17 -17 -51 +16 +40 -40 -16 ,+24 +14 -14 -23
Least distance between a pair of pinwheels for y growing constant 1 1
Average distance between a pair of pinwheels for y growing constant 3 3
1
1
4
6
1
3
5
10
1
3
5
11
2
4
8
13
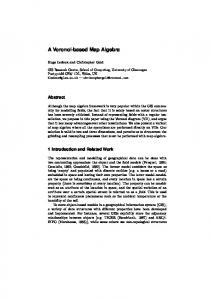
In the early stages of development the behaviour of the model is dominated by diffusion. As a result rapid smoothening of the initial map occurs. For 3 = 1 the number of pinwheels is almost twice the number of pinwheels for varying 3 and the distance between pinwheels is consequently less. Fig 1 shows one of our simulated maps.
00 .-(b) (c) Fig 1. (a) The initial random orientation map. (b) simulated orientation map (c) The experimental orientation preference map from Rao et.al. Journal of Comp Neurol V387, pp 358-370,1997. We studied the distribution of tuning, W W, as a function of distance from pinwheel centre for N =1, 3 = 1and for varying 3 for different values of diffusion constant. For varying 3 , at locations away from the pinwheel centre tuning increases slowly as compared to the case for y = l . For diffusion constant D=0.25, at or closely around the pinwheel centres the cells are poorly tuned. Poor orientation selectivity or tuning at the pinwheel centres have been reported earlier (Blasdel 1992). However, in monkey visual cortex, single cell recordings (Bartfield and Grinvald, 1992) in cells located within 50 p m from pinwheel centers or singularities in orientation map, were found to be sharply tuned in about 75% cases. Note that for lower values of diffusion constant (D= 0.025) in our simulated orientation map even the cells at or near the pinwheel centres become sharply tuned. 5. Interspecies variation in the orientation map The mechanism governing the development of visual cortex is expected to be fairly universal. Therefore any model of value should be able to account for interspecies variations in orientation maps. In our model the development of orientation map depends (i) diffusion constant, (ii) iteration number representing developmental time and (iii) y. In the following we shall consider two cases. Case A: Two animals have same diffusion constant and y. The difference in the orientation map of the two animals will be due to the difference in the iteration number or developmental time available for the development of the two
231
maps. In this case the orientation map for the animal born earlier will have larger number of pinwheel pairs as compared to the animal born later (refer Table 1). Also less number of iteration in the animal born earlier will cause the orientation cells to be less well tuned as compared to the animal born later. Further the spatial period in the orientation map of the animal born earlier will be less. This prediction of our model is biologically validated in the ferret and cat orientation maps. Experimental observations (Chapman and Stryker 1993) suggest that development of orientation selectivity in ferret and cat follow identical course of development. Accordingly cat and ferrets will have same or similar diffusion constant and y in our model. Therefore, as compared to cats ferrets should have higher density of pinwheels (see Table 1) and hence smaller distance between pinwheel pairs. The spatial period i.e. orientation column width in cat according to our model will be larger as compared to ferrets. This prediction of our model is born out by experimental results on orientation map in ferrets (Weliky et al. 1996) and cats (Shatz et al., 1977; LeVay et al., 1978). The other prediction of our model is regarding tuning; in our model tuning is lower for lower value of iteration number. Therefore, our model predicts that ferret cortex should have less well tuned cells as compared to cat cortex as ferrets are born earlier. This is indeed the case; the cells in adult ferret primary visual cortex are found, in general, less well tuned for stimulus orientation than are cells in adult cat area 17 (Chapman and Stryker 1993). •
Table 2: The number of pinwheels, distance between pinwheel centers, orientation tuning, orientation preference and orientation specificity statistics for three different values of diffusion constant. S.No. 1. 2. 3. 4. 5. 6. 7. 8. 9. 10.
Item +ve singularities -ve singularities Least Distance Average distance Saddle Region Linear Region Fracture Region Singularity Region Minimum Tuning Maximum Tuning
D=0.0025 + 141 -147 1 3 11.0% 65.4% 20.8% 2.8% 0.97 1.00
D=0.025 +24 -23 2 8 35.5% 61.6% 2.6% 0.3% 0.86 1.00
D=0.25 +4 -4 4 10 72.9% 26.6% 0.45% 0.05% 0.12 1.00
Case B: Two animals have same y. The difference in the orientation map of the two animals will be due to the difference in (i) the diffusion constant and (ii) the developmental time. Let the two diffusion constants be D, and Db and the iteration numbers be T, and Tb. In the following we consider two subclasses. a) D,> Db and T,> Tb: Our model predicts that the animal "a" will have longer spatial period. b) D,< Db and T,> Tb : Due to D,< Db the spacing between pinwheel pairs will be less in animal "a" (refer Table 2) and the spatial period in the orientation map is also small. But due to T, > Tb the spacing between pinwheel pairs should increase (refer Table 1) and the spatial period will be. If the effect of D, < Db overrides the effect of T, > Tb then the orientation map of animal "a" will have larger density of pinwheels and lesser spatial period as compared to animal "b". The developmental time in monkey is longer than the developmental time in cat. But monkeys have larger density of pinwheels than cats. In the cat area 18 the periodicity of orientation column is 0 . 8 - 1 . 0 " (Shatz et al., 1977; LeVay et al., 1978) and in the monkey area 17 it is 0 . 5 7 " (Hubel & Wiesel, 1974). If y is same in both monkey and cat cortex then to account for the larger density of pinwheels in monkey and smaller orientation column width in monkey, monkey must have lower value of diffusion constant as compared to cat. Lower values of diffusion constant will result in more fracture regions (see Table 2) in the orientation map of monkey as compared to cat. Further the lower values of diffusion constant and larger number of iterations in monkey cortex, according to our model, will result in the cells in the monkey cortex to be quite sharply tuned as compared to cat. 8.Conclusion It had been suggested (Grossberg, 1976; Swindale, 1980) that reaction diffusion may play an important role in the development of feature detectors in the visual cortex. Miller et al., (1989) has suggested that during development of ocular dominance, intracortical interaction via synaptic connection may be augmented or replaced by an interaction
232
via diffusion. We have shown in this paper that all models invoking convolution in the dynamic equation are in fact invoking non-local reaction diffusion. We have presented a nonlinear reaction diffusion model based on near neighour interaction. References 1.
Bartfield E, Grinvald A (1992) Relationship between orientation-preference pinwheels, cytochrome- oxidase blobs and ocular dominance columns in primate striate cortex. Proc Natl Acad Sci USA 89:11905-11909 2. Blasdel GG (1992a) Diferential imaging of ocular dominance and orientation selectivity in monkey striate cortex. J Neurosci 12:3115-3138 3. Carlson N, Miller K (1986) Gradient weighted moving finite element in two dimensions, in Finite Elements: Theory and Application, (Eds), Dwoyer D, Nussaini M, Voight R, Springer, Berlin, pp 151-163 4. Chapman B, Stryker MP (1993) Development of orientation selectivity in ferrets. J Neurosci 13(12):5251-5262 5. Crewick J, Morrison N (1980) On the dynamics of quantum vortices. Phys. Lett. A 76:267 6. Durack JC and Katz LC (1996) Development of horizontal projections in layer 213 of ferret visual cortex. Cereb Cortex 6:178-183 7. Erwin E, Obermayer K, Schulten K (1995) Models of orientation and ocular dominance columns in the visual cortex: A critical comparison. Neural Computation 7:425-468 8. Grossberg S (1976) On development of feature detectors in the visual cortex with application to learning and reaction drffusion systems. Biol Cybern 21:145-159 9. Grossberg S, Olson SJ (1994) Rules for the cortical map of ocular dominance and orientation columns. Neural Network 7~883-894 10. Hubel DH, Wiesel TN (1974) Sequence regularity and geometry of orientation columns in the monkey striate cortex. J CompNeorol 158:267-294 11. LeVay S., Stryker MP, Shatz CJ (1978) Ocular dominance columns and their development in layer IV of the cats visual cortex: a quantitative study. J Comp Neurol 179:223-244 12. Miller KD, Keller JB, Stryker MP (1989) Ocular dominance column development: Analysis and simulation. Science 245605-615 13. Miller KD (1994) A model for development of simple cell receptive fields and the ordered arrangement of orientation columns through activity dependent competition between ON- and OFF-center inputs. J Neurosci 14:409-441 14. Nelson, DA, Katz. LC (1995) Emergence of functional circuits in ferret visual cortex visualized by optical imaging, Neuron, 15: 23-34 15. Neu JC (1990) Vortices in complex scalar field. Physica D 43:385-406 16. Obermayer K, Blasdel GG, Schulten K (1992) Statistical mechanical analysis of self organization during the development of formation of visual maps. Phys Rev A 45:7568-7589 17. Obermayer K, Sejnowski T, Blasdel GG (1995) Neural pattern formation via competitive Hebbian mechanism. Behav Brain Res 66:161-167 18. ODell TJ,Hawkins Rd, Kandel Er, Arancio 0 (1991) Tests of the role of two dSffusiable substances in long-term potentiation: evidence for nitric oxide for possible early retrograde messenger. Proc Natl Acad Sci USA 88:11285-11289 19. Rojer AS., Schwartz EL (1990) Cat and monkey cortical columnar patterns modelled by band-pass filtered 20 white noise. Biol Cybem 62:381-391 20. Schuman EM, Madison DV (1991) A requirement for the intercellular messenger nitric oxide in long-term potentiation. Science 254:1503-1506 21. Schuman EM, Madison DV (1994) Locally distributed synaptic potentiation in the hippocampus. Science 263532-536 22. Schwartz EL (1994) Computational studies of the spatial architecture of primate visual cortex: Columns, maps and protomaps, in Primary Visual Cortex in Primates, vol 10 of Cerebral Cortex, Peters A, Rocklund K, (Eds.), Plenum Press. 23. Shatz CJ, Lindstrom S, Wiesel TN (1977) The distribution of aferents representing the right and left eyes in the cat's visual cortex. Brain Res 131: 103-116 24. Swindale NV (1980) A model for the ocular dominance stripes. Proc Royal SOC London B:208:243-264Swindale NV (1982) A model for the formation of orientation columns. Proc Royal SOC London B:215:211-230 25. Swindale NV (1992) A model for the coordinated development of columnar systems in primate striate cortex. Biol Cybem 66~217-230 26. Weliky M, Bosking WH, Fitzpatrick D (1996) A systematic map of direction preference in primaty visual cortex. Nature 379:725-728 27. Williams JH, Emngton ML, Li Y-G, Lynch MA, Bliss TVP (1993) The search for retrograde messengers in long-term potentiation. Semin Neurosci 5:149-158 28. Yuille AL, Kolodny JA, Lee CW (1996) Dimension reduction, generalized deformable models and the development of ocularity and orientation. Neural Network 9:309-319
233