EUROGRAPHICS'87, G. Marechal (Editor) Elsevier Science Publishers B.V. (North-Holland) © Eurographics Association, 1987
295
A Metric for Computing Adaptive Detail in Animated Scenes using ObjectOriented Programming. Edwin H. Blake Department of Computer Science, Queen Mary College, London University, Mile End Road, London. El 4NS Tel: 01-980 4811 ext. 3919. Telex: 893750. Email:
[email protected]
A spatial metric for adapting the level of detail in a modelled object to achieve a convincing degree of realism on a display is formulated and illustrated with a simple implementation. This spatial metric is designed to be of most benefit to animations of natural environments. The metric can operate with a wide range of different representations: the essential requirement being that an abstract data structure with hierarchical levels of detail is formulated. Such models are most easily implemented with procedural recursive representations, such as fractals. The actor/message passing approach to modelling animation is adopted as being most appropriate and intuitive when simulating the objects and events of the natural environment. This object-oriented programming method also gives a uniform abstract interface to differing data representations.
A stick figure, which has a non-uniform hierarchical structure, was chosen for the first implementation. This prototype was implemented in Smalltalk which had to be extended to include a part-whole (assembly-subassembly) hierarchy. The need to extend the metric to include temporal (dynamic) trade-offs is discussed. §1. Introduction. Natural scenes are known to be very complex and to have seemingly limitless detail. Animation compounds the problems. In this paper a spatial priority metric is presented that provides a measure of the levels of detail required from each object by a synthetic camera. It allows different hierarchical representations to be used together. A simple application illustrates the operation of the spatial metric. The objectoriented paradigm provides the most appropriate abstraction to describe the elements of the environment and their interactions. Complexity can be controlled by adapting accuracy to the evolving demands of the viewer (§1.1). A review of antecedents ($1.2) to this work is followed by an overview of some relevant hierarchical data structures ($1.3). An object-oriented approach is particularly suited to our problem (§1.4). Observations on the appearance of natural scenes introduce two salient features which will occupy us (§1.5). After distinguishing the spatial and temporal metrics the spatial metric theory is developed and a test of some key aspects is formulated (§2). The prerequisites for implementing the spatial metric ($3) include the need for a part-whole hierarchy. The resulting costs and benefits are analysed ($4). The use of objectoriented programming is briefly criticized in the conclusion, which also summarizes the results and outlines proposed extensions (e.g., a dynamic metric).
1.1. Managing Complexity in Animation. Complexity in 3-D computer animation arises from many sources: the representation of geometric detail, motion, interactions between actors, the user interface, and the complexity inherent in large systems. The problem of hidden surface removal [1] provides a classical example of the various approaches to dealing with complexity in computer graphics. The complexity of hidden surface algorithms operating in object space to arbitrary accuracy depends on the squared complexity of the modelled environment. However, complexity can be reduced by working in image space and using the limits to display resolution, or by a combination of image space methods with object space priority and environmental clustering.
296
E.H. Blake
Flight simulators are exacting in their requirement of both realism and real-time speed. It is a design criterion that observer conviction is required and not physical realism. Therefore approximate rendering is exploited [2]. The importance of the human observer is also recognized in image coding [3] and in computer graphics [e.g.4]. Thus, a thoroughly viewer centered teleology becomes apparent: nothing exists unless it’s for the sake of the viewer. In this spirit we use a metric dependent on display resolution to limit object space complexity. 1.2. The Antecedents to this Study. The rule “Entities are not to be multiplied beyond those required to convince the viewer” is a razor which can remove extraneous detail from shape representations. However, creating a relation between the data structures and the rendering process so that exactly the necessary level of detail is automatically available has been largely an unsolved problem according to Badler & Carlbom [5]*. We shall introduce our solution by briefly examining previous work from this point of view. Clark [6] sets the goal of a single unified structuring of the three-dimensional environment using hierarchical models. The normal object hierarchy is extended to include objects modelled in greater and greater detail. Searches and traversals proceed only down to the smallest resolvable level of detail. Visible surface algorithms can use bounding volumes to achieve logarithmic dependence on complexity. Rubin & Whitted [7] develop a hierarchical representation based on a uniform spatial enumeration for ray traced rendering. In Rubin [8] this is changed to allow geometric transformations between nodes. To prevent scintillation small objects are faded, not clipped, at the resolution limit. The optimum sampling density for ray tracing depends on the scene information content, the display resolution, and the animation frame rate [9]. Using hierarchical bounding volumes to reduce the dependence of the algorithm on environmental complexity has received a great deal of attention [e.g., 10, 11, 12]. Having abstracted from the specifics of representation we require that levels of detail, however stored, be adapted to the needs of the viewer. Our spatial metric, which measures the level of detail needed in any representation, furnishes this general relation. It allows many different models to be used together. 1.3. Hierarchical Representations. Hierarchical data structures afford adaptive detail and allow complex problems to be decomposed by divide-and-conquer. Octrees [13] are a cubical enumeration of space that can represent objects to any resolution and can be projected adaptively [14]. However, hierarchies with more structure are better for modelling. For example, rotating octree encoded objects is difficult and it is better to add distributed local coordinates for each node of the hierarchy to avoid the problem. Procedural representations can be used recursively with structured detail [e.g. 15]. Many other hierarchical representations are suitable for modelling the natural environment and its denizens. For example: Fractals [16] for rough surfaces with statistically similarity at all levels of detail. Generalized cylinder models of people and animals [17] with distributed local coordinates for each part. Procedural branching models [18, 19] of trees and plants. Particle systems [20] for stochastic models of dust, fires; etc. 1.4. The Object-Oriented Paradigm. “Object-orientation”can be used rather loosely in animation to mean just the use of 3-D models. We adopt the more conventional “definition”[21] where object-orientation is some combination of: data abstractions (named interfaces and hidden local state) + object types (or classes) + type inheritance (attributes inherited from superclasses). Processing is done by objects sending and replying to messages. Object-oriented languages are exemplified by Smalltalk [22]. Some established languages have also been given object-oriented features (e.g. C++ [23]). In Hewitt’s actor formalism [24] greater emphasis is placed on concurrency and message passing. * “... methods of building object models with several levels of detail (selected according to the size of its image on the display screen) have been proposed, but automatic generation of such hierarchies requires further research.”
Adaptive Detail Metric
297
Actors in a different guise are met in object-oriented animation systems [25, 26, 27]. Message passing actors have proved to be very appropriate for modelling 3-D animation. Since we wish to use a number of different hierarchies together, the principles of data abstraction are also vital in order to provide a uniform interface. 1.5. The Subjective Appearance of Natural Scenes. Psychologists and artists have investigated human visual experience. Gibson’s observation [28] that the components and events of nature fall into nested, overlapping, levels of detail is very important. This gives rise to the ambient optic array which consists of nested visual solid angles centered at the viewer. The size of the solid angle determines the size of the object in natural perspective. The study of perspective much occupied the Renaissance painters. The term “perspective”included a broad range of effects: projection on a flat plane (artificial perspective), natural perspective (Gibson’s optic array), motion blurring, atmospheric effects, etc. Particularly relevant to our stick-figure implementation is this observation of Leonardo da Vinci [29, p351]: In every figure placed at a great distance you lose first the knowledge of its most minute parts, and preserve to the last that of the larger parts, losing, however, the perception of all their extremities; and they become oval or spherical in shape, and their boundaries are indistinct. §2. Formulating the Priority Metric. It is proposed that hierarchical representations of detail can be related to the requirements of the viewer by means of a priority metric. Defining such a metric and applying it to these representations will be the main result of this research. There are two separate metrics that can be defined in an animated scene. The intuitive notions are: Spatial (static) Priority: Those objects further away from the view point are visually less important to the picture being generated than those closer by. Temporal (dynamic) Priority: Objects moving quickly with respect to the observer need to be redrawn more often than those at relative rest. These simple ideas are extended and mathematically formulated so that they can be applied. The extensions include allowance for atmospheric effects by means of a weighting of the distance. The trade-offs between temporal and spatial resolution in human vision indicate that the two concepts are not completely independent. The static spatial metric measures the extent to which extraneous detail can be dispensed with, or equivalently, the extent to which high spatial frequencies will be attenuated. In a sense spatial filtering is applied directly to object representations. The static priority of an object is proportional to the extent to which ‘interesting’ features are still present after all projection and spatial filtering effects have taken place. For example: during image formation the atmospheric modulation transfer function (MTF) is combined with the eye MTF of the supposed viewer [30]. Finally, allowance is made for any limitations in the imaging apparatus, such as it being a raster display. This is therefore more than the usual anti-aliasing in two ways: (a) anti-aliasing tends to account only for the MTF of the raster display and (b) we want to reduce spatial detail in the 3-D representations and not just in the projected image. 2.1. The Priority Metric and Image Formation. Perspective projection scales the image of an object on the projection plane inversely according to its perpendicular distance from the plane. For small viewing angles this distance is usually close to the actual distance from the Centre of projection. But if the angle is large, unexpected distortions arise. The classic example of this distortion is produced by a colonnade parallel to the plane of projection [Leonardo da Vinci c. 1492, 31]. Columns at increasing distance from the centre of projection, but equidistant from the plane of projection, subtend smaller and smaller angles at the viewer’s eye but produce larger and larger images
298
E.H. Blake
on the projection plane. The priority metric should measure the importance of the object to the viewer and not its size on the image. Geometrically, it is the solid angle subtended at the synthetic camera which is important (§1.5). That solid angle, or equivalently projection on the unit sphere, is dependent on the true Euclidian distance and this distance is used to calculate spatial priority. The priority dependence on distance can also be explicated by considering the spatial frequency domain of the Fourier transform [32]. Let be an object and e(x,y) the observed effective image, let the corresponding Fourier transforms be and According to the previous argument we measure x & y as angular displacements. where is one of the spatial coordinates measured in meters and p is the distance to the image. If then we can approximate x by So:
where p is the distance to the image ing of the Fourier transform with:
The scaling in space produces an equivalent scal-
This shows how the receding figure has its frequency spectrum spread out over a larger and larger width of frequencies. When low-pass filters subsequently process this image less detail will be passed since detail is concentrated in the shifted higher frequencies. Apart from the purely geometrical matter of perspective projection, image formation is the result of convolution. Many low-pass spatial filtering processes in cascade occur in any image formation system. The result of successive convolution is normally to spread a function out: the variance of the convolution of two functions is equal to the sum of the variances of the functions. In fact, as the number of functions convolved together increases indefinitely the result approaches the smooth Gaussian form (Central-limit theorem) provided the transforms are “humped”at the origin. This generally results in the image being smeared out and losing more and more of its interesting features which are in the high spatial frequencies associated with edges. To demonstrate this blurring would require a grey-level display. 2.2. A Test of the Spatial Metric. To test the operation of the metric we used a simple implementation of a stick figure. It has a non-uniform hierarchy of pans making up wholes. The levels represented discrete unequal changes in detail. Stick figures were chosen because they are easily drawn on a display which lacks grey-levels. They are more challenging than many other hierarchical models with respect to the priority metric because the levels of detail are not equally spaced nor are the figures infinitely divisible (as fractal representations are). The intention is to demonstrate the adaptive detail display. The low-pass filters are crudely approximated by choosing not to display features smaller than some threshold. The cutoff was determined by the apparent area of the feature in the image. In frequency terms we cut the image if a characteristic spectral width [32] exceeds a limit derived from our priority metric. If we replace the spectrum of our real (even) images with a box which has the same height as the central ordinate of the spectrum and the same volume, then its width is related inversely to the area of the image, if we assume the image is of uniform brightness. That is, the (two-dimensional) width of the spectrum is:
Adaptive Detail Metric
299
2.3. The Hierarchical Representation of a Human Stick Figure. When viewed at the coarsest resolution or from far away, the human body can be represented by a single upright cylinder [17, 6]. This is actually a simplification that neglects the loss of high spatial frequencies which result in the “cylinder”being rounded (cf. §1.5). At the next level of resolution, when the body is being viewed from somewhat closer by, we have a collection of attached cylinders representing the torso, head, arms and legs. At still closer approach, the hands and feet, fingers, toes, and features of the face would become visible. So to represent the body at each of these distances, successively more complex models are needed. These models can be organized in a hierarchical list (figure 1).
Figure 1. The hierarchy of levels of detail in representing a human figure. Level 0 is an unstructured “blob”, while level 4, which is here represented only by an elaboration of the hand, is much more detailed (based on [17]).
Note that the modelling hierarchy for such a stick figure is very similar. The human body can be modelled as a tree of parts, the root of which is the torso and the parts are the chest, head, upper arm, forearm, hands, thigh, lower leg, foot, etc (figure 2). While this hierarchy is not the same as the visibility list, it is closely related in that parts at lower levels of the tree are also generally smaller. This result applies to large class of living things. They can often be represented by generalized cylinder figures with extremities of ever decreasing size. Marr & Nishihara [17] contains illustrations of a pipecleaner rabbit, giraffe, ostrich and so forth. It can be conjectured that being able to describe the figures in this way is a combination of ontogenesis (artifacts can always have big bits tacked on) and of size (insects do not seem to have such a simple relation between distance from the ‘‘torso”and limb size). 2.4. Using the Priority Metric with a Stick Figure. We shall now examine the way the priority of an object is actually calculated and the way in which the calculated priority interacts with the hierarchical representation in order to vary the detail of the figure to be displayed. The detail hierarchy deviates from the object hierarchy in the treatment of parts which lie at the lowest level of detail which is still visible. Parts thus have two guises: They are internal nodes when there are other, smaller, parts which can still be resolved. When a part is itself the smallest resolvable object in its sub-tree then it is said to assume its leaf appearance. Generally, and by default, the leaf appearance is the same as the internal node appearance, but it can differ. This differing leaf appearance is to allow for the effects of blurred nodes lower in the hierarchy, but it can only accurately be used when there is only one
300
E. H. Blake
Figure 2. The part hierarchy for the stick figure. The boxes contain the name of the part with the class to which it belongs by default in brackets. Only the left foot is fully enumerated. Note the similarity of this component hierarchy to the detail hierarchy of figure 1.
dependent node (unary sub-tree, as with the elbow joint or finger joints), but this is also where it is most needed. The priority (P) of a part is the square-root of the maximal cross-sectional area which its “leaf’appearance can present. In practice the “leaf”appearance is empirically determined and is mostly the same as the internal node appearance. In frequency terms we are assuming that the frequency spectrum is circularly symmetric and its width can be represented by a single number. Each part has a range (R), which is the maximum distance by which its extremes or the ends of its parts can move while it rotates in one place. This is essentially a spherical bound on its position. Distance (d) is measured from the camera and weighted for viewing angle (or magnification m) and display resolution. The rendering algorithm then only descends the hierarchical model up to the level where (object priority + range) becomes less than the magnification x distance. In symbols: if P +R > md then display part. For any particular object the extent to which its complexity drops off with distance depends on its structure.
§3. Salient features of the Data Structures and Algorithms. The choice of Smalltalk for the initial implementation is motivated in §3.1. In order to include an object hierarchy and still retain the spirit of modularity, object-oriented languages should be extended to support part-whole relationships. This is an important point concerning the use of object-oriented languages in graphics, especially those without multiple inheritance (see §3.2). Rotations are the most important transformation when implementing a system of localized coordinates for an animal’s limbs. Hamilton’s quaternions, although rather neglected since the turn of the century [33, “mustymathematics”],make an efficient formalism which is also easy to understand ($3.3).
Adaptive Detail Metric
301
3.1. Why Smalltalk? In an initial implementation like this, one wants to try new ideas out quickly with enough realism to draw conclusions about feasibility. Smalltalk [22] is an object-oriented language that makes a very attractive prototyping tool. A great deal of effort has gone into designing its programmer and user interface. When the application is a graphical simulation there is simply little to beat it. The following are key features of Smalltalk * Graphical user interface. The user interface already provides the basic data types for graphical bitmap display and mouse interaction. * Powerful development tools. Programming in Smalltalk is designed to be an incremental activity. The whole library of existing programs can be examined with ease. Powerful interactive debugging is provided. * Smalltalk is easily modifiable. All system classes (including, for example, the compiler) are accessible and can be modified or, preferably, extended by adding sub-classes. A critical discussion of the benefits derived from object-oriented programming are left to the conclusion. We shall proceed first to give some taste of using an object-oriented language for animation. Smalltalk programming consists in defining data types or classes. 3.1.1. Splitting the Problem into an Hierarchy of Classes. The knowledge required to implement moving figures is factored over a hierarchy of classes. As usual the top level class in our sub-hierarchy is the most general, abstract, and simplest. This is the class “ObjectWithParts” (figure 3); it confers the ability on objects to consist of parts. Subclasses of ObjectWithParts will inherit its message protocol, which is the set of messages it can understand, along with any methods implemented for executing the messages. Processing is carried on by instances of classes, but no instances of this class are created since it is rather abstract.
Figure 3. The subclass hierarchy of the class ObjectWithParts. It contains the classes used to model the stick figure. Contrast this hierarchy with the part hierarchy of figure 2.
The next subclass, “PositionableObject”(also abstract), provides the six degrees of freedom of objects in space: position and orientation. The required transformations are implemented by instances of the class
302
E. H. Blake
“RevoluteJoint”which in turn uses the class “Quaternion”. Any subclass of PositionableObject will be able to implement a modelling hierarchy consisting of subassemblies and transformations. Instances of the subclass “Camera”are used to render other actors. The class “Actor”confers the ability for an object to have a visible appearance but is itself too general to be concrete. The appearance of an Actor depends on the class of object in its appearance ‘slot’ or instance variable. For a stick figure this is an instance of the class “Stick”,but it could be a more complicated appearance. Instances of Stick know how to interact with an instance of Camera for rendering. The subclasses of Actor are the actual parts of a figure. Because a “SimpleActor”is a terminal node in the object hierarchy it has no parts and its inherited capability for parts is disabled. 3.2. Part-Whole Hierarchy. The assembly of whole objects from their parts is common engineering practice, moreover it is implicit in a scientific description of nature. In computer graphics it is appears as the object hierarchy [34], and it forms an essential part of the new 3-D graphics standard PHIGS [35]. Smalltalk does not provide explicit support for the concept of a part-whole hierarchy [36]. A full discussion appears elsewhere [37] as it is not within the scope of this paper, but briefly the dilemma is: (a)
providing controlled access to the parts of an object and not violating the concept of a hidden local state by handing out the parts themselves to other objects. While at the same time (b)
not wishing to flatten and destroy the part-whole hierarchy by explicitly including the message protocol of the parts in the protocol of the whole object.
The language was extended to include compound messages which named both the (route to the) part and the action requested. The action could be a request for information or change of state. The default action on receipt of such a message is simply to forward the action request, unchanged, to the part. However, the message can be intercepted at any of the higher levels in the object and modified or rejected. The sender is notified of the answer to the message (figure 4). Once extended to include a part-whole hierarchy, object-oriented languages, with their simulation (Simula) pedigree, become ideal choices for animation ofnatural environments. This extension offers the following: * Objects are assembled from parts. *
Parts are instances in their own right and can belong to any type.
* *
To instantiate a whole object the types of the parts must be known. On becoming part of a whole an object ceases to be independent. It belongs to the whole’s hidden local state and the interface is mediated by its owner.
3.3. Coordinate Transformations. Each part of the hierarchical representation may have its own changing coordinate system. In animation and rendering these coordinate systems have to be related to one another. A frequent transformation with limbed creatures is rotation at the joints. Quaternions have been used as an efficient calculus for robot arms [e.g.38]. Quaternions consist of a scalar part and a three-dimensional vector part [39, 40]. Those with the same unit vector part are isomorphic to complex numbers. Quaternion multiplication combines scalar and vector multiplication and is non-commutative in general. The famous formula discovered by Hamilton in 1843 shows the scalar result of multiplying the unit vectors:
Quaternions represent rotations in terms of the axis of rotation and the angle about that axis. The effect of applying a quaternion is far easier to visualize than the more common Euler angles. Quaternions represent both the operands (vectors) and operators (rotations and translations) uniformly. Rotations can be combined by multiplying the quaternion representations. Quaternions are more efficient computationally than rotation matrices because they don’t have the same number of redundant terms [41].
Adaptive Detail Metric
303
Figure 4. Accessing the part-whole hierarchy with a compound message. The Person object is assigned to the variable 'joe' and asked to forward messages to its right foot. The request is to replace the orientation Quaternion by one which has been rotated by 40" about a vector along the y-axis. Notice that the familiar multiplication message "*" is also understood by Quaternions.
Quaternions are thus chosen since they are powerful and provide a representation of 3-D rotation which is easy to understand. They are not too general for 3-D transformations and so are computationally efficient. Quaternions provide a uniform representation of operators and operands; a vector can simply be regarded (and implemented) as a quaternion with a zero scalar term. 3.3.1. Adding Quaternions to Smalltalk. The inherent polymorphism of messages (or overloading of operators) in Smalltalk allows easy and elegant implementation. The normal arithmetic messages can be implemented for quaternions; combined with a few coercion messages that is really all that is required to add quaternions as a subclass of numbers (figure 4 shows multiplication). Quaternions then become fully integrated in an extended system-wide concept of Number. A minor complication is having to represent translation and rotation as separate transformations. For greater efficiency, unit quaternions, which are used for rotation transformations, may need special treatment. This is quite easy in Smalltalk and is transparent to the user. It is analogous to the way small integers are treated in the standard system,
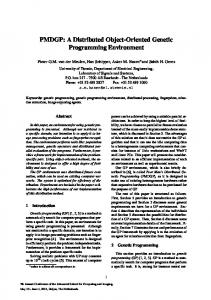
§4. Results from Running the Experimental Implementation. The effects of the spatial priority metric are illustrated by the sequence of stick figures (5a - 5d). The camera is flying in to the right hand. The effects of the priority metric have been exaggerated in order make its operation visible. The persistence of a feature can be seen to depend on both its length and its width. For the human figure used in the experiment the choice of priorities resulted in the number of parts dropping off more or less with the square root of the distance, for those distances over which the figure was visible. Coordinate system hierarchies were used; each part of the figure being described in its own local coordinate system. Such a part and all its dependent parts is moved by changing its coordinate transformation. The hierarchy has a considerably richer structure than octree hierarchies, and motion was easily modelled.
304
E. H. Blake
Figure 5. Four snapshots taken at unequal intervals by a camera flying in to the right hand. The effects of the spatial detail metric have been exaggerated to show how new levels of detail are added; in this case the spindly fingers. The little finger appears last.
We greatly simplified spatial frequency effects and used a simple rendering algorithm on a bit-mapped display. The scenes are animated but dynamic effects on the visual importance of detail were neglected. That is, only a spatial metric was applied. 4.1. Computational Benefits. The depth complexity of natural scenes can be very large: on average an ‘X-ray’ from the viewer to the horizon will pierce many more potentially visible surfaces than the two or three surfaces in artificial scenes [1]. The terms normally used to analyse rendering complexity, such as number of faces in the environment and average face height, do not apply because we have tried to capture the nested complexity of nature in the hierarchical models. We shall assume in this analysis that the environment is isotropic, that is, objects are uniformly distributed on the two-dimensional surface of the Earth with density K. Therefore the depth complexity of views which are not too vertical is independent of viewing direction. Consider those objects in the simulated environment which lie beyond the furthest limit of resolution, they need only be considered as unstructured “blobs”. The range, R, will ensure that this condition is satisfied for all internal configurations of the objects. Then for average R and priority, P, the average limit of resolution is d = R + P (see §2.4). The area contained within the resolution limit is proportional to d² and so only K (P+R )² non trivial objects need be examined in any greater detail. Rendering complexity is decoupled from the total number of objects and depends on the density of objects, K. Within the resolution limit the priority metric attempts to remove all sub-pixel sized parts from consideration. The object therefore cannot consist of many more parts than the number of pixels it covers. The complexity of the rendered scene depends on the resolution of the display which can now be adjusted to suit viewing conditions. We reduce the number of (parts of) objects to be examined in clipping and rendering, two very substantial costs when realism is sought. The principal computational benefit is to limit the extent to which the complexity of the rendering problem depends on the complexity of the environment. Detail in an object depends on its distance from the synthetic camera, weighted for screen resolution etc. The second substantial benefit isthat a uniform metric allows different forms of hierarchical models to be integrated in an animated environment. It is an essential component in providing a uniform interface between the synthetic cameras and object representations.
Adaptive Detail Metric
305
4.2. Costs. The major cost, apart from setting up the hierarchy, is associated with calculating the metric. Instead of just the distance along the axis of projection, the Euclidian distance to the part must be found, and the priority comparison made. However, the three squares and square root calculation is far less expensive than any but the simplest of rendering options. We do not give relative timings here because our rendering was the simplest imaginable. The complexity arguments given above are convincing enough to indicate the promise of the approach. The cost of setting up the hierarchy has two aspects: the amount of effort required by the modeller and the effort required from the machine, In animation the effort from the machine is insignificant because the benefits will be accrued frame after frame. We are then left with the effort required from the modeller. The resolution hierarchy can readily be superimposed on the modelling hierarchy which is already required. Therefore the additional effort by the modeller is small. The only exception arises when parts on the modelling hierarchy have only one dependant with no decrease in size, The two levels must then be essentially one object as far as the display hierarchy is concerned. For example, the arm is modelled as two parts which drop in and out of visibility together. The cost during the running of the system is the calculation of the distance and the check against priority. This is small compared to the cost of 3-D shaded rendering. Setting up the detail hierarchy for many living things is not much more complicated than producing the normal object hierarchy which is required in any case. §5. Conclusion. We have investigated methods to use in building representations for animating complex environments such as those found in nature. In this paper an approach to modelling was presented and implemented which: l can cope with the rich spatial detail of natural scenes. l is computationally efficient. l is appropriate to modelling animated objects. The experimental implementation showed that a metric can be used with stick figures on a bit mapped display. Computational costs seemed minimal on the basis of complexity arguments and the benefits grow according to the complexity ofthe environments. 5.1. Experience with Object-Oriented Languages & Smalltalk. The need to extend object-oriented languages to include a part-whole hierarchy was uncovered. Once this is added, the encapsulation of data and procedures in one object provides an appropriate formalism for representing both animated objects and static procedural models of terrain. The inherent polymorphism of the message passing approach allows many different hierarchical data structures to be used together and allowed the uncomplicated introduction of a new kind of number, the quaternion. Inheritance assists the definition of classes which share a message protocol. Lastly, the structured modularization of classes create an ideal tool for writing large complex systems. Depending on the implementation, Smalltalk itself can be slow and it does use a bit-mapped display. It also has a significant learning curve. But it provides a complete environment that enables fast development work. This can be of overwhelming benefit. The climb up the learning curve is required just so that the programmer can discover all the work that needn’t be done! The ease of online debugging and the fact that modules need no linking amply repay the slow execution. On the Tektronix 4404 (68010 chip) the Smalltalk implementation is quite fast. Rotating the stick figure and rendering it takes a few seconds per frame. Doing a 30 frame sequence is just about bearable. Another significant restriction is the 16 bit object table, which limits the total number of objects: our present application stretched the system to its limit. Anything more complex would need one of the faster, 32 bit versions of Smalltalk. Less certain benefits include the ease with which Smalltalk can be extended. Changing the syntax is easy because of the accessibility and modularity of the system.
306
E. H. Blake
Message passing in Smalltalk does not implement cooperating sequential processes. However, fac handle independent processes are included and will be useful if the dynamic scheduling of tasks becomes possible via the proposed dynamic metric. 5.2. Future Work. This was a preliminary investigation. In order to get more realistic demonstrations of the costs and benefits more sophisticated rendering techniques have to be used. Showing the effects of atmospheric haze and using other hierarchical representations (such as fractals) require shaded 3-D graphics. On such a display psychophysical measurements can show the visual acceptability ofthe adaptive detail display. The investment in preparing the data structures used by the spatial or static metric is justified by the fact that animated graphics reuses the same data frame after frame. But further exploitation of animation is expected from the temporal metric. The temporal metric is intended to make full use of the trade-offs inherent in the dynamic nature of animation. Fast moving objects can be rendered with less detail and the frame-to-frame coherence of animated scenes can be used to reduce the frequency with which moving objects have to be updated. Work is now underway with shaded colour graphics using the language C++, and a fast 32 bit Smalltalk. Acknowledgments My thanks for tireless encouragement and assistance throughout the preparation ofthis work to my supervisor Dr. Hilary Buxton, and to Mr. Mel Slater for his close reading and helpful criticisms. References [1] [2] [3] [4] [5] [6] [7] [8] [9] [10] [11] [12] [13] [14] [15] [16]
Sutherland, I.E., Sproull, R.F. & Schumacker, R.A. (1974) Computing Surveys 6,1 1-55. “Acharacterization of ten hidden-surface algorithms.” Schachter, B.J. (1981) IEEE Computer Graphics and Applications 1.5 29-68. “Computerimage generation for flight simulation.” Pearson, D.E. (1975) Transmission and Display ofPictorial Information. Pentech Press. London. Myers, W. (1980) Computer. 13 49-58. “Computergraphics: A two-way street.” Badler, N.I. & Carlbom, I. (1984) Eurographics ’84 185-200. “Thecomputer graphics scene in the US.” Clark, J.H. (1976) Comm. ACM 19 547-554. “Hierarchicalgeometric models for visible surface algorithms.” Rubin, S.M. & Whitted, T. (1980) SIGGRAPH’80: Computer Graphics 14,3 110-116. “A 3dimensional representation for fast rendering of complex scenes.” Rubin, S.M. (1982) Computer Graphics and Image Processing 19 291-298. “The representation and display of scenes with a wide range of detail.” Cook,R.L. (1986) ACM Trans. Graphics 5 51-72. “Stochasticsampling in computer graphics.” Fujimoto, A., Tanaka, T. & Iwata, K. (1986) IEEE Computer Graphics and Applications 6,4 1626. “ARTS: accelerated ray-tracing system.” Jansen, F.W. (1986) in :Data Structures for Raster Graphics. L.R.A. Kessener, Peter, F.J. & van Lierop, M.L.P. (eds) Spinger-Verlag, Berlin. pp. 57-73. “Data structures for ray tracing.” Weghorst, H., Hooper, G. & Greenberg, D.P. (1984) ACM Trans. Graphics 3 52-69. “Improved computational methods for ray tracing.” Meagher, D. (1982) Cornpurer Graphics & Image Processing 19 129-149. “Geometricmodelling using octree encoding.” Sandor, J. (1985) Computers & Graphics 9 393-405. “Octree data structures and perspective imagery.” Perlin, K. (1985) SIGGRAPH’85: Computer graphics 19,3 287-296. “Animage synthesizer.” Mandelbrot, B.B. (1982) Thefractal geometry ofnature. Freeman.
Adaptive Detail Metric
307
[17] Marr, D. & Nishihara, H.K. (1978) Proc.R.Soc.Lond. B 200 269-294. “Representationand recognition of the spatial organization of three-dimensional shapes.” [18] Aono, M. & Kunii, T.L. (1984) IEEE Computer Graphics and Applications 4,5 10-34. “Botanical tree image generation.” [19] Smith, A.R. (1984) SIGGRAPH’84: Computer Graphics 18,3 1-10, “Plants,fractals, and formal languages.” [20] Reeves, W.T. (1983) SIGGRAPH’83 Computer Graphics 17,3 359-376. “Particle systems - A technique for modelling a class of fuzzy objects.’’ [21] Rensch, T. (1982) SIGPLAN notices 17 51-57. “Objectoriented programming.” [22] Goldberg, A. & Robson, D. (1983) Smalltalk-80: the language and its implementation. AddisonWesley. Reading,Massachusetts. [23] Stroustrup, B. (1986) SIGPLAN Notices 21,10 7-18. “AnOverview of C++.” [24] Agha, G. (1986) SIGPLAN Notices 21,10 58-67. “Anoverview of actor languages.” [25] Kahn, K.M. (1976) ACM/SIGGRAPH workshop: User oriented design ofinteractive graphics systems. October 1976. Pittsburgh. 37-43. “Anactor-based computer animation language.” [26] Reynolds, C.W. (1982) SIGGRAPH’82: Computer Graphics 16,3 289-296. “Computeranimation with scripts and actors.” [27] Magnenat-Thalmann, N. & Thalmann, D. (1985) Computer Animation: Theory and Practice. Springer-Verlag. Tokyo. [28] Gibson, J.J. (1979) The Ecological Approach to Visual Perception. Houghton Mifflin co. Boston. [29] MacCurdy,E. (1954) The Notebooks ofLeonardo da Vinci. Vol. II. The Reprint Society, London. [30] Kaufman, Y.J. (1981) Applied Optics 20 1525-1531. “Combined eye-atmosphere visibility model.” [31] Ackerman, J.S. (1978) Journal of the Warburg and Courtauld Institutes 41 pp. 108-146 & plates 16-17. “Leonardo’seye.” [32] Bracewell, R.N. (1978) The Fourier Transform and Its Applications (2nd edition). McGraw-Hill, New York. [33] Goldstein, H. (1980) Classical Mechanics. (2nd ed.) Addison-Wesley. Reading, Ma. [34] Foley, J.D. & van Dam, A. (1982) Fundamentals of Interactive Computer Graphics. AddisonWesley. Reading, Massachusetts. [35] PHIGS (1986) Programmer’s Hierarchical Interactive Graphics System. ISO PHIGS revised working draft, 13 June 1986. [36] Borning, A.H. (1981) ACM trans. Programming Languages and Systems 3,4 353-387. “Theprogramming language aspects of ThingLab, a constraint-oriented simulation laboratory.” [37] Blake, E.H. & Cook,S. (1987) European Conference ofObject Oriented Programming, Paris, June 15-17, 1987. Springer. “Onincluding part hierarchies in Object-Oriented languages, with an implementation in Smalltalk.” [38] Brady, M. (1982) in :RobotMotion: Planning and Control. Brady, M., Hollerbach, J.M., Johnson, T.L., Lozano-Perez, T. & Mason, M.T. (eds ) The MIT Press, Cambridge, Massachusetts. 221-243. “Trajectory Planning.” [39] Hamilton, W.R. (1969) Elements of Quaternions. Vol.1. (3rd edition). Chelsea Publishing Co., New York. [40] Pervin, E. & Webb, J.A. (1982) Carnegie-Mellon Univ. Research Report CMU-CS-82-150. “Quaternionsin computer vision and robotics.’’ [41] Shoemake, K. (1985) SIGGRAPH’85: Computer Graphics 19,3 245-254. “Animating rotation with quaternion curves.”