Journal of Theoretical and Applied Information Technology 31st August 2017. Vol.95. No.16 © 2005 - Ongoing JATIT & LLS
ISSN: 1992-8645
www.jatit.org
E-ISSN: 1817-3195
PAPER SURVEY AND EXAMPLE OF COLLABORATIVE FILTERING IMPLEMENTATION IN RECOMMENDER SYSTEM 1,2
1
HANAFI, 3NANNA SURYANA, 4ABDUL SAMAD BIN HASAN BASHARI Departerment of Information Technology, University of AMIKOM Yogyakarta, Yogyakart, Indonesia 2,3,4 Faculty of Information and Communication Technology, Universiti Teknikal Malaysia Melaka, Melaka, Malaysia E-mail addresse :
[email protected] ,
[email protected],
[email protected] ABSTRACT
The development of recommender system research has expanded to various applications. Recommender system issues can be analyzed from many perspectives such as user rating strategy, user preferences and text mining. User rating strategy and user preferences are associated with user behavior to find suitable recommended items. Text mining is considered the most related field to database management and web search queries. The relation to the database query, it needs suitable query algorithm web search and user profiling strategy. Our paper survey showed that Latent Semantic Analysis (LSA) method has a better chance to solve recommender system issues especially in web search and user profiling. By comparing with restaurant samples, we describe adequate measures to evaluate the recommender system quality in user profiling. Some algorithm can provide benefits to improve the quality of personalized recommendations that are tailored to user attributes. Further research can provide newer algorithm to handle cold start problem and sparse data from both text mining and mining computation perspectives. Keywords: Latent Semantic Analysis, Restaurant, food menu Recommendation, Semantics, User Behavior. cross similarity among users with rated items. In addition, it applied heuristic methods to combine the user-rated items to reflect active users preferences. Such methods have improved the system performance into higher accuracy [6]. As the development of recommender research is very large, we generalize recommender system studies and their results into systematic literature review with adaptability to their applications. Scholars have identified how to improve recommender system performance by analyzing the user -items attributes and their relationships based on the history of activity between users and items. The system recorded the user activity as history or behavior pattern. In addition, the system also has feature to support the user to provide rating to recommend preferred items to other active user [7]. This approach required item attribute value with valid source from active users. A failure to get the valid sources will lead to Cold Start problems due to lack of valid information about products attributes in the database [8]. Another problem in the system is large range of value ranges between the first rated product with the last rated product which raised diversity of item values in the product listing. It scrambles the users preferences toward suitable items and provide mismatch recommendation with the user
1. INTRODUCTION Recommender systems are prominent machine learning applications that have been widely studied anywhere [1]. Recommender system provide feature to active user g to recommend rated items to other users [2]. The systems facilitated the users to filter large amounts of data and make informed choices. However, recommender systems still contains many issues especially in their accuracy and predictability. To improve accuracy, many scholars have proposed algorithms such as collaborative filtering, hybrid, and content based algorithms. To handle predictability, they expanded the research focus of recommender system into various innovative usage from context-aware to latent information synthesis. it encouraging researchers to expand to business and education applications [3]. In addition, in handling text mining issue, many scholars have included data of user activities and social content sharing (e.g., user behavior, user trust network, random walk, and k-means top rating) [4]. From a collaborative perspective, traditional collaborative screening approaches are very popular for predicting user preferences and product recommendations [5]. It calculated 4001
Journal of Theoretical and Applied Information Technology 31st August 2017. Vol.95. No.16 © 2005 - Ongoing JATIT & LLS
ISSN: 1992-8645
www.jatit.org
E-ISSN: 1817-3195
1990s. Currently, machine learning are used in several fields such as computer science[9], business [11], advertising [12] and medicine [13]. 2.2. Type of machine learning Learning is the process of acquiring knowledge. Humans naturally learn from experience and remembering to shape their ability to reason. Conversely, computers do not learn by reasoning, but learn by algorithm and code programming. Currently, there are a large number of machine learning algorithms in literature. They can be classified based on the approach used for the learning process. There are four main classifications, e.g., supervised [9], unsupervised [14], semi- supervised [15] and reinforced machine learning [16]. 2.2.1. Controlled learning Controlled learning is a process of training to provide machine with training data, correct answers and certain classification rule [17]. It is also so-called classification machine. The classification machine has task to learn based on the training data and testing data and then gaining real data for analysis and recommendation, i.e., book classification in bookstores. A training set contains training data and answer as a listed items of books to classify each book into correct groups. Here, the information or attributes about each book may be a title, author, publisher or even text in the book content [16]. The machine learns and tested with the training set to detect and record the item history automatically. When a new book arrives at a bookstore, the machine can classify the books (items) based on the classification algorithm.
attributes. Such issue is so-called long tail phenomenon. This is due to the large concentration of users which focus only on popular items while less popular items are lack of user attention. It impact on the system to display the item. Finally, user has no choice to get the information from majority of users and rating from other active users. 1.2. Paper contribution The purpose of this paper is to find a strategy ranking users and user preferences associated with user behavior to find the recommended items using LSA algorithm. This study attempts to prove that the use of the LSA Algorithm and the cosine resemblance approach and its modifications can identify features related to the product. This paper summarized the various recommender system studies especially from the problems and solutions that scholars have examined and resolved. It also summarized algorithms with robust performance and interesting to be studied further to improve their accuracy and effectiveness. Finally, this paper provided example of case study for the future direction to focus on the problems encountered with scholars in improving the recommender accuracy. This paper consisted five parts. the first part proposed trend of recommender system topic. The second part provided definition and development of recommender system studies. The third section explained robust algorithms, methodologies and implementation. We also give an example of the implementation in simple problem, e.g., to measure the rating in restaurant recommendation. The Section four discussed conclusions and our short analysis. The fifth part contains suggestion and future direction.
2.2.2. Supervised learning Supervised Learning has main characteristic, e.g., the training data is accompanied by learning targets sets representing input vector and target dataset [9]. The machine learning with the a model can meet required target of learning for specific purposes, e.g., classification, regression, ordinal regression, and rating.
2. LITERATURE REVIEW 2.1. Machine Learning Machine Learning is a virtual machine which contains learning algorithm and allows computers to identify and gain real-world knowledge from the users [9]. Through machine learning, the system can work some tasks based on the training and testing datasets. More formally, Schnabel, et al., [10] stated that machine learning has ability to learn from user experience and human behavior if suitable algorithm is added. Although machine learning originally has been introduced in the 1950s, the revised concept has studied as a separate field till
2.2.3.Unsupervised Learning In the unsupervised learning, the training data is not accompanied by target dataset. It has objective to build a model that can find hidden variables or components in the training data [14]. The characteristic of unsupervised learning can be used for unique 4002
Journal of Theoretical and Applied Information Technology 31st August 2017. Vol.95. No.16 © 2005 - Ongoing JATIT & LLS
ISSN: 1992-8645
www.jatit.org
E-ISSN: 1817-3195
provide input to data progression as reference and improve learning algorithm automatically. 2.2.6. Transfer Learning The purpose of transfer learning machine is to simplify the learning process on customized problem to be used for other problems. It used training data which not accompanied by learning targets to reshape new structured model to find real-time data. The model can be combined with feature extraction and topical modeling. The machine also have ability to separate the algorithm into categories based on clear classification and reduce the data variations based of established algorithms, e.g. incremental vectors and matrix factorization.
purposes such as density estimation, clustering, dimensionality reduction, Topical content extraction, and random recommendation. 2.2.4. Semi-supervised Learning Combination of supervised and unsupervised approaches have brought new model of learning machine. It needed adequate modified training data to reach target dataset for each input vector [17]. Semi-supervised learning machine have main component. 2.2.5. Reinforced Learning The learning objective is how the machine act based on the input from the environment. The machine can observe their environment based on some validated parameters to monitor dataset progression [16]. Each action
Table 1.Summary of machine learning research on for recommender systems Methods Advantages Disadvantages CollabNet, a new CollabNet's recommendation is CollabNet scalability is still algorithm used gradient based on datasets evaluation of limited to big database. slopes to study relative commercial products by using contribution of active users online social networks algorithm. It to rate similar items into showed higher performance above item list. It provided standard recommender system summary of algorithms. recommendations generated by the recommender system. Salakhutdinov, Restricted Boltzmann The study provide a tabular data It used Maximum Margin et al., (2007) Machines model, such as a user's movie Matrix Factorization to handle (RBM’s). rating. barrier to cover overall strength factor rather than their number. It required splitting of a rare semi-definite dataset to evaluate system performance. Veena & Babu Apache mahout. It handled challenges in Some algorithms that cannot (2015) recommender system based of be parallelized over stochastic collaborative filtering such as issues. scalability and sparsity data. Wang (2015) Bayesian. It carry out in-depth representation collaborative content and learning for collaborative content filtering information needs and filtering information for the more customized deep learning assessment matrix. model. Tewari et al., Matrix Factorization The method provided good The nature of scaling has not (2013) method approximate analysis solution for been studied. posterior data distribution.
References Cai et al., (2010)
filtering activities based on similarity of consumer characteristics and product attributes to provide new information to users [19]. The user and/or item lists are filtered by system to provide information based on the likeness pattern of user group. The differences of interest in
3. Collaborative Filtering Collaborative filtering is the newer mode of recommender system that process the data with filtering approach [18]. It also evaluated items through active user evaluation about other user opinions to gain attribute value rating [16]. Collaborative filtering performs 4003
Journal of Theoretical and Applied Information Technology 31st August 2017. Vol.95. No.16 © 2005 - Ongoing JATIT & LLS
ISSN: 1992-8645
www.jatit.org
group members are classified into new category that may be beneficial to other group members. Generally, the recommendation process consisted three steps, eg, finding similar user, making neighborhood, and counting prediction based on selected neighbors [20]. Collaborative filtering generated item predictions or item recommendations for targeted users after the items has rating value. Items consisted of interesting topics or thing such as books, films, arts, articles, or travel destinations. Ratings consisted of (a) scalar numerical value of integer; (b) binary value of bolean, agreeing or disagreeing, good or bad; (c) unary value indicated user history activity that the user has observed or purchased items or rated items [20]. Unary value can be combined with binary value to provide user rating of positive or negative about product item rating value. The availability of rating values indicated information connecting the user with the preferred items. Ratings can be collected explicitly, implicitly, or a combination between explicit and implicit. The explicit rating is obtained when the user is asked to provide an opinion on a particular item. implicit rating is earned through the user intention. The unavailability of rating values will lead to the items are not recognized by machine learning and not displayed to users even though the product is existed in the database system.
neighbors algorithm. The algorithm is divided into two classes, eg, user-based and item-based approaches. Both algorithms are discussed below. 4.1. User-Based Collaborative Filtering The user-based nearest neighbor algorithm used statistical techniques to find a set of users or neighbors and sorted based of their unique attribute weighting values. The neighbors attribute weighting values must have historically agreed with the targeted users. Once a group of neighbors are formed, the system uses different algorithms to combine the neighbors' preferences lists to produce the N-top predictions or a group of item recommendations for active users [23]. Practically, users with highest purchase value is then become focus of attention that system will provide more facility and supports [24]. This method arises as a solution to problem of limitations (sparsity) and scalability and time and memory issues. 4.2. Item-based Collaborative Filtering item-based collaborative filtering are quite like item-based collaborative filtering. Instead of calculating the similarity between two users, the system focused on the similarity between two items [25]. The system used computational similarity method between two items and find predicted items by counting the weighted sums of different item ratings on individual users. Item-based collaborative filtering contains recommendation algorithm based on similarity relationship between rated items and purchased items. From the level of item similarity, then they are divided by parameters of user needs to obtain product usability value. It is also so-called Item-to-Item Collaborative Filtering [26].
4. COLLABORATIVE FILTERING AND LATENT SEMANTIC ANALYSIS Collaborative filtering has been proposed by many scholars{21]. They divides collaborative filtering algorithms into two different classes according to theoritical and practical aspects, eg, non-probabilistic and probabilistic algorithms. For probabilistic algorithm, it represented probability distribution to calculate rating prediction of items i and v to provide recommended rating list. It used equation 1[22]. ∑ ,
, ∗
∑
, ,
E-ISSN: 1817-3195
4.3. Cosine-based Similarity Cosine-based similarity worked on the concept of statistical cosine where two items are considered as two vectors in the dimension m user space [27]. The similarity between them is measured by calculating the cosine angle between two vectors. For item list, the similarity between item i and j will form new direction and
…………..(1)
Total sum of v and i represent the rating prediction (r) and calculated by scramble rating value to get latent rating value. For nonprobabilistic algorithm, it represented random distribution to calculate scrambled rating prediction and provide latent rating results. The famous non-probabilistic algorithm is the nearest 4004
Journal of Theoretical and Applied Information Technology 31st August 2017. Vol.95. No.16 © 2005 - Ongoing JATIT & LLS
ISSN: 1992-8645
www.jatit.org
distance between the groups as represented by equation 2. .
cos .
,
| | ∗ | |
Collaborative filtering has privacy issues and cold-start issues which are associated with a lack of appraisal for either new users or new items [21]. On the other hand, content-based recommendation systems tend to be too specific and require wide array of content in order to fulfill the user needs. However, there are better developments with scholars suggesting recommendations based on user participation approach to mend the weakness. In addition, some system are upgradable to provide better recommendation result. scholars have proposed other approach such as knowledge-based recommendations and latent attribute analysis. They required knowledge techniques and expert system in order to overcome the “knowledge bottleneck” issue in collecting user activity data and user profiles [30]. Scholars have proposed new model to handle both issues by integrating social media database to build online social user profiling and analyze the user contextual information. The system is also so-called context-aware system which connecting user and product items with a list of predicted recommendations to understand trends and user situation. Thus, the contextual relationship is associated with mathematical and statistic activity. The contextual relationship has an advantage to handle the sparse data information since it extracted and summarized meaning of the word applied by user to a particular text section[31]. It helps the system to perform information retrieval, content analysis and semantic strategy. Such semanticization derived models and predict the user activity patterns and their preferred items[32]. Such semanticization with latent content has brought new insight to the development of modified recommender system. This brings scholars to try a new technique called Latent Semantic Analysis (LSA). 5.1. Latent Semantic Analysis (LSA) Latent Semantic Analysis (LSA) has been proposed by many scholars[33]. The approach has been widely used for deducing semantic information from social user tag database. LSA reduces issues of using social
… (2)
4.4. Correlation-based Similarity Correlation has been used widely in statistical term. It used similarity between two items which measured by calculating correlation of the set of users who rated the set of items. The correlation represented by similarity between item i and j and also the rating values owned by each union (U) which composed by u, i and j. the similarity between I and j is given in equation 3 [28]. , ∑ ∈ ∑ ∈
,
,
………….(3)
∑ ∈
,
,
4.5. Adjusted Cosine Similarity The computation of similarity with basic cosine need huge size of data which sometimes difficult for small dataset size. this case has one obvious drawback, and this needs modification for scoring scale among different users with small dataset size. The issue are then resolved with Adjusted Cosine Similarity approach as proposed by Chen [29]. The similarity approach which using this scheme has a goal to spread the value between items with the level of small rating distribution. The Adjusted Cosine Similarity algorithm can modify the value of similarity between items. In addition, the algorithm also can estimated the frequent change of items and user relationship. It predicted similarities by forming an offline similarity model that automatically saves time and memory for counting when a user accesses a list of items. The popular similarity model which implemented in recommender systems is given in equation 4. , ∑ ∈ ∑ ∈
,
,
,
∑ ∈
……….(4) ,
E-ISSN: 1817-3195
5. Weakness of conventional recommendation system All recommendation systems have certain limitation in the way they operate. 4005
Journal of Theoretical and Applied Information Technology 31st August 2017. Vol.95. No.16 © 2005 - Ongoing JATIT & LLS
ISSN: 1992-8645
www.jatit.org
tags, such as, synonyms, user errors, data scarcity. It increased search result and prediction robustness in large data collections [34]. the prediction robustness is main charactistic of value decomposition especially in multiple matrix analysis. , ∗∑ , ∗ , ………………(4) It is estimated based of matrix computation and prediction. For example, D and T are two orthogonal matrices and R is rating which must be minimum to establish matrix rank M. ∑ , is the diagonal matrix which formed by diagonal entries contain all the single values stored in descending order. The matrix D and T are the left and right single vectors. To get nth rank of D and T, we can modify LSA to keep only single value labelled k and its associated vectors M is the rank-k approach of M. , ∗∑ , ∗ , ……………(5) M is used in LSA to represent semantic space. k is the number of potential vector in the LSA space representing a set of latent variables. This potential vector represented latent value with certain correlation rule in sparse data matrix. Furthermore, the generated latent variable(s) representing targeted groups with highly correlated relation, it must still represent original data value. It potentially has an advantage to reduce the amount of noise associated with the irregular relationship and random semantic information. 5.2 Estimation of user-item relationship To get weighting tags or labels of product lists, we use frequency of display as weighting term. The weighting approach provide information about the frequency of users to select or prefer item tags and to assign weight values to each items in certain groups so that a priority tag can be established as calculated list. It represented the frequency of occurrence of items and their attributes based of appearance of each item on their lists. Such frequency-based weighting tags is also so-called tokenization as effort of filtering headword from the contents of user history. Therefore, the total frequency of occurrence of items and their attributes are selected to shape the user-item relationship which given in equation 6.
E-ISSN: 1817-3195
log
1 ………(6)
The equation showed that weighting is influenced by N, n and R as the total of all rating, total user giving rating nth and weight to the nth item based of the user preferences or the item position in the prediction. For big database, it can be modified by clustering approach in form of Log (N/n). Therefore, it gives clustering of frequency log
1.
5.3. Singular Value Decomposition (SVD) One of the modified LSA is Singular Value Decomposition (SVD) to perform matrix decomposition. SVD decomposes matrix of frequency with multiple matrices member into three matrices D, Σ and T to represent product feature terms. SVD analyzed the relationship between a set of values as a series of users and items which shape discrete dyadic domains called two-mode data [35]. Supposed that a series of users have rated a group of items, and then the system can create a coordinate matrix M. Each relationship of a user with an item is represented by a row vector, while each term of ranking or degree between first and second user is shown using a column vector. The relationship represent a single-value decomposition (SVD) to an M-dimensioned user-item matrix, and an estimate of low-level matrix M can be used to define a SVD pattern in relationship of active user and their preferred item. Both user group and item group can be divided into subgroups representing their respective product classification. For example, item group can be divided into two matrices of U and V. ∑ ………………(7) Where U and V are matrices with orthonormal columns represented rated item and unrated item. To find their intersection (eg, ), it applied Σ as a diagonal matrix whose diagonal element is the accumulation area containing average or clustered value of both U and V. in total, the general pseudocode for LSA is given in Algorithm 1. The algorithm is modified from [12]. input: item-user matrix , Product 4006
Journal of Theoretical and Applied Information Technology 31st August 2017. Vol.95. No.16 © 2005 - Ongoing JATIT & LLS
ISSN: 1992-8645
output:
www.jatit.org
E-ISSN: 1817-3195
S(s) ←ranked user-item relationship list end return S end
feature set S, number of ranked single value, number of extracted attributes for each item-user relationship n. array Σ containing product classification, average clustered value of U and V as related item-user relationships.
The algorithm works by initializing a list with equation to measure the column vector w of M and sorting the related feature lists to get top nth rank related features from the
begin initialize associated array Σ ← Average , , ∑, ← ∑ for s ∈ S do ←Matrix , weighting s Initialize similarity list sim ←1 foreach column vector of do sim[i]← . ← 1 end sort(sim) relatedFeatureList←top nth rank(sim, n, M)
similarity of of . To strengthen the search results, the semantic comparisons with the SVD method can be combined with certain statistical computation to find the closest relationship of both groups into search query. The search results will be matched with standardized training data. This is done to bring up closest unrated items that have a similar position but still lack of rating value and user preferences.
Table 2.Summary Of Existing Research On Collaborative Filtering With Latent Semantic Analysis Method
References Liu et al., (2012)
Methods Latent Semantic Analysis (LSA) to identify product features in movie items.
Advantages Movie reviews are generated from featurebased summarization. Rating systems and review-summarization can be extended to other product review domains easily.
Hyung et al., (2012)
Latent Semantic Analysis (LSA).
Ticha, et al., (2014)
Hybridization of User Semantic and Collaborative Filtering used the Rocchio algorithm. Latent Semantic Analysis
A new approach to recommending music based on text analysis, identifying the semantic meaning of the document to find similar stories. The approach provides solutions to scalability issues, and reduces the problem of sparsity data by reducing data dimensions. The approach has ability to recommend the community to foreign member without joining the community. It has advantage of dimensional reductions to reduce the limitations associated with the spectrum.
Akther (2012)
4007
Disadvantages Currently, feature-based summarization provides result of summarized text. Although the summary phrase is about product features and opinion words, these sentences are derived from various movie paragraphs or reviews to reduce the problem. Thus, this is a challenge of future work to achieve a better eloquence of summarization. One of the most important limits in the study is biasing when it detected polysemies. Polysemies are words that have many meanings. It only used content-based approach.
It excluded recommend item or user.
Journal of Theoretical and Applied Information Technology 31st August 2017. Vol.95. No.16 © 2005 - Ongoing JATIT & LLS
ISSN: 1992-8645
www.jatit.org
E-ISSN: 1817-3195
restaurant. It implemented LSA and database of user purchase history for food menu as illustrated by the table below. The number of restaurant menus are attributed to each restaurant, the system will learn that a user has certain preferences.
4. RESULT AND DISCUSSION 4.1. Example of Latent Semantic Analysis Case We provide example of latent semanticization process that the system will learn to estimate the user preferences in
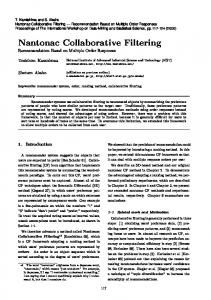
Source: http://tripadvisor.co.id 10. Table 3. Restaurant Ratings Based On Number Of Menus Ordered
Ranking
Restaurant Name
Total
1. 2. 3.
ViaVia Jejamuran Mediterranea Restaurant
1429 1285 836
4. 5.
Milas Nanamia Pizzeria Mozes
560 547
6.
Verandah Alfresco
518
7.
Roaster and Bear
266
8. 9.
The Sawah Nanamia Pizzeria Tirtodipuran
189 159
Canting Restaurant
152
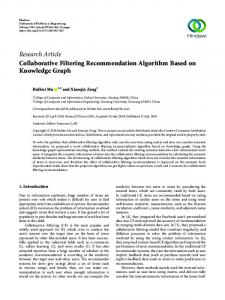
Source: http://tripadvisor.co.id Table 3 described how the user rated menu which they like from various restaurants. The table will sort this user preference toward varied menus and various restaurants. It established rating parameters for both menus and restaurants while a search query is performed. Having found the rated restaurant and prioritized user preferences, Table 4 showed that the system will check the labels contained in the top restaurants, then the label will be termed, and the restaurant will be referred to as a document. It calculated the frequency of a menu or food
4008
Journal of Theoretical and Applied Information Technology 31st August 2017. Vol.95. No.16 © 2005 - Ongoing JATIT & LLS
ISSN: 1992-8645
www.jatit.org
appears as a label on each restaurant, or called the process of Term Frequency (TF).
E-ISSN: 1817-3195
Source: analysis result 4.2. Estimation of user-item relationship To get weighting tags or labels of restaurant, we use frequency as weighting term. The weighting approach provide information about the frequency of users to select or prefer menu tags and to assign weight values to each food in the restaurant so that a priority tag can be established as calculated list. It represented the frequency of occurrence of menu or restaurant based of appearance of each item on the list of restaurants or lists of menu. Such frequencybased weighting tags are also so-called tokenization as effort of filtering headword from the contents of user history. Therefore, the total frequency of occurrence of the selected menu or restaurant shapes the user-restaurant relationship values. 4.3. Frequency of occurrences of word in user-restaurant relationship selection We use equation 7 to estimate the useritem relationship. The user is customer and the item is the restaurant. To get weighting tags or labels of restaurant, we use frequency as weighting term. The weighting approach provide information about the frequency of users to select or prefer menu tags and to assign weight values to each food in the restaurant so that a priority tag can be established as calculated list. It represented the frequency of occurrence of menu or restaurant based of appearance of each item on the list of restaurants or lists of menu. Such frequency-based weighting tags are also socalled tokenization as effort of filtering headword from the contents of user history. Each selection can have a different total term. It is necessary to normalize based on the size of the term owned by dividing the initial selection to total relationships (Table 5). The result is normalized on other lower term that has been selected by the system. Table 6 and Table 7 showed the relationship and the selected combination of user and restaurant menus.
Table 4. Table Of Rated Restaurants And Their Menu Labels Ranking Restaurant Label Name 1. ViaVia Italian, French, Pizza, Vegetarian Friendly, Vegan Options, Gluten Free Options Friendly, Vegan Options, Gluten Free Options 2. Jejamuran Asian, Indonesian, Vegetarian Friendly, Vegan Options, Halal 3. Mediterranea Italian, French, Pizza, Mediterranean, European, Vegetarian Friendly 4. Milas Asian, Indonesian, Vegetarian Friendly, Vegan Options, Gluten Free Options 5. Nanamia Mediterranean, Pizzeria Italian, Halal, Mozes Vegetarian Friendly, Vegan Options 6. Verandah European, Asian, Alfresco Indonesian, Halal 7. Roaster and Italian, American, Bear Cafe, European, Asian, Indonesian, Vegetarian Friendly, Halal, Vegan Options 8. The Sawah Asian, Indonesian, Halal, Vegetarian Friendly, Vegan Options 9. Nanamia Mediterranean, Halal, Pizzeria Vegetarian, Friendly, Tirtodipuran Vegan Options 10. Canting Bar, European, Restaurant Indonesian, American, Asian, Fusion, Vegetarian Friendly, Halal
Table 5. Normalized Frequency Of Occurrence Tag
ViaVi a
Italian
0.100
Jejamur an
Mediterr anea 0.250
Milas
Frequency of occurrences Nanamia Verand R and ah Bear 0.125
4009
0.135
The Sawah
Pizzeria
Canting
Sum of does contain tag 4
Journal of Theoretical and Applied Information Technology 31st August 2017. Vol.95. No.16 © 2005 - Ongoing JATIT & LLS
ISSN: 1992-8645 French Pizza Vegetarian Friendly Vegan Options Gluten Free Options Asian Indonesian Halal Mediterran ean European Cafe Bar American Asian Fusion
www.jatit.org
0.100 0.100 0.100
0.184
0.100
0.184
0.135 0.135 0.135
0.100
E-ISSN: 1817-3195
0.100
0.125
0.100
0.135
0.120
0.100
0.125
0.120
0.135
0.120
0.100
7
0.100
0.184 0.184
2
0.100 0.125 0.250
0.135 0.135
0.100 0.100 0.100
0.135 0.135
0.120
0.100
0.184
0.120 0.125
0.120 0.120
0.100
0.120 0.120
0.100
0.100 0.100
0.100 0.100 0.100
0.185
Source: analysis result Table 6. Frequency-Based Selection Result And Their Weighting Term Tag
Italian French Pizza Vegetari an Friendly Vegan Options Gluten Free Options Asian Indonesi an Halal Mediterr anean Europea n Cafe Bar America n Asian Fusion
Clusterin g frequenc y 0.100 0.100 0.184 0.184
0.135 0.150 0.132 0.176
0.186
0.184
0.160
0.198
0.200
0.200
Frequency in single restaurant ViaVia Jejamura Mediterra n nea
0.100 0.100
0.256 0.125 0.125 0.135
Nanamia
Veranda h
R and Bear
The Sawah
Pizzeria
Canting
0.211
0.125
0.135
0.122
0.125
0.122
0.235
0.125
0.133
0.125
0.120
0.162
0.171
0.133
0.184
0.100 0.125
Milas
0.125 0.250
0.152
0.250
0.125 0.122
0.133
0.176 0.164
0.125 0.250 0.125
0.122
0.122
0.154
0.136
0.120
0.164
0.142 0.145 0.125
0.221 0.156
0.120 0.124 0.154
0.125
0.125 0.250
0.154
0.222
0.250
0.154
Source: analysis result restau rant 0.5
Veget 1.568 0.874 arian Frien dly Source: analysis result
Table 7. Frequent Displayed Result With Weight C
Keyw ord
Frequ ency of single
Clust ering frequ ency
2 2 8
Frequency* clustering frequency
4010
0.156
1 5 7 3 4 1 1 2
Journal of Theoretical and Applied Information Technology 31st August 2017. Vol.95. No.16 © 2005 - Ongoing JATIT & LLS
ISSN: 1992-8645
www.jatit.org
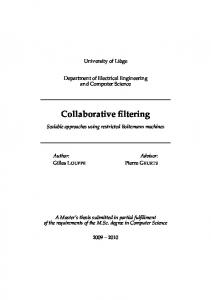
The next process is comparing the weights of search query (in this case symbolized by 'q') by the term weight of each relationship. Assume that search query is "Vegetarian Restaurant". When this query is entered, the system will perform the stemming process and break it down into "vegetarian" and "restaurant" terms. Finally, the term frequency and its weight are calculated. It gives query result for "restaurant" and so does the "vegetarian" compared to the term number of two groups after normalization. For example, if the query result for vegetarian and restaurant is displayed once, it gives value 0.5 for each group. Therefore, the average term frequency for combination of vegetarian and restaurant after being normalized is 05. The set of terms of each group is modeled into similarity vector. It aims to see the similarity of query result between vegetarian menu vector and a restaurant reference vector represented by their individual search query. The similarity of total two vectors is calculated with cosine similarity equation. Cosine Similarity value provide information about how well query search result performance. The equation helps us to determine both length of vector and also the weight value. The length of the vector explained the direction of relationship between the user and item. The weight value or dot product simply represent the term that matches the search query result. In table 8 there are five restaurants that have a value, while the five other restaurants are worth 0. This means the rest is not displayed as a result of a query. The query result for the restaurant without term keyword “vegetarian’ are ViaVia (d1), Jejamuran (d2), Milas (d4), Nanamia (d5), Roaster and Bear (d7), The Rice (d8), Pizzeria (d9), and Canting (d10). When the term keyword “vegetarian” is included, it provide Demi Lovato (d6) since the system carries a search which tailored to user behavior similar with the results that will be displayed previously by ViaVia. The cosine similarity estimation can be repeated by taking the highest score as the interaction benchmark. The system can be
E-ISSN: 1817-3195
configured to determine the further recommended restaurant which similar with ViaVia and Jejamuran. If ViaVia gets the highest result on the previous cosine similarity calculation, then the next iteration is enough ViaVia is the reference. However, because in the example Jejamuran get the highest value, then system take it as reference in finding other prioritized restaurant. Table 8. Table Calculation Of Cosine Similarity
Vector space model-cosine similarity Keyword (q) ViaVia (d1) Jejamuran (d2) Mediterranea(d3) Milas (d4) Nanamia Pizzeria Mozes (d5) Verandah Alfresco (d6) Roaster and Bear (d7) The Sawah (d8) Nanamia Pizzeria Tirtodipuran (d9) Canting Restaurant (d10)
Vector
Cosine similarity
q, d1 q, d2 q, d3 q, d4 q, d5
0.346 0.326 0.000 0.176 0.293
q, d6
0.000
q, d7
0.174
q, d8 q, d9
0.251 0.295
q, d10
0.286
We used equation 2, the Cosine-based similarity where two users are considered as two vectors in the dimension m user space. The equation calculate cosine angle between two vectors. For restaurant list, the similarity between restaurant i and j will form new direction and distance between the groups. The search query for the next iteration is not an input from the user, but from the attributes owned by ViaVia and Jejamuran. The attributes can be compared with search query in the displayed restaurants list. The iteration is repeated with the sequence process as before. However, the result will be different if the cosine similarity equation meets various attributes from highest to low. 5. CONCLUSION We have reviewed robust algorithms and their limitation in the implementation of 4011
Journal of Theoretical and Applied Information Technology 31st August 2017. Vol.95. No.16 © 2005 - Ongoing JATIT & LLS
ISSN: 1992-8645
www.jatit.org
recommender systems. Latent Semantic Analysis is evaluated with example in this paper. The LSA algorithm and cosine similarity approach and their modification can identify productrelated features. The item features and search keywords can impact on the search query result based of weighting and frequency summarization. In our example, the restaurant recommendation system can provide query search results to display vegetarian menu restaurants that are often heard by users. The system provides recommendation based of Latent Semantic Analysis method. The classification of attributes which applied to restaurant needs search query to display the items. By calculating the user behavior as represented by their inputted search keywords, the system can display the restaurant recommendations after measuring the user keywords to predict user preferences and their keyword similarity. The use of LSA can be combined with user rating participation to include their customized attributes which so-called hybrid method. Further work is needed to find more advantage including new approach to resolve sparsity of data and scalability issues which not included in this paper.
E-ISSN: 1817-3195
[4]
[5]
[6]
[7]
[8]
[9]
[10]
REFERENCES [1] Bhardwaj, A., Narayan, Y., & Dutta, M. (2015). Sentiment Analysis for Indian Stock Market Prediction Using Sensex and Nifty. Procedia Computer Science, 70, 8591. [2] Ekstrand, M. D., Kluver, D., Harper, F. M., & Konstan, J. A. (2015, September). Letting users choose recommender algorithms: An experimental study. In Proceedings of the 9th ACM Conference on Recommender Systems (pp. 11-18). ACM. [3] Ricci, F., Rokach, L., & Shapira, B. (2015). Recommender systems: Introduction and challenges. In Recommender Systems Handbook (pp. 134). Springer US.
Zhang, D., Yu, Z., Guo, B., & Wang, Z. (2014). Exploiting personal and community context in mobile social networks. In Mobile Social Networking (pp. 109-138). Springer New York. Lin, H., Yang, X., & Wang, W. (2014). A content-boosted collaborative filtering algorithm for personalized training in interpretation of radiological imaging. Journal of digital imaging, 27(4), 449-456. Ning, X., Desrosiers, C., & Karypis, G. (2015). A comprehensive survey of neighborhood-based recommendation methods. In Recommender systems handbook (pp. 37-76). Springer US. Tuzhilin, A., & Adomavicius, G. (2015). U.S. Patent No. 8, 984, 000. Washington, DC: U.S. Patent and Trademark Office. Lika, B., Kolomvatsos, K., & Hadjiefthymiades, S. (2014). Facing the cold start problem in recommender systems. Expert Systems with Applications, 41(4), 2065-2073. Witten, I. H., Frank, E., Hall, M. A., & Pal, C. J. (2016). Data Mining: Practical machine learning tools and techniques. Morgan Kaufmann. Schnabel, T., Bennett, P. N., Dumais, S. T., & Joachims, T. (2016). Using shortlists to support decision making and improve recommender system performance. In Proceedings of the 25th International Conference on World Wide Web (pp. 987997). International World Wide Web Conferences Steering Committee.
[11] Quinlan, J. R. (2014). C4. 5: programs for machine learning. Elsevier. [12] Perlich, C., Dalessandro, B., Raeder, T., Stitelman, O., & Provost, F. (2014). Machine learning for targeted display advertising: Transfer learning in action. Machine [13] Deo, R. C. (2015). Machine learning in medicine. Circulation, 132(20), 1920-1930. [14] Srivastava, N., Mansimov, E., & Salakhudinov, R. (2015). Unsupervised learning of video representations using 4012
Journal of Theoretical and Applied Information Technology 31st August 2017. Vol.95. No.16 © 2005 - Ongoing JATIT & LLS
ISSN: 1992-8645
[15]
[16]
[17]
[18]
[19]
[20]
[21]
[22]
www.jatit.org
lstms. In International Conference on Machine Learning (pp. 843-852). Huang, G., Song, S., Gupta, J. N., & Wu, C. (2014). Semi-supervised and unsupervised extreme learning machines. IEEE Transactions on Cybernetics, 44(12), 2405-2417. Jordan, M. I., & Mitchell, T. M. (2015). Machine learning: Trends, perspectives, and prospects. Science, 349(6245), 255260. Sun, C., Rampalli, N., Yang, F., & Doan, A. (2014). Chimera: Large-scale classification using machine learning, rules, and crowdsourcing. Proceedings of the VLDB Endowment, 7(13), 1529-1540. Nilashi, M., bin Ibrahim, O., & Ithnin, N. (2014). Hybrid recommendation approaches for multi-criteria collaborative filtering. Expert Systems with Applications, 41(8), 3879-3900. Adomavicius, G., & Tuzhilin, A. (2015). Context-aware recommender systems. In Recommender systems handbook (pp. 191226). Springer US. Zhu, T., Ren, Y., Zhou, W., Rong, J., & Xiong, P. (2014). An effective privacy preserving algorithm for neighborhoodbased collaborative filtering. Future Generation Computer Systems, 36, 142155. Gujral, M., & Chandra, S. (2014). Beyond recommenders and expert finders, processing the expert knowledge. International Journal of Computer Science Issues, 11. Sarwar, B. M., Karypis, G., Konstan, J. A., and Riedl. J. (2000). Analysis Of Recommendation Algorithms For ECommerce. In Proccedings of the ACM EC’00 Conference. Minneapolis, MN. Pp. 158-167 Sánchez-Moreno, D., González, A. B. G., Vicente, M. D. M., Batista, V. F. L., & García, M. N. M. (2016). A collaborative filtering method for music recommendation using playing coefficients for artists and
E-ISSN: 1817-3195
[23]
[24]
[25]
[26]
[27]
[28]
[29]
[30]
[31]
4013
users. Expert Systems with Applications, 66, 234-244. Moreno, M. N., Segrera, S., López, V. F., Muñoz, M. D., & Sánchez, Á. L. (2016). Web mining based framework for solving usual problems in recommender systems. A case study for movies ׳recommendation. Neurocomputing, 176, 72-80. Jonnalagedda, N., Gauch, S., Labille, K., & Alfarhood, S. (2016). Incorporating popularity in a personalized news recommender system. PeerJ Computer Science, 2, e63. Zhang, Z., Tang, X., & Chen, D. (2014, February). Applying user-favorite-itembased similarity into slope one scheme for collaborative filtering. In Computing and Communication Technologies (WCCCT), 2014 World Congress on (pp. 5-7). IEEE. Veena, C., & Babu, B. V. (2015). A UserBased Recommendation with a Scalable Machine Learning Tool. International Journal of Electrical and Computer Engineering, 5(5). Levy, M., & Sandler, M. 2007. A semantic space for music derived from social tags. In: Proc. 8th International Society for Music Information Retrieval Conference Chen, X., Xia, M., Cheng, J., Tang, X., & Zhang, J. (2016). Trend prediction of internet public opinion based on collaborative filtering. In Natural Computation, Fuzzy Systems and Knowledge Discovery (ICNC-FSKD), 2016 12th International Conference on (pp. 583-588). IEEE. Digan, G. (2015). Exploring the Impact that Organisational Culture and Structures have on Knowledge Management Initiatives. Sprague, R., Grauberger, K., & Barberis, N. (2015). One Hundred Twenty Years of US Privacy Law Scholarship: A Latent Semantic Analysis. Mane, P. M. (2014). A Comprehensive Review on Fuzzy Logic & Latent Semantic Analysis Techniques for Improving the Performance of Text Summarization.
Journal of Theoretical and Applied Information Technology 31st August 2017. Vol.95. No.16 © 2005 - Ongoing JATIT & LLS
ISSN: 1992-8645
www.jatit.org
[32] Müller, O., Schmiedel, T., Gorbacheva, E., & vom Brocke, J. (2016). Towards a typology of business process management professionals: identifying patterns of competences through latent semantic analysis. Enterprise Information Systems, 10(1), 50-80. [33] Schedl, M., Knees, P., McFee, B., Bogdanov, D., & Kaminskas, M. (2015). Music recommender systems. In Recommender Systems Handbook (pp. 453-492). Springer US. [34] Shahsavari, V., Bastien, J., Chouinard, L., & Clément, A. (2017). Likelihood-based testing of wavelet coefficients for damage detection in beam structures. Journal of Civil Structural Health Monitoring, 7(1), 79-98.
4014
E-ISSN: 1817-3195