Parallel Biomedical Image Processing with GPGPUs in Cancer Research Attila Reményi*, Sándor Szénási*, István Bándi *, Zoltán Vámossy*, Gábor Valcz**, Pál Bogdanov*, Szabolcs Sergyán* and Miklos Kozlovszky*** *
Óbuda University/John von Neumann Faculty of Informatics, Budapest, Hungary Semmelweiss University/2nd Department of Internal Medicine, Budapest, Hungary *** MTA SZTAKI/Laboratory of Parallel and Distributed Computing, Budapest, Hungary
[email protected];
[email protected] **
Abstract—The main aim of this work is to show, how GPGPUs can facilitate certain type of image processing methods. The software used in this paper is used to detect special tissue part, the nuclei on (HE – hematoxilin eosin) stained colon tissue sample images. Since pathologists are working with large number of high resolution images – thus require significant storage space –, one feasible way to achieve reasonable processing time is the usage of GPGPUs. The CUDA software development kit was used to develop processing algorithms to NVIDIA type GPUs. Our work focuses on how to achieve better performance with coalesced global memory access when working with three-channel RGB tissue images, and how to use the on-die shared memory efficiently. Keywords: GPGPU, CUDA, biomedical tissue image processing
I. INTRODUCTION Nowadays, more-and-more medical institutes are evaluating and analyzing their digitalized high-resolution tissue images to provide patient diagnosis faster and more accurate. One of the main benefits to use digital microscopy to open up diagnosis through automated quantitative and qualitative analysis of the digital tissue images. Our work focuses on the nuclei detection on hematoxilin eosin (HE) stained colon tissue sample images. It examines how effectively the developed algorithms have been used during the evaluation process on data parallel NVIDIA type architectures, thus in this paper, we are using similar terminology as used by NVIDIA in its documentations. A. Motivation The size of high-resolution tissue images can easily reach the order of few 100 MBs or even GBs. Therefore, the image processing speed and effectiveness plays an important usability factor. One way of increasing the processing performance, is to use data parallel accelerators (e.g.: GPGPUs). II. SOFTWARE BACKGROUND Our developed image processing method is used as a core service in our in-house developed software solution, which supports automatic quantitative analysis and
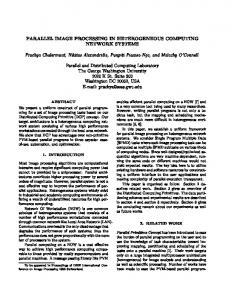
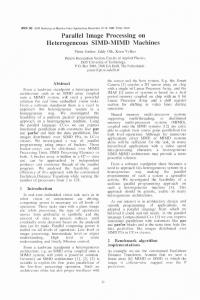
Figure 1. HE stained colon tissue
evaluation of HE stained colon tissue samples. The input of the software can be either stand-alone images, or digital slides received from a high-resolution tissue/slide scanner. The digital slide format we have used is a proprietary solution developed by 3DHistech Ltd. Figure 1 shows a digital slide example. To support analysis on large amount of slides, we have created a workflow to handle both various input/output and processing algorithms in a flexible manner. On the input side, we are using batch processing with individually definable algorithm parameters assigned to each slide, and on the output side robust database management is used.
ROI IN
GUI
Load Sample Evaluation
Save
Measurement Detection
Evaluation
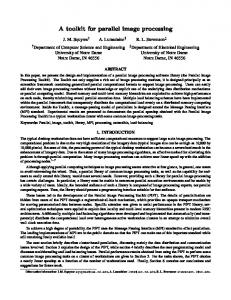
Figure 2. The simplified module diagram of the system
OUT
Figure 2. shows a schematic illustration of the workflow used during the tissue analysis process. The detection contains three major steps: • cell nuclei detection •
gland detection
•
surface epithelium detection.
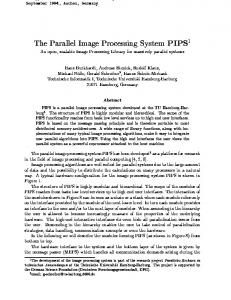
Both the gland and epithelium detection algorithms are using as their input data the result of the cell nuclei detection. Our work in this paper focuses only on the cell nuclei detection performance issues, and describing the exact procedures of the gland, so surface epithelium identification is not part of this paper. After the detection process, a large set of parameters (22) are measured (such as surface cell count ratio, gland diameter, cell per gland count and so on) and stored all the measured parameters in a relational database. III. THE NUCLEI DETECTION ALGORITHM In the aspect of detection, the most important feature of the nuclei is their purple color (Figure 3.), based on this; the first step of the segmentation can be done [1]. Our goal with this is to make a binary image, which has the same dimensions as the original, and contains white pixels, where the nuclei are supposed to be. We have defined a set of workflows to target and extract important information from the digital tissue images. Like all the digital images, the digital slides consists some level of noise as well, which should be eliminated (noise blurring) as first step. For this, a Gauss convolution was used with a 3 × 3 binomial approximation, because this way the kernel contains only the power of two weights. By using the binomial kernel, our goal was to increase the process speed because just like the CPUs, the GPUs can execute the shift operations faster than for example a fix point multiplication [2]. As the next step, an RGB-HSV conversation was performed, because it is easier to define the purple color of the nuclei by using the HSV color space. After the segmentation in the new color space, to separate the cohered nuclei, an ultimate erode and a local maximum search was performed on the image. The last step is a linear connected component algorithm executed by the CPU, because of its linear nature. The GPU part of the nuclei detection process is illustrated in Figure 4.
Gauss convolution
Memcpy HostToDevice
Figure 3. Cell nuclei
IV. OPTIMIZATION TECHNIQUES USED Due to the “cache-less” operation manner, important part of the GPU programming is to optimize the memory access [3]. This is especially true for memory intensive computing tasks, such as the image processing procedures [4]. We have evaluated different type of optimization techniques to perform Gauss convolution. Our goal was to ensure fully coalesced global memory access. We have tested multiple architectures (different GPU generations/implementations). The different architecture generations set different conditions (restrictions) to achieve coalesced memory access, which needs special optimization techniques. As it was expected we have find correlation between the architecture versions and the available (developer friendly) optimization techniques. The general trend was that the newer the GPU is, the looser the conditions are. A. Naïve kernel Consider first the naive approach where all three RGB channels are loaded individually with one byte global load instructions. In this case, by loading the blue channel first, the first byte of a pixel is needed, because the channels are stored in BGR order. This is exactly 16 bytes data, when 16 threads are active; however, the blue channels are not located near each other in memory. Therefore, at least 16 × 3 = 48 bytes have to be moved, but since the memory controller is only able to load data segments, this means at least two 32 bytes large read transaction. The green and red channels work the same, so instead of the 16 pixel data (48 bytes), 3 × 64 = 192 bytes of data have to be loaded or stored. This is a waste of memory throughput.
Convert RGB to HSV
Ultimate erode
Binarization Figure 4. The nuclei detection workflow with the process steps
Local maximum search
Memcpy DeviceToHost
We have already showed that to achieve more efficient global memory access, the data amount that is processed by one thread is increased to twelve bytes, and loaded in three four bytes packages. So the load operations processed by one half-warp should move 64 bytes useful data. However if the first load command reads the first 1/3 part of the 12 bytes data, then the 16 load operations means actually 16 × 12 = 192 bytes of data movement. By changing the loaded data order, this unnecessary data movement is avoidable.
B. Using the texture memory It is possible to speed up the memory access by using textures. Today's graphics unit, as their name suggests, primarily designed for 3D imaging. It is therefore not surprising that special hardware can be found in them, which are specific to accelerate imaging operations: like the texture memory space and the cache connected to it. The texture memory space only differs from the global logically, it takes place physically in the global memory, and it works as a pointer to an already defined data. Through this pointer, the memory controller can efficiently manage the memory bus traffic. The disadvantage is that it cannot be used to write data back to the global memory, thus saving has to be done the naïve way.
V. EVALUATION OF OPTIMIZATION TECHNIQUES In the comparison, we are looking the answer for two questions: what speed up was achieved by implementing the optimization techniques, and is it worth using the GPU for image processing or not. The main characteristics of the test system can be found in Table I.
C. Process 12 bytes per thread (12B) To make the writing more effective, the texture cannot be used, since the write operation is not allowed. It should be achieved, that let the loaded and saved data per hardware thread be equal to 4 bytes. But it is blocked by the RGB pixel size which is 3 bytes. One approach is to let only 12 threads of all the 16 to load the data in 4 bytes packages [5] to achieve coalesced global memory access. However, this leads to have 25% of the created threads to be idle during the load operation. The idea is to expand the data amount that one thread is working with, so it becomes possible to load and store data in four bytes. The solution is the lowest common multiple 3 × 4Æ12. If one thread works with four pixels, then the 12 bytes data can be loaded and stored in 4 bytes large packages.
TABLE I.
Naive
Run-time 32B (µs) 425 102735
Type
Core number
CPU
Core2Duo
2
GPU
GTX295
240
Core clock
Memory clock
1866 MHz 1242 MHz
667 MHz 999 MHz
Memory interface width 128 bit 448 bit
The difference between the kernels shown in Table II. and Figure 5. shows that the biggest performance jump can be achieved by leaving the naïve approach behind. By using the texture memory, the process can be done around two times faster. The next step is to introduce the 12 bytes per thread processing, which means a 20% speed up against the texture memory. However, by using the shared memory, only about 8% of speed increase was achieved. All the values in Table II. are from the CUDA Visual Profiler shipped with the SDK.
D. Using the shared memory So far we focused on the global memory, and ignored the on-die shared memory. Logically, the shared memory belongs to one block, physically to one streaming multiprocessor (SM). Its latency is one-two cycle, and its size in 16 KB in every SM in the processor we use. The methods represented so far, shares the same feature; thus every thread loads nine times more data than writes back, because the mask that was used for blurring had the size of 3 × 3, so this means nine times redundant data movement. The shared memory can be used to reduce this redundant data movement: every – except the ones at the block boarders – thread loads its “own” data to the shared memory. After this, every thread can load the surrounding data from the shared memory [6]. Further advantage is that since the reading is separate from the processing, it is possible to load the data in a different order, and achieve coalesced global memory loads. TABLE II.
TEST SYSTEM CHARACTERISTICS
Figure 5. Blurring kernels graph BLURRING KERNELS
Global Load 64B 128B
Request
32B
Global Store 64B 128B Request
0
0
7560
9888
0
0
840
Texture
202
0
0
0
0
9888
0
0
840
12B
167
912
4988
7482
1080
0
1248
1248
216
Shared
154
807
1398
0
416
0
1248
1248
216
A. CPU – GPU comparison In this chapter we examine the entire nucleus detection algorithm. For ease of clarity, we list the exact functions that were included in the measurement: 1. Gauss convolution [7], 2.
RGB-HSV conversion,
3.
segmentation,
4.
ultimate erode,
5.
local maximum search,
6.
linear connected component search.
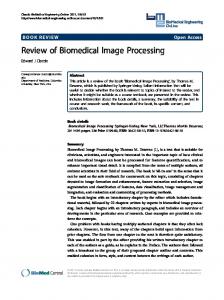
The last of these is not implemented on the graphics unit because of its serial nature, so it runs by the central processor. Table III. shows the measured values for each architectures. All the values are in seconds, and logarithmic scale was used in Figure 6. All the test images came from true digital slides and the highest magnification was used, the biggest image was 4096 × 4096. A 15 × 15 mask size was used in the local maximum search. The run-time ratio values are shown in Table IV. The values show that the process time on the GPU is not grows as much as the image size does. Therefore, while the process time relatively same at the smallest image size, the GPU has an approximately 58x advantage at the largest image.
TABLE III. 2562
5122
10242
20482
40962
0,1913s
0,2094s
0,28334s
0,5111s
1,3971s
0,3134s
1,0341s
4,5734s
17,63s
82s
Image size Run time (GPU) Run time (CPU)
NUCLEUS DETECTION PROCESS TIME
TABLE IV.
RUN-TIME RATIO
Image size
2562
5122
10242
20482
40962
CPU / GPU
1,638
4,938
16,141
34,494
58,693
CONCLUSIONS As our test results showed, GPU usage was able to speed up certain type of image processing tasks significantly. It can be stated that, although even smaller (512 × 512) images can be processed faster with the graphics unit, the benefits of the GPU come to the front at higher resolution, where about 58-fold difference has been achieved. ACKNOWLEDGMENTS This work makes use of results produced by the Hungarian National Technology Programme, A1, Life sciences, the “Development of integrated virtual microscopy technologies and reagents for diagnosing, therapeutical prediction and preventive screening of colon cancer “Hungarian National Technology Programme, A1, Life sciences, (3dhist08) project and the ÓE-RH 1104/22011 project. Authors would like to thank for their financial support hereby. REFERENCES [1]
[2] [3] [4]
[5]
Figure 6. GPU – CPU performance comparison
[6] [7]
L. Ficsór, V. S. Varga, A. Tagscherer. Zs. Tulassay, B. Molnár., "Automated classification of inflammation in colon histological sections based on digital microscopy and advanced image analysis." Cytometry, 2008. NVIDIA., "CUDA Programming Guide 2.3.", 2009. NVIDIA. "CUDA Best Practises Guide 2.3.", 2009. J. Stam., CUDA@MIT. CUDA Optimization, an Image Processing Case Study. [Online] NVIDIA, 2009. [Cited: September 2, 2009.] http://dl.getdropbox.com/u/484203/Lectures/ Guests/JoeStam__ConvolutionSoup.pdf Luo, Yuancheng and Duraiswami, Ramani., "Canny Edge Detection on NVIDIA CUDA." Anchorage, AK : s.n., 2008. 9781-4244-2339-2 . V. Podlozhnyuk, "Image Convolution with CUDA." s.l.: NVIDIA, 2007. A, Nagy, Z. Vámossy. “Super-Resolution for Traditional and Omnidirectional Image Sequences” Acta Polytechnica Hungarica, Vol. 6/1, Budapest Tech, 2009. pp. 117–130, ISSN 1785 8860