Key words. parallel computing, automatic performance analysis, event tracing. 1. ... as collected by profiling tools, is sufficient to describe a multitude of ...... a Python class library for the detection of typical problems affecting the performance.
SPECIFYING PERFORMANCE PROPERTIES OF PARALLEL APPLICATIONS USING COMPOUND EVENTS FELIX WOLF
§ AND
BERND MOHR
§
Abstract. In this article we present a novel approach to analyzing performance properties of parallel applications based on event traces. We define a framework for formally specifying compound events that characterize performance behavior. The framework allows the creation of abstract building blocks that represent concepts of the underlying programming model and therefore provide an easy means to specify complex compound events. We show that using these specifications it is possible to automatically locate inefficiencies in parallel applications by looking for occurrences of the corresponding compound events in event traces. We demonstrate how our ideas apply to both the Message Passing Interface (MPI) programming model and to the Open specifications for Multi Processing (OpenMP). Key words. parallel computing, automatic performance analysis, event tracing
1. Motivation. Performance analysis is an essential activity for the development of parallel applications. A critical step in the performance analysis is identifying the performance properties of the application. This is traditionally done through analysis of collected performance data and should produce useful information about inefficient program behavior. However, many current tools do not explain performance phenomena on an appropriate abstraction level. Instead, the user is confronted with a huge amount of low-level information and has to draw the conclusions manually. Effective automatic performance analysis requires formal methods for specifying performance properties that characterize a specific performance behavior. The strength of our method stems from its ability to describe the behavior on a high abstraction level directly related to the programming model. The resulting specifications can then serve as a basis for performance tools that are able to prove the presence of complex performance properties in a parallel application without user intervention. The kind of performance data available has a large influence on the expressiveness of the performance properties that can be defined based on it. Summary information, as collected by profiling tools, is sufficient to describe a multitude of frequently occurring performance properties. However, there are performance properties that are not visible in this kind of information. A much more detailed view of the behavior of the parallel application can be gained by using event traces. By looking for compound events in an event trace, it is possible to prove that particular performance properties are present. A compound event representing a performance property is a set of primitive events, which are called its constituents. Programming-model–related compound events expose various complex relationships among their constituents, which mostly depend on that particular programming model. For instance, sending a message and receiving it are interconnected by a relationship, which is derived from the message passing programming model. For this reason it is difficult to devise a general formal representation of compound events that is powerful enough to express the complex compound events related to different programming models. In this paper we present a framework for formally describing compound events indicating the presence of important programming-model–related performance properties in parallel applications. Programming models considered in this article are the § Forschungszentrum J¨ ulich, Zentralinstitut f¨ ur Angewandte Mathematik, Germany, {f.wolf, b.mohr}@fz-juelich.de
1
2
F. WOLF AND B. MOHR
widely used Message Passing Interface (MPI) [10] and the Open specifications for Multi Processing (OpenMP) [13]. We identify two categories of abstractions, which can be used to provide programming-model–specific building blocks, on top of which a general specification of compound events is possible. The abstractions represent entities of the different programming models such as MPI collective operations or OpenMP parallel region constructs and are useful for measuring the influence of these on the performance behavior. We show that the resulting specifications can be easily transformed into an appropriate detection algorithm. The contribution of this article is a systematic approach to defining performance properties of parallel applications. That enables automatic performance analysis based on event traces. Its strength lies in a understandable characterization of performance behavior using the vocabulary of the underlying programming model. Since it is possible to combine abstractions defined for different programming models, our approach is also able to deal with the concurrent usage of more than one parallel programming model in the same application. 1.1. Paper organization. In §2 we introduce the technique of event tracing and develop a basic model of an event trace. Subsequently in §3, we present two categories of higher-level abstractions on top of the basic model, which can be used to easily describe performance properties by means of compound events. To give an example, appropriate abstractions are defined for MPI in §4. Section 5 introduces a scheme aimed at formally specifying compound events and describes how the resulting specifications can be used as the basis for a detection algorithm. We demonstrate our ideas by providing detailed example specifications for MPI performance properties, including collective operations in §6. A brief discussion of how to apply our results to OpenMP follows in §7. Finally, we consider related work and conclude the paper. 2. Basic Event Trace Model. This section gives an introduction to event tracing for performance analysis and explains how to create a basic model of an event trace. Since we present a formal description of compound events, we focus on the formal properties of this basic model. 2.1. Event Tracing. Using event traces to analyze the performance behavior of parallel and distributed applications is a widely accepted technique. The ability to visualize the program behavior by means of event traces explains the success of graphical event trace browsers such as VAMPIR [1] and Upshot and its successors [8]. Event traces are simply collections of runtime events, which are recorded in a memory buffer during program execution and which are written to a file after program termination. The process of preparing an application for event tracing is called instrumentation. This involves a modification of the application either by inserting event logging statements into the source code prior to compilation, or by modifying the object code thereafter. A further method commonly applied to MPI applications simply links function or subroutine calls to appropriate wrapper functions. These usually record the call and return events as well as function-specific events such as sending or receiving a message. The information recorded for a runtime event includes at least a time stamp, the location (e.g., the process or node) where the event happened, and the type of event. Depending on the event type additional information may be supplied, such as the function name for function call events. Message event records typically contain details about the current message such as the source and destination location or message tags. In order to keep instrumentation simple the information included in
SPECIFYING PERFORMANCE PROPERTIES USING COMPOUND EVENTS
3
such an event record is restricted to the data available at the location where and at the moment when the event occurs. After program termination the event traces, which are generated independently for each location, are merged and sorted according to their time stamps. Systems that rely only on local clocks have to adjust the time stamps with respect to chronological displacements and clock drifts. Limitations of event tracing may result from both the huge amount of data being produced and the perturbation of the program execution. This is true in particular when the density of recorded events is high. Because it is difficult to predict when this will occur, instrumentation has to be carried out very carefully. 2.2. Basic Model. An event characterizes an isolated action happening at a distinct location and at a distinct point in time. It is the smallest entity constituting the dynamic view of a parallel programming model. A basic model of an event trace comprises a set of event types with an associated set of attributes as well as constraints concerning the order of events. In most cases there are event types that share a subset of their attributes. For this reason it is convenient to create a type hierarchy containing concrete event types as well as abstract event types at different levels, in order to isolate commonalities. Each event has a location (loc)1 (e.g., the MPI process) as well as a time stamp (time). So we can define an abstract event type Event constituting the root of the type hierarchy. All event types inherit from Event. The set of locations involved in an event trace is called L. An event type t is defined by a set of attributes {a1 , . . . , ant }. A subset of these attributes may be associated with more general base types. Subsequently we use the notation e.attr to refer to an attribute attr of an event e. An event trace is a sequence E = {e1 , . . . , emax } of events where ∀ei , ej ∈ E the following two conditions are satisfied: 1. i < j ⇒ ei .time ≤ ej .time 2. i < j ∧ ei .loc = ej .loc ⇒ ei .time < ej .time The conditions require the events to be in chronological order and allow only events at different locations to happen simultaneously. Note that, depending on the programming model being used by an application, there may be additional constraints as well. 3. Model Enhancement. The process of creating programming model-specific abstractions from a given basic event trace model is called model enhancement. This enhanced model is built on top of the basic model by creating instances of two different categories of abstractions: (i) System states (ii) Pointer attributes Instances of these categories need not be defined in a certain order and may also refer to each other as long as their definitions remain acyclic. We formally define these abstractions in the following subsections. Concrete examples can be found in §4. 3.1. System states. Compound events representing performance properties often exhibit some form of locality within the event trace. Usually, the constituents of such a compound event depend on some context, which is represented by the state of 1 We
abbreviate attribute names only in formulas; in regular text we spell them out.
4
F. WOLF AND B. MOHR
the parallel system at the time when the compound event occurs. In most cases, this system state is characterized by the set of ongoing activities in contrast to activities that are already finished. An example for such a system state is the set of messages being in transfer at a given moment, which can be represented by the set of send events of these messages. Another example is the dynamic call stack, which describes the execution phase during which an event happens. Again, it can be represented by a set of events, this time by the set of function call events. Note that the nature of such system states itself involves programming-model– specific relationships and that it can be described by a set of events. Therefore, we define a system state as a mapping S : E → P(E) that maps an event ei ∈ E from the event trace onto a subset S(ei ) ⊆ E of the events from the event trace, where ∀ej ∈ S(ei ) :
j ≤ i,
that is, system states depend only on historic data and not on future events. In addition, for each system state mapping S we define an initial state S0 = ∅. A system state Si = S(ei ) of an event ei should reflect one aspect of the execution state of the application after the event ei took place. A system state is inductively defined by a set of transition rules. For each event type t in the model a transition rule σt defines how a state Si+1 is created from a state Si and an event ei+1 of type t by applying σt to Si and ei+1 . So the state S1 is created from the initial state S0 and the event at the first position e1 and so on. Thus, we have Si+1 = σt (Si , ei+1 ), where t is the type of the event ei+1 . If there is no explicitly defined transition rule σt for an event type t and a system state S, σt is assumed to be the identity mapping. A transition rule defined for an abstract base event type covers all derived event types. If there are several rules defined along a path in the type hierarchy, they are all applied in the order defined by inheritance starting with the most general type. That is to say, the transition rule actually applied is a composition of all the transition rules defined along the path through the event type hierarchy ranging from the root to the type of the current event. For example, consider two types b and d, where d is a descendant of b. If there are two transition rules σb and σd and ei+1 is an event of type d, then Si+1 = σd (σb (Si , ei+1 ), ei+1 ). System states are abstractions used to provide context information for the constituents of a compound event. In other words, the intent of system states is to separate activities that are still going on with respect to a certain point in time from activities that are already completed with respect to that point in time. Note that in most cases it is useful to define several system states S 1 , . . . , S ns per model. 3.2. Pointer attributes. Another useful abstraction is to link related events together, so that one can navigate from one event to another related event. An example is a link from the receive event of a message back to the corresponding send event. This mechanism permits the navigation along a path of related events and the definition of relationships among constituents of a compound event using such paths. A natural way of representing such links is to provide event attributes with pointer semantics. Pointer attributes are the second category of abstractions we consider. They are added to those attributes already defined in the basic model. We model pointer attributes as a function of other attributes and system states. For each event ei of type t we may define pointer attributes {p1 , . . . , pmt }, where ns 1 ei .pj = fj (ei .a1 , . . . , ei .ant , Si−1 , . . . Si−1 ).
SPECIFYING PERFORMANCE PROPERTIES USING COMPOUND EVENTS
5
That means pointer attributes depend on the attributes defined in the basic model and on the system states of the event immediately before the event instance in consideration. The rationale behind this definition is to disallow functional dependencies on events belonging to activities that have been already completed. This is not really a restriction since in most cases related events occur during the same activity. However, it allows the calculation of pointer attributes by taking into account only a small set of relevant events, which is an important aspect for a later implementation. Note that pointer attributes never point to future events. 3.3. Remarks. As previously suggested, it is possible to use pointer attributes in system state transition rules as well as system states in pointer attribute definitions. Since a pointer attribute of an event ei may be defined only using Si−1 and, in addition, S0 = ∅ is always true, it is ensured that all definitions remain acyclic. The concept of model enhancement is not only a convenient method for defining compound events. Since the locality exhibited by compound events is explicitly modeled in the form of system states, we also get a foundation for efficient search methods to detect compound event instances in an event trace. 4. Example: MPI. In order to show how model enhancement can be used to provide a simple description of complex compound events, we chose the popular MPI programming model as an example. First, we develop a basic model of an MPI event trace. After that, we show how to enhance that model using the two categories of abstractions mentioned before. 4.1. MPI Basic Event Trace Model. The static view of an MPI application comprises a set of regions. A region is a code section of a parallel program. It may be a function, a loop, or just a basic block. One execution of a region forms a region instance. We assume that all region instances are properly nested. We define two event types Enter and Exit indicating that a code region is entered or left. They both inherit from a common base type RegionEvent providing a region attribute, which denotes the region entered or left. Since sending and receiving point-to-point messages are activities that can be easily separated from their triggering functions, we also define two event types, Send and Receive, which provide attributes for the source (src) and destination (dest) location of the message. The message properties themselves are accommodated in an abstract base event type MsgEvent, which has attributes containing the message tag (tag), the communicator (com), and the message length (len). Usually, events of these types are placed in between the Enter and Exit events of the corresponding MPI routine. Of course, message events are constrained in their order, such that a Send never occurs after its matching Receive. Modeling MPI collective operations is more intricate because here two different aspects are linked very closely. First, a collective operation is executed in parallel on different locations. That is to say, a collective operation instance is actually a set of single region instances. Second, a collective operation involves communication, but the detailed structure of this communication is usually hidden behind the MPI implementation.2 This makes it difficult to explicitly model the occurring communication events. Therefore, we introduce a hybrid event type CollExit, which inherits from Exit and also provides attributes characterizing the collective communication. These 2 We consider pure barrier synchronization as a special case of an MPI collective operation, where the amount of data transfered is zero.
6
F. WOLF AND B. MOHR
attributes include the number of bytes sent (sent) and the number of bytes received (recvd), the root location of the collective operation (root) if there is any, and the communicator (com). The communicator can be considered a link connecting the single region instances, which constitute a whole collective operation instance. This is because it determines the set of locations involved in that operation instance. So, for each participating location, the call of an MPI collective operation results in an Enter event for calling it and in a CollExit event for leaving it. The complete type hierarchy is depicted in Fig. 4.1 using UML [4] notation. For convenience, we use full attribute names in the figure. Note that in order to keep the hierarchy tree simple, the hybrid nature of CollExit is not expressed explicitly by multiple inheritance relationships. Event location time
RegionEvent
MsgEvent
region
Enter
tag communicator length
Exit
Send destination
Receive source
CollExit communicator root sent received
Fig. 4.1. The basic event type hierarchy for MPI
Since we intend to use the communicator for connecting the different events making up a whole collective operation instance, we are interested in its associated group of locations. So we model a communicator G ∈ Comm as a subset G ⊆ L of the set of all locations, so that MPI COMM WORLD is equal to L. Comm denotes the set of all communicators created during program execution. Note that this model can be implemented using very simple instrumentation technology such as MPI wrapper libraries. 4.2. Simple Enhancement of the MPI Basic Model. This subsection describes simple abstractions, which can be used to specify performance relevant compound events. Before we start, we define three auxiliary functions: 1. mostrcnt(F ) = {e ∈ F |¬∃f ∈ F : f.time > e.time} 2. leastrcnt(F ) = {e ∈ F |¬∃f ∈ F : f.time < e.time} 3. haveloc(F, l) = {e ∈ F |e.loc = l} The first two functions return those events from a set of events F that happened most or least recently. haveloc() returns the events that have a specific location. For convenience, we allow the set returned by these functions also to be treated as an event, if the returned set contains exactly one unambiguous element.
SPECIFYING PERFORMANCE PROPERTIES USING COMPOUND EVENTS
7
System states. The event type hierarchy motivates the description of the activities performed by an MPI application at a given moment in terms of three different higherlevel concepts: (i) Region instances (ii) Messages (iii) Collective operation instances First, we show that system states are a suitable means to describe the set of currently active region instances and message transfers. Later we shall see that this is also true for collective operation instances. The region instances being executed at a moment can be easily represented by the set of Enter events that determine their beginnings. So we define for each location l ∈ L a system state Rl and call it the region stack for location l. It is defined by two l state transition rules ρlt : Ril 7→ Ri+1 , which describe how the state is transformed by an event ei+1 : ( Ril ∪ {ei+1 } if ei+1 .loc = l l l ρEnter : Ri+1 = Ril else ρlExit
:
l Ri+1
=
(
Ril \ mostrcnt(Ril ) if ei+1 .loc = l Ril else
ρlEnter is responsible for adding Enter events representing active region instances to the region stack and ρlExit is responsible for removing them from the region stack as soon as the corresponding region instances are completed. The messages currently in transfer are best characterized by the set of their respective Send events. So we define for each pair of locations s, d ∈ L a system state M s,d and call it the message queue for traffic from source s to destination d. It is s,d s,d defined by state transition rules µs,d 7→ Mi+1 : t : Mi µs,d Send
s,d Mi+1
:
µs,d Receive
:
s,d Mi+1
where
=
(
=
(
Mis,d ∪ {ei+1 } Mis,d
if (ei+1 .loc = s else
∧
ei+1 .dest = d)
Mis,d \ {ej } if (ei+1 .src = s ∧ ei+1 .loc = d) Mis,d else ej = leastrcnt({e ∈ Mis,d | e.tag = ei+1 .tag ∧ e.com = ei+1 .com})
The first rule adds events for messages that have just been sent, and the second rule removes events for messages that have just been received. This means that the set of messages currently in transfer is always up to date. Matching Send and Receive events is done using the standard MPI messaging semantics. Before investigating collective operation instances, we first introduce MPI-related pointer attributes. Pointer Attributes. Both region instances and messages can be represented by pairs of matching events. A region instance is characterized by its Enter and Exit events, and a message is described by its Send and Receive events. For this reason it would be reasonable to provide a link connecting both sides of each pair; that is to say, a link from the Exit event to its corresponding Enter event and a link from the
8
F. WOLF AND B. MOHR
Receive event to its corresponding Send event. The direction of these links follows our definition from §3.2, which requires all links to point backwards in time. However, the relationship connecting an Exit event with its matching Enter event is actually a specialization of a general relationship between an arbitrary event and the Enter event of the region instance enclosing it. Therefore, a link should connect an arbitrary event with the Enter event of its enclosing region instance; that is, with the event that was “at the top” of the region stack immediately before the event happened. We define the following pointer attributes by using conditions, which are similar to those we have already used for the definition of system states. (i) For an arbitrary event ei we define an attribute named enterptr, which points to the Enter event of the region instance, in which the event ei took place. l ei .enterptr = ej ∈ Ri−1 , where 1. ei .loc = l l 2. ej = mostrcnt(Ri−1 ) If such an ej does not exist, the attribute is set to ’null’. The new attribute is added to the attributes of the root event type Event. (ii) For an Receive event ei we define an attribute named sendptr, which points s,d to the corresponding Send event. ei .sendptr = ej ∈ Mi−1 , where 1. ei .src = s ∧ ei .loc = d s,d | e.tag = ei .tag ∧ e.com = ei .com}) 2. ej = leastrcnt({e ∈ Mi−1 The meaning of these pointer attributes is illustrated in Fig. 4.2. Here, events taking place at two different locations are shown along their time lines. The upper location performs two nested region instances. During the inner region instance (indicated by the darker area) a message is sent to the lower location. locations
Enter Exit Send Receive
Message enterptr sendptr time
Fig. 4.2. References provided by pointer attributes
Note that the previously defined pointer attributes can be used to abbreviate the definitions of Rl and M s,d . Although system state and pointer attribute definitions would reference each other, they would remain acyclic for the reasons mentioned earlier. 4.3. MPI Collective Operations. The events involved in collective operations form another class of related events, which are important in the context of MPI performance properties. A complete collective operation instance is depicted in Fig. 4.3. The figure shows the time lines of all locations (i.e., processes) that are involved in this call as well as the time lines of two locations that are not involved. The involved
SPECIFYING PERFORMANCE PROPERTIES USING COMPOUND EVENTS
9
locations together form the group that is associated with the communicator of the operation call. In general, this group is a subset of all possible locations. Entering and leaving the corresponding MPI function are represented by Enter and CollExit events. locations
Enter CollExit
enterptr time
Fig. 4.3. An MPI collective operation instance
Capturing the events belonging to a collective operation instance can be done by defining an appropriate system state for each communicator. The basic idea is to accumulate the CollExit events belonging to a collective operation instance until all events belonging to that instance have been collected. After completion the corresponding events can be removed. We define a group of system states C G , where G is a set of locations representing G an MPI communicator. Here are the defining state transition rules γtG : CiG 7→ Ci+1 : G γCollExit
G γEvent :
:
G Ci+1
G Ci+1
where
=
(
CiG ∪ {ei+1 } CiG
=
(
CiG \ OpInst if ∀l ∈ G : |haveloc(CiG , l)| ≥ 1 CiG else
OpInst =
S
if ei+1 .com = G else
leastrcnt(haveloc(CiG , l))
l∈G G A CollExit event is added to CiC by applying the rule γCollExit , if G is the communicator of the CollExit event (ei+1 .com = G). As soon as all CollExit events belonging to a collective operation instance are elements of C G , they are removed by applying G γEvent . To access the events belonging to a collective operation instance, we define another auxiliary function, which can be used to isolate these events: (type(ei ) = CollExit ∧ OpInst if coll(ei ) = ∀l ∈ ei .com : |haveloc(Ciei .com , l)| ≥ 1) ∅ else
where
OpInst =
S
l∈ei .com
leastrcnt(haveloc(Ciei .com , l))
10
F. WOLF AND B. MOHR
If ei is a CollExit event that completes a collective operation instance, then coll() returns all CollExit events belonging to that instance. Otherwise the empty set is returned. The Enter events of that instance can be accessed by following the enterptr attributes originating from the returned events as depicted in Fig. 4.3. Thus, it is easy to access the whole set of events constituting a collective operation instance. Enhancing the model in this way means considering a collective operation essentially as a set of single region instances. This viewpoint has the advantage that it allows OpenMP parallel constructs to be treated in a similar way. Thus, it provides a very general idea of a collective operation. 5. Specifying Compound Events. In §2 and §3 we have defined an event model, which allows simple behavioral elements of a parallel application to be described. Now we explain how to combine these elements to higher-level compound events. A specification method for compound events representing performance properties of a parallel or distributed application should meet the following requirements: 1. It should be simple even in case of complex compound events. 2. It should allow for an efficient implementation. The first requirement demands the specification of the relationships among the constituent events of a compound event on a very high level of abstraction. The second requirement concerns the efficiency of possible search methods. This is especially important in the face of the huge amount of data typically involved in event tracing. We think that both requirements can be fulfilled on the basis of enhanced event trace models. First, we introduce a general scheme for specifying compound events and then explain how enhanced event trace models, in conjunction with the scheme proposed here, are able to meet the two requirements. A compound event C consists of a set of primitive events (i.e., its constituents). A constituent event is an instance of an event type defined in an enhanced event trace model. The set of constituents can be divided into a set of not necessarily disjoint subsets, which we call the fractions of the compound event: [ C= Ci , I = {0, . . . , n − 1} i∈I
These subsets, or fractions, reflect the logical structure of the compound event. The relationships, by which the fractions are connected, can be expressed using functional dependencies in a form such as the following: [ Ci = fi (C 0 ), C 0 = Cj , J ⊂ I j∈J
The functions fi involved in the specification of a compound event map a set of events onto another set of events from the trace. In their definitions they may use the abstractions provided by an enhanced event trace model (i.e., system state functions and the event attributes including the additional attributes defined during model enhancement). Apart from that, they may access arbitrary events from the event trace and may evaluate conditions over them. Events can be addressed by their absolute position (i.e., the index of an event within the sequence) or their position relative to other events. We do not suggest any notation for specifying these functions; their specifications may be procedural or functional — whichever method fits the needs best.
SPECIFYING PERFORMANCE PROPERTIES USING COMPOUND EVENTS
11
However, to be useful for our purposes this scheme must meet several conditions. First, we must ensure that the corresponding dependency graph is acyclic. Furthermore, each Ci except for one root fraction must have at least one predecessor Cj6=i it depends on, or it may contain only constant events. So every Ci can be calculated from the root fraction by evaluating the functional dependencies. Of course, it is possible that an evaluation step fails, so each fi can also be considered as a predicate. Without loss of generality let C0 denote the root fraction having no predecessor, on which it depends. As a final condition we require C0 to have exactly one element, which we call the root event of the compound event. Note that in most cases all subsets of C will consist of only a single event. Nevertheless, permitting multiple events to be members of such a subset is very useful; for example, in order to make complete system states or make collective MPI operations part of a compound event. To complete our scheme, a predicate is required, which we call the root predicate. The root predicate can be applied to an arbitrary event in order to decide whether it is a possible root event. Now we are ready to present a generic compound event detection algorithm: Algorithm. We wish to locate all occurrences of a compound event C in an event trace E. For all events e ∈ E do the following: 1. Apply the root predicate to e. 2. If successful, instantiate all constituents that are reachable from the root event by evaluating the functional dependencies. 3. Instantiate all constituents that are reachable from the constituents already instantiated. 4. Repeat the previous step until all constituents are instantiated or an instantiation step fails. If all constituents could be instantiated, we successfully found one instance of C. Recall the two requirements from the beginning of this section. An enhanced event trace model provides just those abstractions that correspond to the vocabulary of the programming model being used. By using these abstractions when defining the functions involved in the definition of a whole compound event, it should be possible to produce a simple and understandable specification for most of the compound events representing typical performance properties. A demonstration of this is shown in §6. The efficiency of an implementation of the algorithm, which is addressed by the second requirement, relies heavily on the mechanism used for accessing events. Let us consider the following typical scenario: In order to apply the algorithm described above for locating instances of a compound event, a search tool walks sequentially through the event trace. If an event fulfills the root predicate, the tool will start to evaluate the tree of functional dependencies used for defining the compound event. It will try to access other events from the event trace. As already mentioned, observations show that most of these events belong to the context (i.e., events from the corresponding system states) of the root event or of events belonging to the recent past of the root event. All the tool would be required to do is to track the context of the events it accesses during its sequential walk and to provide efficient buffered access to the context of a relatively small window of the event trace. Experiences gathered with EARL [17] showed that in nearly all cases this approach is very efficient. Of course, the scheme itself does not impose any restrictions on the complexity of the functions fi , so these have to be defined carefully. Nevertheless, our experiences suggest that in the context of performance analysis, the complexity of the required
12
F. WOLF AND B. MOHR
functions is manageable. 6. Example: MPI-Related Compound Events. Now we are ready to show that complex performance properties of MPI applications can be easily represented by applying the previously presented scheme. The properties are specified as compound events, thereby making use of the abstractions defined in §4. Note that all four examples require a performance data granularity for their representation that is provided only by event traces. The fractions Ci of the compound events presented here will mostly contain a single event. We shall indicate this by using a symbol beginning with a lower-case letter. When the fraction contains more than one event, we shall use an upper-case letter instead. 6.1. Late Sender. The first example describes the situation that occurs, when an MPI Recv operation is posted before the corresponding MPI Send has been started (Fig. 6.1). The receiver remains idle during the interval between the two calls instead of doing useful computation. locations
Enter
e2
s1
Exit Send
MPI_Send e1
Receive
root Message
MPI_Recv enterptr sendptr time
wasted
Fig. 6.1. Late sender compound event
This compound event consists of four fractions {root, s1 , e1 , e2 }, each containing only a single event. The root event or fraction (root) is just the event indicating the message arrival (i.e., an event of type Receive). Thus, we have the following root predicate: type(root) = Receive The other three events are the event of sending the message (s1 ), the event of entering the MPI Send region (e2 ), and the event of entering the MPI Recv region (e1 ). They are defined as follows: s1 e1
e2
= root.sendptr ( root.enterptr = f ail s1 .enterptr = f ail
if root.enterptr.region = MPI Recv else if else
(s1 .enterptr.region = MPI Send ∧ e2 .time > e1 .time)
SPECIFYING PERFORMANCE PROPERTIES USING COMPOUND EVENTS
13
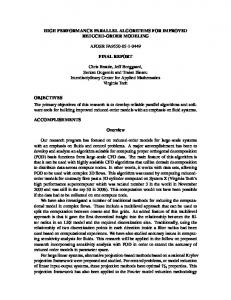
Applying the algorithm to this compound event specification would result in the following sequence of actions. When a potential candidate for the root event has been found by evaluating the root predicate, that is to say, when an event of type Receive has been found, the algorithm traces back the sendptr attribute of the root event to locate the corresponding Send event (s1 ). Now the event of entering MPI Recv (e1 ) is determined by navigating along the enterptr attribute of the root event. To ensure that this event really refers to a region instance of MPI Recv, the region attribute is checked. Event e2 is instantiated in the same manner, but here we consider an additional constraint, which is essential for the whole compound event. The MPI Recv has to be called before the MPI Send. So the two time stamps must be compared. After instantiation of all compound event constituents, a tool can compute the amount of wasted time by subtracting the two time stamps. The compound event described here is a frequently occurring situation of inefficient behavior, which we observed for several real-world applications [18, 20]. Figure 6.2 shows it for a simulation of Czochralski crystal growth [11]. In the right part of the figure, process 7 waits for a message from process 6, which is sent much later.
Fig. 6.2. Late sender in Czochralski crystal growth simulation
6.2. Late Receiver. This compound event refers to the inverse case. The send operation MPI Send blocks until the corresponding receive operation is called. This can happen for several reasons. Either the MPI implementation is working in synchronous mode by default, or the size of the message to be sent exceeds the available MPI internal buffer space and the operation blocks until the data is transferred to the receiver. The behavior is similar to an MPI Ssend waiting for message delivery. The situation is depicted in Fig. 6.3. The definition is similar to the previous compound
14
F. WOLF AND B. MOHR
locations
Enter
e2
s1
Exit Send
MPI_Send e1
Receive
root Message
MPI_Recv enterptr sendptr
wasted
time
Fig. 6.3. Late receiver compound event
event. In particular the root predicate is identical, so we do not show it here again. s1 e1
e2
= root.sendptr ( root.enterptr if root.enterptr.region = MPI Recv = f ail else s.enterptr if (s1 .enterptr.region = MPI Send ∧ e2 .time < e1 .time ∧ = s1 .loc e2 ∈ R (e1 )) f ail else
An important difference to the previous compound event is the condition appearing in the definition of e2 . Of course, e2 .time has to be less than e1 .time, since the receiver has to be later than the sender. In addition, the MPI Send operation must not have finished before the MPI Recv has been called. So we have to look at the region stack of the location, from where the message was sent, and at the time just after the MPI Recv call was posted (Rs1 .loc (e1 )). If e2 is an element of this set, MPI Send and MPI Recv overlap in time. We must admit that this criterion still does not prove waiting of MPI Send due to lack of buffer space with maximum reliability. Nevertheless, it is a necessary condition and it is the strongest that can be proved based on the data available in a typical event trace. A detailed description of the performance problem related to this compound event can be found in [7]. This and the previous example are special cases of a larger class of similar compound events involving alternative MPI point-to-point communication functions. 6.3. Receiving Messages in the Wrong Order. The third example is taken from the Grindstone Test Suite for Parallel Performance Tools [9] and highlights the problem of passing messages in the wrong order. This problem can arise if one process is expecting messages in a certain order, but another process is sending messages that are not in the expected order. In Fig. 6.4 an extreme example is shown: In the left part of the picture, node 1 is processing incoming messages in the opposite order as sent from node 0. Processing them in the order they were sent would not only speed up the program but would also require much less buffer space for storing unprocessed messages. This is shown in the right part of the picture.
SPECIFYING PERFORMANCE PROPERTIES USING COMPOUND EVENTS
15
Fig. 6.4. Passing messages in the wrong order
We model this situation as a message that is sent later but received earlier than another message with the same sender and receiver. For this reason, the compound event consists of two fractions {root, s1 }, each containing only a single event. The root event (root) is the message receipt, the other event (s1 ) is the message dispatch. Again, the root predicate only requires the event type to be Receive. s1 is defined as follows: if ∃e ∈ M root.src,root.loc(root) : root.sendptr s1 = e.time < root.sendptr.time f ail else
The condition on the right side requires that there are older messages in the message queue for traffic between the source and the destination location of the message in consideration. So there have to be messages in transfer that have not been received at the time the current message has been received.
6.4. Unbalanced Barrier. This compound event involves an MPI collective operation. It deals with the frequently occurring situation of reaching a barrier at different points in time and thus introducing undesirable synchronization overhead. The starting point is now the last CollExit event of an MPI Barrier operation instance. This is expressed by the following root predicate using the coll() function: type(root) = CollExit
∧
coll(root) 6= ∅
∧
root.region = M P I Barrier
The compound event consists of three fractions {root, E1 , E2 }: the root event (root), the set of CollExit events belonging to the MPI Barrier instance (E1 ), and the Enter events of that instance (E2 ). E1 is instantiated using the coll() function. Then E2 is computed by tracing back the enterptr attributes of E1 . For convenience, we write
16
F. WOLF AND B. MOHR
E1 .enterptr as a short cut for {e|∃f ∈ E1 : e = f.enterptr}. E1
=
E2
=
coll(root) ( E1 .enterptr f ail
if ∃ei , ej ∈ E1 .enterptr : else
ei .time 6= ej .time
Of course, this compound event matches nearly every MPI Barrier instance because the operation is almost never entered exactly at the same time on different locations. However, instantiating this compound event allows the amount and location of the occurred synchronization overhead to be precisely computed. This compound event is a simple example for a more general problem being associated with MPI all-to-all operations. Since each process involved in such operations has to send to as well as to receive from every other process, no process can leave the operation until the last process has entered it. So there is an inherent synchronization, which can introduce significant waiting times. We observed this phenomenon for a real-world application simulating subsurface water flow [20]. 6.5. Remarks. As we have seen, our approach enables important performance properties of MPI programs to be described easily. The resulting specifications are simple, although all four situations expose a complex structure. The simplicity was achieved by providing abstractions resembling the vocabulary of the MPI programming model. Note that the primary benefit of these examples is a detection mechanism for performance relevant behavior; that is, we have qualitative performance criteria. However, performance analysis also requires a quantification of the inefficiencies being observed. For example, we might be interested in those MPI Recv calls that cause idle times beyond a predefined threshold due to a late sender. In this case, it is easy to augment the late sender specification by an additional condition involving that threshold. Another important goal of performance analysis is locating the source of inefficiencies in the source code of the application. Extending the Enter type by adding call site information, at least in case of function call events, allows the precise determination, for example, of all critical MPI Recv statements with respect to the late sender situation. 7. OpenMP. In this section we briefly discuss how to apply event trace model enhancement to OpenMP. Here we follow an approach similar to which we took for MPI. The location of an event is now the OpenMP thread that generates it. The master thread executes during the whole application, whereas the slaves execute only within parallel regions. For simplicity, we shall not discuss nested parallelism here. The control flow is modeled again in terms of source code regions, so Enter and Exit events, as well as abstractions such as region stacks and the enterptr attribute, are also useful in case of OpenMP. However, in contrast to MPI where all locations start their execution from the very beginning, OpenMP slave threads are usually created after the program has started and they inherit the call stack from their master. So it is reasonable to define the transition rules of the region stack in a way that the master’s stack is inherited by its slaves at creation time. This becomes possible by introducing two additional event types Fork and Join, which denote the moments of team creation and team termination. These event types are generated by the master
SPECIFYING PERFORMANCE PROPERTIES USING COMPOUND EVENTS
17
on entry and exit of a parallel region. The inherited stack can be used, for example, in order to compute idle times caused by sequential execution outside a parallel region. Besides simple API functions, OpenMP defines a rich set of regions having special semantics related to the programming model. Most of them, such as work-sharing constructs, are executed in parallel by all threads of a team. These can be treated in the same way as MPI collective operations, with the difference that the set of locations involved is made up not of the processes of a communicator but of the threads of a team. Therefore, the event model here also contains a special exit event indicating that an OpenMP parallel construct has been left. In pure OpenMP applications without nested parallelism the team is usually made up of the set of all locations. Because of this, the system state for capturing the events belonging to a parallelconstruct instance works similarly to its MPI equivalent. The only difference is that it does not need to distinguish among different groups of locations. However, for hybrid MPI/OpenMP applications this distinction must be made according the MPI process a thread belongs to. One advantage of treating OpenMP collective constructs like MPI collective operations is that it allows synchronization overhead caused by implicit barriers at the end of, for example, parallel loops to be easily identified. In particular, load imbalance situations can be easily detected this way. The OpenMP event model also includes lock synchronization. In particular, we consider the events of acquiring a lock and of releasing a lock. A system state remembers the last event for each lock that changed its state. Based on this system state a lock event is connected to the preceding lock event modifying the same lock by defining an appropriate pointer attribute. Now we are able to determine, whether a thread had to wait for a lock because it was previously owned by another thread. It should be pointed out, that the enhanced event trace model for OpenMP can be combined with what we have already defined for MPI. Thus, it is also possible to cover applications based on a hybrid programming model, which are used in the emerging area of SMP cluster computing. 8. Related Work. An alternative approach to describing complex event patterns was devised by Bates [2]. The proposed Event Definition Language (EDL) focuses on specifying incorrect behavior of distributed systems. It allows compound events to be defined in a declarative manner based on extended regular expressions, where primitive events are clustered to higher-level events using certain formation operators. Relational expressions over the attributes of the constituent events place additional constraints on valid event sequences obtained from the regular expression. Abstraction mechanisms allow the re-use of already defined compound events to form custom hierarchies of events. However, problems arise when trying to describe compound events that are associated with some kind of state. Another method of representing performance properties is applied by Miller and associates [12] in the well-known Paradyn project. In contrast to our approach, Paradyn uses hypotheses and corresponding tests based on a two dimensional matrix called a metric-focus grid. The first dimension represents performance metrics, such as CPU time, blocking time, message rates, I/O rates, or the number of active processors. The second dimension represents individual program components, such as procedures, processor nodes, disks, message channels, or barrier instances. The matrix cells contain the value of a metric with respect to one program component. Espinosa [5] implemented an automatic trace analysis tool KAPPA–PI for evaluating the performance behavior of message passing programs. Here, behavior clas-
18
F. WOLF AND B. MOHR
sification is carried out in two steps. First, a list of idle times is generated from the raw trace file using a simple metric. Then, based on this list, a recursive inference process continuously deduces new facts on an increasing level of abstraction. Finally, recommendations on possible sources of inefficiencies are built from the facts being proved on the one hand and from the results of source code analysis on the other. Vetter [15] performs automatic performance analysis of MPI applications based on machine learning techniques. He traces individual message passing operations and then classifies each individual communication event using a decision tree. The decision tree has been previously trained by microbenchmarks, which demonstrate both efficient as well as inefficient performance behavior. The ability to adapt to a special target system’s configuration helps to increase the technique’s predictive accuracy. A novel approach to the formalization of performance properties and the associated performance-related data is the APART specification language (ASL) [6], which has been developed by the APART Esprit IV Working Group on Automatic Performance Analysis: Resources and Tools. ASL provides a formal notation for defining performance properties related to different programming models. It allows performance-related data items to be referenced by means of an object-oriented data model. In the ASL terminology, a performance property represents one aspect of performance behavior. To test whether such a property is present in an application, an associated condition must be evaluated based on the current performance data. However, the current ASL data model mainly concentrates on profiling data (i.e., summary information) and does not take advantage of the more detailed information contained in event traces. In [19] we propose appropriate extensions to integrate the results presented here into the language. 9. Conclusion. The method we presented in this article allows the automatic detection of complex inefficient behavior in parallel applications. We achieve this by specifying the behavior using compound events occurring in event traces. The specifications themselves can then be used as input of a generic detection algorithm. Our approach relies on an event-based model of program execution, which can be implemented easily using event tracing. Event trace model enhancement establishes a layer of programming-model–specific abstractions above the primitive events, which enables a simple description of performance-relevant compound events in the context of that programming model. The abstractions include system states and links among related events. System states provide context information for an event by representing the activities going on when an event happens. Links pointing from one event to other related events help to easily define a relationship among the constituents of a compound event along a path of relationship primitives. Then, a compound event can be specified on top of these abstractions using functional dependencies connecting its logical parts. These dependencies can be evaluated to prove the specified performance properties. We demonstrated our approach by defining four example compound events representing important performance properties of MPI programs. Although all four compound events are complex, their corresponding definitions are surprisingly short. This is a result of defining them in terms of the MPI programming model. In addition, we outlined how to apply our method to OpenMP. It is an important feature of our concept, that it is applicable to different programming models as well as to combinations thereof.
SPECIFYING PERFORMANCE PROPERTIES USING COMPOUND EVENTS
19
9.1. Outlook. We implemented the abstractions defined in §4 in the form of EARL [17], an extension to common scripting languages like Perl [14], Python [3] or Tcl [16]. EARL also supports OpenMP as described in §7. An appropriate tracing system that permits the collection of traces from hybrid applications on SMP cluster architectures has been completed [20]. The EXPERT [18, 20] performance tool we implemented on top of EARL provides a Python class library for the detection of typical problems affecting the performance of MPI, OpenMP, and hybrid programs. EXPERT is characterized by a separation of the performance property specifications from the actual analysis process. This separation enables a flexible plug-in mechanism, which allows the experienced user to integrate property specifications specific to a distinct parallel application without modifying the tool. EXPERT has been successfully applied to real application traces. Although EXPERT already provides a multitude of typical performance properties, a further extension and refinement of these should be possible and useful. Our implementation performs event trace analysis off-line, after the parallel program has completed. As the analysis is done without human intervention, handling large traces is a minor problem. Our compound event detection algorithm requires only one sequential run through the event trace data and our experiences show that only limited buffering of event and state history is needed. This suggests that it should be possible to use this framework in on-line performance diagnosis environments. Acknowledgments. We would like to thank all our partners in the ESPRIT Working Group APART for their contributions to this topic. In particular, we would like to express our gratitude to Michael Gerndt for many helpful discussions and comments contributing to the improvement of this document. Finally, we would like to thank Christopher Lamb and Craig Soules for spending long hours giving the article better style. REFERENCES [1] A. Arnold, U. Detert, and W. Nagel, Performance Optimization of Parallel Programs: Tracing, Zooming, Understanding, in Proc. of Cray User Group Meeting, R. Winget and K. Winget, eds., Denver, CO, March 1995, pp. 252–258. [2] P. C. Bates, Debugging Programs in a Distributed System Environment, PhD thesis, University of Massachusetts, February 1986. [3] D. M. Beazley, Python Essential Reference, New Riders, October 1999. [4] G. Booch, J. Rumbaugh, and I. Jacobson, The Unified Modelling Language User Guide, Addison Wesley, October 1998. [5] A. Espinosa, Automatic Performance Analysis of Parallel Programs, PhD thesis, Universitat Autonoma de Barcelona, September 2000. ¨ ff, Knowledge Specification for Auto[6] T. Fahringer, M. Gerndt, G. Riley, and J. L. Tra matic Performance Analysis, tech. rep., ESPRIT IV Working Group APART, November 1999. [7] W. Gropp, E. Lusk, and A. Skjellum, USING MPI - Portable Parallel Programming with the Message-Passing Interface, MIT Press, 1994. [8] V. Herrarte and E. Lusk, Studying parallel program behavior with upshot, Technical Report ANL-91/15, Mathematics and Computer Science Division, Argonne National Laboratory, August 1991. [9] J. K. Hollingsworth and M. Steele, Grindstone: A Test Suite for Parallel Performance Tools, Computer Science Technical Report CS-TR-3703, University of Maryland, October 1996. [10] Message Passing Interface Forum, MPI: Extensions to the Message-Passing Interface, Juli 1997. http://www.mpi-forum.org. [11] M. Mihelcic, H. Wenzl, and H. Wingerath, Flow in Czochralski Crystal Growth Melts, Tech. Rep. J¨ ul-2697, Research Centre J¨ ulich, December 1992.
20
F. WOLF AND B. MOHR
[12] B. P. Miller, M. D. Callaghan, J. M. Cargille, J. K. Hollingsworth, R. B. Irvine, K. L. Karavanic, K. Kunchithapadam, and T. Newhall, The Paradyn Parallel Performance Measurement Tool, IEEE Computer, 28 (1995), pp. 37–46. [13] OpenMP Architecture Review Board, OpneMP C and C++ Application Program Interface, October 1998. http://www.openmp.org. [14] S. Srinivasan, Advanced Perl Programming, O’Reilly, August 1997. [15] J. Vetter, Performance Analysis of Distributed Applications using Automatic Classification of Communication Inefficencies, in Proc. of the 14th International Conference on Supercomputing, Santa Fe, New Mexico, May 2000, pp. 245–254. [16] B. B. Welch, Practical Programming in Tcl and Tk, Prentice Hall, second ed., 1997. [17] F. Wolf and B. Mohr, EARL - A Programmable and Extensible Toolkit for Analyzing Event Traces of Message Passing Programs, in Proc. of the 7th International Conference on HighPerformance Computing and Networking (HPCN’99), A. Hoekstra and B. Hertzberger, eds., Amsterdam (The Netherlands), 1999, pp. 503–512. , Automatic Performance Analysis of MPI Applications Based on Event Traces, in Proc. [18] of the European Conference on Parallel Computing (Euro-Par), Munich (Germany), August 2000, pp. 123–132. [19] , Specifying Performance Properties Using Compound Runtime Events, Tech. Rep. ZAMIB 2000-10, ESPRIT IV Working Group APART, Research Centre J¨ ulich, August 2000. , Automatic Performance Analysis of SMP CLuster Applications, Tech. Rep. ZAM-IB [20] 2001-05, Research Centre J¨ ulich, 2001.