Thus, the technique used to debug sequential programs - re-executing the code with instrumentation to provide infor- mation about program variable values - is ...
Parallel Program Debugging with On-the-fly Anomaly Detection Robert Hood
John Mellor-Crummey
Ken Kennedy
Department of Computer Science Rice University P. 0. Box 1892, Houston, TX 77251-1892 ({hood, ken, j ohnmc}Qrice . edu)
Abstract
are interleaved. These errors are often referred races” or “access anomalies”.
We describe an approach for parallel debugging that coordinates static analysis with efficient on-the-fly access anomaly We are developing on-the-fly instrumentation detection. mechanisms for the structured synchronization primitives of Parallel Computing Forum (PCF) Fortran, the emerging standard for parallel F&ran. For programs without nested parallelism, it is possible to bound the cost of detection to a small constant at each shared access and thread creation point-in preliminary experiments this overhead is less than 40%. Our instrumentation techniques guarantee that we can isolate schedule-dependent behavior in a scheduleindependent fashion. The result is that a single instrumented execution will either report sources of schedule-dependent behavior, or it will validate that all executions of the program on the same data compute the same result. When an instrumented execution is being used solely to find sources of schedule-dependent behavior, its cost can be reduced by slicing out computations that do not contribute to race conOur approach to debugging is particularly wellditions. suited for inclusion in a parallel program development environment; we describe our ongoing efforts to incorporate it in the ParaScope environment.
Because the values computed during a program execution and even the control 0ow path used in a particular thread of control can depend on access interleavings, re-running the program may not always produce the same results, making it difficult for a programmer to isolate data races. To compound the problem, inserting instrumentation in a program can perturb its execution schedule enough to make errors disappear. Thus, the technique used to debug sequential programs re-executing the code with instrumentation to provide information about program variable values - is ineffective for finding data races in parallel program executions. In this paper, we describe a technique that tackles these issues in the context of debugging scientific programs written in a parallel dialect of Fortran.
1
Introduction
Parallel programs for shared-memory multiprocessors can be very hard to debug. In addition to the traditional logic bugs of sequential code, parallel programs can exhibit scheduledependent bugs, which arise on some, but not all, execution schedules. The principal cause of such errors is unsafe or inadvertent communication through shared variables. If one thread of execution changes a shared value concurrently with another thread’s access to that value, the program’s behavior may depend on the order in which the accesses to the value This work was supported
in part by the National
ration through its research contracts with the Department Science at Rice University.
.OO0 IEEE
A Taxonomy Techniques
of
Parallel
Debugging
A number of different strategies have been proposed for isolating data race conditions in parallel programs. In order to differentiate our technique from previous methods, we offer the following taxonomy of approaches.’ One approach for isolating data race conStatic methods. ditions in a parallel program is to use classical dependence analysis techniques [l, 3, 41. These techniques report dependences for all potential race conditions that may occur during parallel execution. Any program that does not exhibit a dependence whose endpoints can be executed in either order (because they are in concurrent threads) is guaranteed to be free of race conditions at execution time. In the general case, however, dependence testing is an undecidable problem (51; th ere f ore, dependence analysis systems can only produce conservative approximations. That is they may report dependences for data races that cannot actually occur, but they will not fail to report a dependence for a
Science Founda-
tion under Grants CCR-8809615 and ASC-8518578, and by IBM Corpo-
CH2916-5/90/0000/0074/$01
1.1
to as “data
of Computer
‘We do not include ad hoc schemes such as using naive extensions of sequential debuggers to disect parallel program executions. Typically these methods provide a fairly low level of abstraction and inserted breakpoints affect the outcome of data races in thsexecution.
1.2
possible data race. Unfortunately, our experience with static analysis tools has convinced us that the number of false positives is too high for programmers to rely exclusively on static methods for isolating schedule-dependent bugs.
Our
Approach
Our approach to the access anomaly detection problem involves coordinating both static analysis and on-the-fly techniques. Without using static analysis, an on-the-fly technique must assume that every access to each shared variable is potentially anomalous and check it at run time. To reduce the amount of run-time checking, we use static program analysis to prove that no anomalies Can result from particular accesses. A potential access anomaly or data race must correspond to some carried data dependence in a parallel loop or a dependence with its endpoints in code sections that can execute concurrently. A very thorough analysis of dependence, such as the one we employ in PFC [2] and ParaScope [4], can significantly reduce the number of races that must be checked at run time.
This category includes all techPost-mortem methpds. niques used to discover errors in an execution following its termination. These techniques can be further classified into those that require insertion of instrumentation code into a program before execution and those that do not. Intrusive. In this approach a program is instrumented to produce a trace log during execution. After an execution completes, the log can be examined for evidence of data races, or used reconstruct more detailed information about the program’s behavior [ll, 121. Unfortunately, collecting traces can affect the schedule taken during execution. This can make some errors difficult or impossible to pinpoint unless tracing is always enabled. It may be impractical to trace all executions, however, since sufficiently detailed traces of shared-memory parallel programs with fine-grain sharing can be enormous.
In addition to using static analysis to reduce the amount of run-time checking, we have also devised a new technique for on-the-fly anomaly detection that appears substantially more efficient than existing approaches for a large class of programs. With our technique, the cost at each instrumentation point is bounded by a small constant for parallel Fortran programs that use only a single level of parallelism (i.e., no nested parallel constructs) and use only the structured synchronization constructs in PCF Fortran’ in a disciplined way; for programs with nested parallelism, the overhead at instrumentation points increases to O(log N) when in parallel regions nested N levels deep. The efficiency of our on-the-fly monitoring technique comes at the price of being unable to handle programs that use unstructured synchronization.
Unintrusive. In this approach a program is first executed unmodified. If the user suspects a schedule-dependent problem, the system assists in isolating the bug in a subsequent phase. One method for doing this is to use reexecution with &adversary schedules” derived from static information [6]. Such schedules force a bug to appear by employing schedules that are likely to give rise to the race condition corresponding to a suspected dependence. The disadvantage of this approach is that there may be an exponential number of schedules that need to be tested.
To take full advantage of our techniques for anomaly detection, we observe that with the proper treatment of asynchronous coordination using locks or critical sections, onthe-fly techniques can be used to detect sources of scheduledependent behavior in a schedule-independent manner. If on-the-fly analysis of a single execution reports no potential anomalies for a given input data set, then no data races exist for any program execution using that input data set. This property enables use of on-the-fly techniques in a postmortem fashion to verify that a program’s results during a production run with a particular input data set were not schedule-dependent. If the results from a full-speed production run appear questionable, the programmer can invoke a debugger that mechanically generates and runs a version of the program instrumented to detect and report data races on the fly. During execution of the instrumented program, the system is guaranteed to report any race conditions that could have caused schedule-dependent behavior of the original program.
Strategies in this category are particularly appealing to those who must debug large-scale scientific programs because no overhead is incurred until a bug arises - the program can be run at full speed for “production” computations. These methods involve instrumentOn-the-fly methods. ing programs with code to detect data races (usually called “access anomalies” in this context) dynamically, in a manner analogous to subscript checking in sequential code. A important advantage of on-the-fly techniques over trace-based approaches is that they avoid the need for recording enormous execution logs. On-the-fly techniques detect data races by keeping track of the threads that access each shared data location, and reporting an error if one thread of execution attempts to write a location concurrently with another thread’s access to that location [7, 8, 13, 161. On-the-fly techniques can detect all access anomalies that take place during a particular execution. In the general case, however, these techniques can be quite expensive-Dinning and Schonberg report on-the-fly monitoring overheads ranging from 150% to over 1000% for a test suite of programs using their “task recycling” technique [8].
When employing on-the-fly analysis in a post-mortem phase, we can improve the efficiency of the instrumented program by observing that the aim of the run is to report races, ‘The Parallel Computer Forum (PCF) is a working group consisting of representatives from academia, government and manufacturers of parallel computing equipment. For the past year and a half it has been working to standardize Fortran extensions for shared-memory parallel computers[l4,
75
151.
not to produce answers. We can use program slicing [18] to eliminate any calculation or operation that cannot affect the detection of data races in the program. For example, output of final results falls into this category.
information remains O(T) except for cases in which there is no nested parallelism and no synchronization between parallel threads. Similarly, English-Hebrew labelling has a potentially high cost of O(NT) time per variable access, where N is the maximum nesting depth of the parallel constructs, and a cost of O(NT) t ime at each thread synchronization point.
In the next section, we describe our on-the-fly anomaly detection mechanism in detail and compare it to existing approaches. Section 3 describes our ongoing efforts to integrate support for on-the-fly anomaly detection into the ParaScope parallel programming environment and reports some preliminary experimental results.
2
Detecting Anomalies
Parallel
To reduce the cost of on-the-fly methods, we sacrifice the generality of the programming models handled by the task recycling and English-Hebrew labelling techniques and instead focus on programs with a single level of fork-join parallelism that use only structured forms of synchronization, such as synchronization based on ordered sequences. Most parallel Fortran programs, especially those generated using automatic parallelization techniques, exploit only a single level of parallelism and typically employ regular synchronization patterns, so we expect our techniques to apply to a large class of programs. Under the above restrictions, we have devised a technique that costs only O(1) time per variable access, and O(1) time at each thread synchronization point.
Access
The significance of access anomalies in parallel program executions was first recognized by Bernstein [5]. He described a set of conditions, now known as Bernstein’s Conditions, that a parallel program execution must satisfy to guarantee deterministic behavior. Dinning and Schonberg [7] concisely formulate these conditions in terms of READ and WRITE sets. Each sequence of instructions in a parallel program has an associated READ set and WRITE set. The READ set for an instruction sequence contains all of the variables that are read by statements in the sequence; similarly, the WRITE set contains all variables that are written. A parallel access anomaly exists in a program if any two potentially concurrent instruction sequences Si and Sj do not meet the following conditions:
READ(Si) WRITE(Si) WRITE(Si)
n WRITEfSj) II READ(Sj) n WRITE(Sj)
In the presence of access anomalies, the gram execution depends on the particular struction sequences. For this reason, the anomalies is typically viewed as an error, terest for debugging.
= = =
In this section we describe our technique for maintaining variable access histories and concurrency information during a program execution. Like Dinning and Schonberg [S], our technique assigns a tag during execution to each program block, where a block refers to a dynamic execution of a sequence of instructions by a single thread. Internally, a block contains no thread creation (fork), destruction (join), or synchronization (SENDand WAIT)primitives, although a block may begin with a WAIT,or a join operation, and end with either a SENDor a fork operation.3 For each shared variable access (either a read or a write), the tag of the block performing the access is recorded in a list associated with the variable. Also, the variable’s tags are checked to make sure that the current access does not conflict with any previous or pending accesses. These tests are performed by comparing the variable’s tags with annotations that indicate which tag values the current block may safely see; seeing any other tag value indicates an access anomaly.
0 0 I
behavior of a prointerleaving of inpresence of access and thus is of in-
2 .l
To detect access anomalies while a program is executing, two types of information must be available: (a) which variables are accessed by each instruction sequence, and (b) which instruction sequences are potentially concurrent. Dinning and Schonberg describe two techniques for maintaining this information during a program execution: task recycling, and English-Hebrew labelling [8, 131. While both techniques are very general and are powerful enough to handle programs with nested fork-join parallelism and unstructured pairwise synchronization, this generality comes at a price. With task recycling, it may cost as much as O(T) time per variable access (where T is the maximum amount of concurrency ever attained by the program) to maintain access history information, and as much O(T) t ime at each thread synchronization point to maintain concurrency information. Dinning and Schonberg show how the cost to maintairi variable access information can be reduced to O(1) while catching almost all anomalies [7]; h owever, the cost of maintaining concurrency
Maintaining Lists
Shared
Variable
Access
To detect access anomalies on the fly, it is necessary to maintain two lists for each shared variable: one of blocks that have read it and one of blocks that have written it. The tags in these lists are used to detect when a previous or pending access to a variable by some block conflicts with an access by the current block. To report all anomalies that occur during an execution, complete lists of accesses to each variable would need to be maintained during any interval in the execution where parallelism is possible. Each time a block accesses a variable, its access lists would need to be searched for tags 3SEllD-UIT
PCFstandard
synchronization was described in an early draft of the
[14]. In the newest draft, this has been generalized into POST-YAIT operations on ordered sequences [15]. A preliminary investigation leads us to believe that we can accommodate disciplined uses of this more general construct with a similar approach.
76
A drawback of our wait-free instrumentation protocols is that anomaly reports possible using these protocols vary in precision, depending on the number and types of accesses that occur. This difficulty can be avoided by using a variant of our protocol in which a variable’s access history is locked while it is being inspected and updated by the instrumentation protocols. However, locking protocols serialize the checking of concurrent reads to a variable which can adversely affect program performance. In the interest of making our instrumentation as inexpensive as possible, we examine the properties of our wait-free protocols.
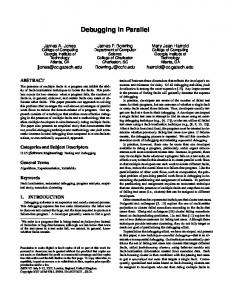
prevread = fetch-and-store(Rv,curblock) if LC(prevread) then Cv = prevread if LC(Wv) then report WRITE-READ access anomaly Figure 1: Instrumentation
for a Read of Shared Variable
V
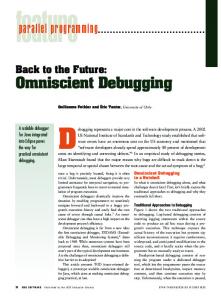
prevurite = fetch-and-store(Wv,curblock) if LC(prevwrite) then report WRITE-WRITE access anomaly if SP(Rv) then Cv = 0 elseif LC(Rv) or Cv != 0 then report READ-WRITE access anomaly Figure 2: Instrumentation
for a Write of Shared Variable
Anomalies result from concurrent execution of both ends of a data dependence. Three types of anomalies must be considered: WRITE-WRITE anomalies (a pair of concurrent writes to the same shared variable), WRITE-READ anomalies (a read of a shared variable detects a concurrent write), and READ-WRITE anomalies (a write to a shared variable detects a concurrent read). A temporally overlapping read and write to the same variable may be detected as both a WRITE-READ and a READ-WRITE anomaly by the reader and writer, respectively. For expository purposes, we refer to the access that detected an anomaly as the sink of the anomaly, and the other contributing access as the source. For a WRITE-WRITE or a WRITE-READ anomaly, our wait-free protocol can identify the statement representing the sink of the anomaly and the code block for the source of the anomaly. Static information about the statements in the code block can be used to report the set of statements that could have served as the source of the anomaly. For a READ-WRITE anomaly, it is usually possible to provide the same sort of report; however, in the presence of multiple concurrent reads there exists a (low probability) pathological interleaving of the wait-free protocols we use to update Rv and Cv that can cause loss of information about the anomaly source. In this case our wait-free protocol can report only the sink of the anomaly (a write) and indicate the presence of multiple concurrent reads. Use of a locking instrumentation protocol avoids this difficulty since access history updates by concurrent reads are serialized. An additional benefit of a locking protocol is that it enables precise reporting of both the source and the sink of an anomaly. With locking, additional information can easily be maintained with each tag indicating the statements that initiated the accesses; using a wait-free protocol, it it much more difficult. If the lack of precision of an anomaly report proves troublesome, the program can always be executed again using a more costly locking protocol which can provide more precise anomaly reports.
V
that indicate conflicting concurrent accesses. Unfortunately, the cost of maintaining and searching complete lists of accesses for each variable is prohibitive. Our technique for detecting access anomalies limits the access history maintained for each shared variable V to the last writer (WV), the last reader (Rv), and a recent reader for which a concurrent read was detected (Cv). The motivation for limiting access histories is to reduce the overhead for detecting anomalies during execution. While abbreviating access histories in this fashion reduces the completeness of anomaly reports, for programs with no nested parallelism, at least one anomaly report will be generated for each variable for which an access anomaly occurs during execution. For nested parallelism, additional information needs to be recorded (see section 2.3. Our preferred method for maintaining abbreviated access histories for shared variables requires no locking and is waitfree.4 We maintain access histories using widely available atomic operations supported in hardware: fetch-and-store, read, and write.’ Figure 1 shows the protocol used by readers to update a variable’s access history and check for anomalous accesses. The quantity curblock is the tag value for the current block validating the variable access. The predicate LC(x) is true if the block with tag x is logically concurrent to the current block; x is logically concurrent with curblock unless x = curblock, or program control flow ensures that x sequentially precedes curblock. Figure 2 shows a similar protocol used by writers. The predicate SP(x) is true if block x sequentially precedes curblock. The protocols shown in figures 1 and 2 are respectively used to instrument each read and write access that may cause an access anomaly for a shared variable. In the following section, we show how tags can be dynamically assigned to instances of blocks of code in PCF Fortran programs in such a way that SP(x) and LC(x) can be evaluated efficiently.
2.2
Assigning
Tag Values
to Blocks
During execution, our technique assigns a unique integer tag to each dynamic code block. For the instrumentation overhead per variable access to be acceptable, it must be easy to test a pair of tags to see if they represent blocks that may execute concurrently. Here we describe how we assign tags to blocks in PCF Fortran program executions with a single
4An oneration on a data structure is said to be wail-free if it is guaranteed to complete in a finite number of steps, independent of whatever other operations may be in progress, or their relative speeds. 5Fetchand-store is a register-to-memory swap, often known as soap or rmem.
77
level of parallelism efficiently.
so that SP(x) and LC (x) can be evaluated
PARALLEL DO Loops. This construct defines a parallel loop in PCF Fortran. To support testing for parallel access anomalies, each instance of the loop body must be assigned a unique tag. The logical parallelism of a parallel loop (i.e., the number of iterations) can be determined symbolically before the loop begins execution as 1 + ((upper - lower) div stride)
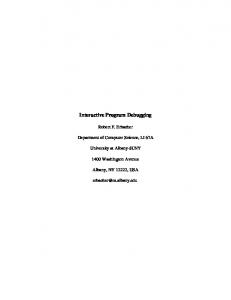
The dynamic structure of a parallel program execution is naturally modeled as a partial order execution graph where vertices represent instances of dynamic program blocks and edges represent temporal ordering based on Lamport’s happened-before relation [lo]. Parallel Fortran programs are constructed as a sequence of serial and parallel sections; serial sections in the program correspond to articulation points in the graph. Figure 3 shows a fragment of a PCF Fortran program and its corresponding graph representation. Nodes in the graph are aligned with the static fragments of code that they represent. Access anomalies exist during a program execution if two blocks access a variable and neither block is an ancestor of the other in the program’s execution graph. Conceptually, one method for evaluating the concurrency predicate SP(x) would be to maintain the graph representation during a program’s execution and search for x as an ancestor of the current block; however, using this scheme, evaluation of the concurrency predicate would be costly and would depend on the size of the execution graph.
where lower and upper are respectively the lower and upper bounds of the loop index variable, and stride is the amount the index variable is advanced after executing each instance of the loop body. Iteration current of the loop is assigned tag loopbase + I+
(( current
- lower)
div stride)
where loopbase is the highest unassigned tag value before entering the loop. Without nested parallelism or synchronization between interations of the loop body, the predicate LC(x) can be evaluated as described earlier. PARALLEL DO ORDERED Loops. These loops are similar to PARALLEL DO loops, except that loop iterations are guaranteed to be initiated in order, and that SEND-WAIT synchronization can be used inside the loop body to protect forward dependences between loop iterations. Use of SEND and WAIT inside a parallel loop body logically separates the loop body into a sequence of blocks. For a loop in which Ic SEND-WAIT synchronization variables are used, each loop body instance dynamically partitions into 21c+ 1 blocks. For a PARALLEL DO ORDEREDloop, the number of tags needed is (# loop iterations) x (# blocks per iteration). Figure 3 shows a tag assignment for a DO ORDERED loop that uses SEND-WAIT synchronization. The semantics of PCF Fortran dictate that updates made to variables in a block ending with a SEND on a synchronization variable s are visible in to the blocks in subsequent iterations that begin with WAIT(s). In terms of our abstract model, a block ending with SEND(s) is an ancestor of the block in the subsequent iteration that begins with WAIT(s). The regular structure of the relationship between blocks enables us to compute in constant time the values of the tags for all blocks in the parallel loop that are visible. The nodes in the graph that correspond to blocks in the parallel loop can be thought of as elements in a grid (see the layout of the graph in figure 3). Knowing the row length of the grid (the number of iterations in the loop) and the tag value assigned to the first element, for any tag we can compute its row and column index. Ancestor relationships can be computed in constant time by comparing the row and column indices for a pair of blocks. If the row and column indices of one block are less than or equal to the corresponding indices for the other block, then the first block is an ancestor of the second. These tests can be evaluated in constant time. To account for the block precedence constraints induced by the SEND-WAIT synchronization, we augment LC(x) to check if x is an ancestor of the current block using this “grid-based”
Fortunately, it is possible to assign tags to blocks in an execution of a PCF Fortran program that uses a single level of parallelism so that SP(x) can be evaluated in constant time, without using more than a constant amount of time to update concurrency information at each block entry and exit. The tag value dynamically assigned to each block in a program execution using our technique corresponds to a node numbering equivalent to a pre-order breadth first traversal of the program’s execution graph.6 Figure 3 shows such a node numbering for a parallel loop example.7 Given our prescribed assignment of tags to blocks in the execution graph, the tag value assigned to each serial section is strictly greater than the tag value assigned to each of the blocks that precedes it in the execution. This simplifies evaluation of the concurrency predicate SP(x) since information about which tags correspond to ancestors preceding the current parallel construct is summarized by the tag of the most recent serial section. For parallel Fortran programs without nested parallel constructs and SEND-WAIT synchronization, all blocks in a parallel region are immediate descendants of a serial section. Thus, for programs with no nested parallelism, SP(x) can be evaluated with a single integer comparison between z against the tag of the most recent serial section. The basic formulation for LC(x) = (x # curblock) A %P(x) (i.e., x is not the current block and does not sequentially precede the current block). Below we describe how tag assignments and concurrency relationships are computed for blocks on the fly for PCF Fortran programs with no nested parallelism. Also, we describe how to augment the definition of LC(x) ‘to account for block precedence induced by SEND-WAIT synchronization. ‘% general, such a numbering of blocks is always possible on the fly for PCF Fortran with no nested parallelism. 7The tag value of 47 for the initial node in the loop was chosen arbitrarily.
78
. . i--fmq
(PARALLEL DOORDEREDI=1,41
SEND(a)
Figure 3: A Fragment
of PCF Fortran and its Execution
test. Two blocks in a DO ORDEREDloop are logically rent only if they fail to satisfy this test.
concur-
Graph Representation
the value of the base tag of the region. Parallel loop and section worksharing constructs may be nested inside a PARALLEL REGION by augmenting LC(x) to return false if x is equal to the processor local tag maintained for the enclosing parallel region.
In the newest draft of the PCF standard [15], SEND-WAIT synchronization has been replaced with more general POST-WAIT operations on ordered sequences. We are investigating how similar techniques can be applied to handle the common POST-WAIT synchronization idioms.
2.3
Extensions
for Nested
Parallelism
One of the key efficiencies of our technique for single level parallelism is that determining whether a block z is logically concurrent with the current block is often as simple as comparing z against the tag of the enclosing serial section. When nested parallelism is present, LC(x) is more costly to evaluate. In particular, when executing in a block nested inside N enclosing levels of parallelism, an ancestor block exists at each of the N levels. Keeping a stack of ancestors, one for each nesting level, enables LC(x) to be evaluated correctly. Since the tags are monotonically increasing from outer to inner nesting levels, Locating a tag on this stack to assert TLC(X) can be accomplished using binary search at a cost of O(log N). In addition, detecting anomalies in programs with nested parallelism using our techniques requires that a separate incarnation of Cv be present for each nesting level. This is necessary to keep concurrent reads in inner parallel constructs from superceding concurrency information at outer nesting levels. Following termination of inner parallel constructs, ranges of tags used by inner parallelism must be maintained since these blocks are legal ancestors subsequent code in enclosing blocks, For each individual parallel construct it is possible to pre-compute how many tags are needed before the construct begins execution; thus, each construct can be allocated a contiguous range of tags which can be summarized by its endpoints. It is possible to limit the number of ranges we must maintain to one per nesting level only for parallel Fortran programs for which it is possible to pre-allocate tags for an entire nested parallel construct at the outermost level. It is not necessary to know the precise number of tags that will be necessary inside a nested parallel construct; an upper
PARALLEL SECTIONS. This PCF Fortran construct is used to obtain heterogeneous parallelism. A unique tag is assigned to the body of each SECTION as a fixed offset from the the first tag available when the construct is entered during execution. The PARALLEL SECTIONS construct allows specification of an acyclic set of constraints among the SECTIONS. Without nested parallelism or ordering constraints between the SECTIONS, the concurrency predicate LC(x) can be evaluated inside a SECTION block in constant time as described earlier. To support constant time evaluation of LC(x) when ordering constraints are used, at compile time a lookup table can be computed to enable tag comparisons between SECTIONS. For each pair of offsets (x,y) from the base tag, the table indicates whether SECTION x precedes SECTION y.E We incorporate the ordering constraints between SECTIONS into our instrumentation protocol by having LC(x) inspect the appropriate boolean table. PARALLEL REGION. The PCF Fortran PARALLEL REGION construct introduces per-processor parallelism into a program. Code in a parallel region may be executed in parallel by each processor available for the program execution. The amount of logical parallelism that can appear in a parallel region is bounded by P, the maximum number of processors available. Each processor entering the region can compute its own tag for the enclosed block by adding its virtual processor number to ‘If table size becomes a concern, it is likely that a perfect hash function could be generated to enable use of a more compact table.
79
Execution. The instrumentation techniques outlined in section 2 allow us to provide two kinds of debugging assistance to a programmer. While a program is under development, it is possible to use the on-the-fly anomaly detection scheme full time. This will help isolate schedule dependent behavior during the period of parallelization. In addition to the safety net provided during development of a parallel program, using a post-mortem scheme we can also provide some debugging support for production codes as well. If scheduledependent behavior is observed during a production run, an execution of the instrumented program on the same data will be guaranteed to find schedule-dependent behavior as long as the control flow of the program is independent of values computed inside of unordered critical sections. Finding a bug in a production code might proceed as follows: l
l
call InitPDO(1, n, 1) doacross local(j), share(n, index, f, dim, S, S-tag, f-tag) do 13000 i = 1, n call EnterPDO(i) do 12000 j q 1. n call UriteCheck(S-tag(index(i), j)) call ReadCheck (S-tag(index(O), j)) S(index(i),j) q 1.6dO * S(index(O),j) * 0.6dO * S(inder(i),j) cant inue 12000 call UriteCheck(f-tag(index(i))) itindex( = value(index(i), n, dim. S, S-tag) 13000 continue
C$ CM
Figure 4: An instrumented tional kernel of search.
While executing a program, the user suspects that its behavior is schedule-dependent. At that point he invokes the debugger. In response to that request the debugger following actions: - An annotated program is constructed in the previous section. - The instrumented
program
performs
the
as described
is recompiled.
For example, in search the parallel loops that make up the computational kernel of the program manipulate S, a twodimensional array of double precision values that contains vertices in a simplex, and compute a vector f of double precision function values. A representative parallel loop and its associated instrumentation is shown in figure 4. The call to InitPDO allocates a unique tag for each instance of the parallel loop body. The call to EnterPDO computes the tag used for a loop body instance. Calls to ReadCheck and WriteCheck use the protocols described in figures 1 and 2 to check for access anomalies. Because of the use of an index array, static analysis was incapable of determining conclusively that no anomalies existed in this loop and instrumentation was thus required. The function value has a sequential loop that references values in S. Since values in S are also written inside the parallel region, accesses to S by function value must be also be instrumented. This was done by passing S-tag into value and inserting ReadCheck calls in the sequential loop of value at the points where it accessed S.
- If desired, each anomaly can be treated as a breakpoint. This would enable the user to investigate the program state at the anomaly, before having execution proceed to the next one.
3.2
The anomaly report collected during the instrumented run can be viewed within ParaScope’s dependence-based source editor. The run-time detection of an anomaly proves the existence of a dependence reported by static analysis. Thus, the same mechanism in the source editor that is used for viewing dependences can be used for displaying access anomalies.
Experimental
loop from the computa-
For each such variable, it allocates l&bytes of tag storage.g At any point in the program where a potentially anomalous access to a variable may occur, the system inserts code to update the variable’s tag information and check for access anomalies. If a dependence endpoint was a call site within a parallel loop, we propagated the instrumentation into the body of called subprogram manually. When our implementation is complete, this will be handled automatically.
- The instrumented program is re-executed on the same input data, with all detected anomalies collected in a summary report.
l
parallel
Results
In order to test the efficiency of our anomaly detection mechanisms, to date we have performed experiments on two parallel programs using a Sequent Symmetry. The first program, seaxh, is a multi-directional search program that uses a direct search method for finding a local minimizer of an unconstrained minimization problem [17]. The other, finite, is the finite element code that was tested by Dinning and Schonberg [s].
Results for search. Figure 5 shows the performance of several versions of sea& on a variety of problem sizes. The solid line shows the performance of the uninstrumented sequential version of the program (created by directing the compiler to ignore the signifsOnly 12 bytes are necessary to implement our concurrent protocol (a 32-bit quantity for quantity for WV, Rv, and Cv), but we trade space for time and since indexing of tag variable arrays is faster if the the size of tag information is a power of 2. If a locking protocol for tag update and comparison is used, one may optionally use additional storage to record an indication of what statement initiated the variable reference to enable the anomaly source to be pinpointed.
We used a semi-automatic prototype system to insert the instrumentation code. The system automatically inserts declarations for auxiliary storage to store the run-time access history information for any variable that dependence analysis indicates might be involved in a parallel access anomaly.
80
PI
Alexander, R. (1977): Diagonally implicit Runge-
Kutta methods for stiff ODES, SIAM J. Numer. Anal. 14, 1006-1021. PI BeUen, A. & M. Zennaro (1989): Parallel algorithms for initial-value problems for difference and differential equations, J. Comp. Appl. Math. 25, 341-350. [31 Butcher, J.C. (1987): The numerical analysis of ordinary differential equations, Runge-Kutta and generallinear methods,Wiley, New York. [41 Crouzeix, M. (1975): Sur l’approximation des equations differentielles optkationnelles line&irespar des methodes de Runge-Kutta, Ph. D. Thesis, Universid de Paris. El Dekker, K. & Verwer, J.G. (1984): Stability of Runge-Kutta methods for stiff nonlinear differential equations, CWI Monograph 2) North-Holland, Amsterdam. El Deufihard, P. (1985): Recent progress in extrapolation methods for ordinary differential equations, SIAM Review 27,505-535. PI Enright, W.H., Hull, T.E. dz Lindberg, B. (1975): Comparing numerical methods for stiff systems of ODES,BIT X,10-48. WI Fehlberg, E. (1968): Classicalfifth-, sixth-, seventh-, and eighth-order Runge-Kutta formulas with stepsize control, NASA Technical Report 287, extract published in Computing 4 (1969), 93-106. PI Gear, C.W. (1987): Parallel methods for ordinary differential equations, Report No. UIUCDCS-R-871369, University of Illinois, Urbana Champaign, Urbana. IN1 Gladwell, I. (1989): IBM Workshop on Numerical Software in Garrnisch (FRD), August 1989. 1111Gragg, W.B. (1964): Repeated extrapolation to the limit in the numerical solution of ordinary differential equations,Thesis,Univ. of California. Hairer, E. (1978): A Runge-Kutta method of order WI 10, J. Inst. Math. Applies. 21,47-59. P31 Hairer, E. (1989): NUMDIFF 5 meeting in Halle (GDR), May 1989. II41 Hairer, E., Lubich, Ch. & Roche, M. (1988): Error of Runge-Kutta methods for stiff problems studied via differential algebraic equations,BIT 28,678-700.
rw Hairer, E., Norsett, S.P. & Wanner, G. (1987):
Solving ordinary differential equations I. Nonstiff problems, Springer-Verlag, Berlin-Heidelberg-New York-London-Paris-Tokyo.
[16] Houwen, PJ. van der & Sommeijer, B.P. (1990): Parallel iteration of high-order Runge-Kutta methods with stepsize control, J. Comp. Appl. Math. 29, 111-127. [17] Houwen, PJ. van der& Sommeijer, B.P. (1990): Iterated Runge-Kutta methods on parallel computers, Report NM-R9001, Centre for Mathematics and Computer Science, Amsterdam (submitted for publication). [18] Houwen, PJ. van der, Sommeijer, B.P. & Couzy, W. (1989): Embedded diagonally implicit Runge-Kutta algorithms on parallel computers, Report NMR8912, Centre for Mathematics and Computer Science,Amsterdam(submitted for publication). [19] Hull, T.E., Enright, W.H. , Fellen, B.M. & Sedgwick, A.E. (1972): Comparing numerical methods for ordinary differential equations, SIAM J. Numer. Anal. 9,603-637. [20] Iserles, A. & Norsett, S.P. (1988): On the theory of parallel Runge-Kutta methods, Report DAMTP 1988MA12, University of Cambridge. c21] Jackson, K. & Norsett, S.P. (1988): Parallel RungeKutta methods,to appear. [22] Kaps, P. (1981): Rosenbrock-type methods, in: Numerical methods for stiff initial value problems (eds.: G. Dahlquist & R. Jeltsch), Bericht Nr. 9, Inst. fllr Geometric und Praktische Mathematik der RWTH Aachen. [23] Lambert, J.D. (1973): Computational methods in ordinary differential equations, John Wiley, New York. [24] Lie, I. (1987): Some aspectsof parallel Runge-Kutta methods,Report No. 3187,University of Trondheim, Division Numerical Mathematics. [25] Norsett, S.P. (1974): Semi-explicit Runge-Kutta methods, Report Mathematics and Computation No. 6/74, Dept. of Mathematics, University of Trondheim. [26] Norsett, S.P. & Simonsen, H.H. (1989): Aspectsof parallel Runge-Kutta methods, in: Numerical methodsfor ordinary differential equations,A. Bellen, C.W. Gear & E. Russo (eds.), ProceedingsL’Aquila 1987, Lecture Notes in Mathematics 1386, SpringerVerlag, Berlin. [271 Stetter, H.J. (1973): Analysis of discretization methodsfor ordinary differential equations,SpringerVerlag, Berlin-Heidelberg-NewYork. [28] Watts, H.A. dc Shampine, L.F. (1972): A-stable block implicit one-stepmethods,BIT 12,252-266.