749
Parameter estimation in modelling the dynamics of fish stock biomass: are currently used observation-error estimators reliable? Y. Chen and N. Andrew
Abstract: Production models are used in fisheries when only a time series of catch and abundance indices are available. Observation-error estimators are commonly used to fit the models to the data with a least squares type of objective function. An assumption associated with observation-error estimators is that errors occur only in the observed abundance index but not in the dynamics of stock and observed catch. This assumption is usually unrealistic. Because the least squares methods tend to be sensitive to error assumptions, results derived from these methods may be unreliable. In this study, we propose a robust observation-error estimator. We evaluate the performance of this method, together with the commonly used maximum likelihood method, under different error assumptions. When there was only observation error in the abundance index, maximum likelihood tended to perform better. However, with both observation and process errors, maximum likelihood yielded much larger estimation errors compared with the proposed method. This study suggests that the proposed method is robust to error assumptions. Because the magnitude and types of error cannot often be specified with confidence, the proposed method offers a potentially useful addition to methods used to fit production models to abundance index and catch data. Résumé : Dans le domaine des pêches, des modèles de production sont utilisés seulement lorsque l’on dispose d’une série chronologique des captures et de l’indice d’abondance. Des estimateurs de l’erreur d’observation sont généralement utilisés pour ajuster les modèles aux données au moyen d’une fonction objective du type des moindres carrés. Selon une hypothèse associée aux estimateurs de l’erreur d’observation, seul l’indice d’abondance observée peut présenter des erreurs, mais pas la dynamique du stock ni les captures observées. Cette hypothèse ne correspond généralement pas à la réalité. Les méthodes des moindres carrés ayant tendance à être sensibles aux hypothèses d’erreur, les résultats obtenus par ces méthodes risquent d’être peu fiables. Dans le cadre de la présente étude, nous proposons un estimateur robuste de l’erreur d’observation. Nous évaluons la performance de cette méthode ainsi que celle du maximum de vraisemblance, couramment utilisée, selon différentes hypothèses d’erreur. Lorsqu’il y avait seulement erreur d’observation au niveau de l’indice d’abondance, la méthode du maximum de vraisemblance était globalement plus efficace. Toutefois, en présence d’erreurs d’observation et d’erreurs de méthode, le maximum de vraisemblance donnait des erreurs d’estimation beaucoup plus importantes que la méthode proposée. Les résultats de la présente étude semblent indiquer que la méthode proposée est robuste aux hypothèses d’erreur. Comme l’ampleur de l’erreur et les types d’erreur peuvent rarement être précisés avec confiance, la méthode proposée offre une composante qui peut utilement compléter les méthodes employées pour ajuster les modèles de production à l’indice d’abondance et aux données sur les captures. [Traduit par la Rédaction]
Introduction Production models are among the simplest stock-assessment models commonly used in fisheries (Hilborn and Walters 1992). Input data for these models are a time series of catches and abundance indices, which are usually represented by catch per unit of effort (CPUE) estimated from the commercial fishery. A main advantage of production models is that no information about the age structure of fish population is required. For many fish species that are difficult to age or have no
Received August 7, 1996. Accepted July 8, 1997. J13597 Y. Chen1 and N. Andrew. New South Wales Fisheries Research Institute, P.O. Box 21, Cronulla, New South Wales 2230, Australia. 1
Author to whom all correspondence should be addressed. Present address: Fisheries Conservation, Fisheries and Marine Institute, Memorial University of Newfoundland, St. John’s, NF A1C 5R3, Canada. e-mail:
[email protected]
Can. J. Fish. Aquat. Sci. 55: 749–760 (1998)
historic information about age composition, production models are perhaps the only models that can be used to describe their dynamics. Production models yield important stock parameters and have modest data requirements. However, there are numerous unsuccessful applications of this type of models, which have yielded parameter estimates that are biologically impossible or unrealistic (e.g., negative values of parameters, extremely high or low virgin biomass coupled with very low or high population growth rate). However, this is often not due to the failure of the models because their structure oversimplifies the biological complexity of the fishery (Hilborn 1979; Ludwig and Walters 1985, 1989). It has been realized that the failure of production models in stock assessment is often due to (i) data failure, such as the lack of contrast between fishing effort and stock abundance (Hilborn 1979) or problems with unreliable indices of abundance (Hilborn and Walters 1992); (ii) large process error, which occurs in the dynamics of fish populations, and observation error, which occurs in measuring catch and (or) abundance index (Hilborn and Walters 1992); and (iii) use of inappropriate methods in parameter estimation © 1998 NRC Canada
750
Can. J. Fish. Aquat. Sci. Vol. 55, 1998
(Polacheck et al. 1993). For a given fishery, we have little control over the first two error sources in the historical data series and a discussion of the interpretation of CPUE as an index of abundance is beyond the scope of this paper. The development of estimation methods that reliably capture the information in the data is, however, of interest and forms the subject of this study. In this study, we proposed an alternative to “standard” observation-error estimators that is more robust to violations of assumptions about error structure. The proposed method is compared with a commonly used estimation method using a Monte Carlo simulation approach in fitting a production model to catch–CPUE data. Different assumptions about the error structure of the production models and observed catch–CPUE data are considered.
Production models Without considering observation and process errors, a deterministic production model commonly used can be written as (1)
Bi+1 = Bi + gi – Ci
where Bi is the stock biomass, gi is the growth of population in biomass, and Ci is the catch, all in year i. The gi is often referred to as “surplus production” and is modelled as a function of Bi. The most commonly used function for gi is the logistic or Schaefer function, gi = rBi (1 – Bi /K), where r is a parameter describing the intrinsic rate of population growth in biomass and K is a parameter corresponding to the unfished equilibrium stock size (often referred to as carrying capacity or virgin biomass). The stock biomass in year i is often assumed to be proportional to an abundance index estimated from fisheries data. This assumption can be written as Ii = qBi, where q is catchability coefficient and Ii is the abundance index in year i (Hilborn and Walters 1992). In this study, we use lognormal process errors (Kinas 1996) and lognormal observation errors for both the observed catch and abundance index (Hilborn and Walters 1992). Thus, eq. 1, which describes the dynamics of stock biomass, can be rewritten as (2)
Bi+1 = (Bi + gi – Ci)eεB,i
and two observation equations that relate true CPUE and catch with observed CPUE and catch can be written as (3)
Ii = q Bi eεI,i
(4)
Ciobs = Ci eεC,i
where Ii is the observed abundance index, and Ci and Ciobs are the true and observed catch, all in year i. The εB,i is the process error occurring in the change in population size, and the εI,i and εC,i are errors for the observed abundance index and catch, all in year i. All these error terms are assumed to be independent from each other and normally distributed with constant variances and mean of 0, i.e.: (5)
εB,i , N(0, σ2B), εI,i , N(0, σ2I ), εC,i , N(0, σ2C)
where σB is the standard deviation of process error in the dynamic model, and σC and σI are the standard deviations of observation errors in the catch and abundance index.
Methods for parameter estimation The method used to fit production models to observed data has been shown to be of greater importance to the reliability of estimated parameters than the algebraic form of the underlying population dynamic model (Punt 1988, 1992; Polacheck et al. 1993). The most commonly used four approaches are (i) equilibrium estimators (Gulland 1961); (ii) effort-averaging estimators (Fox 1975); (iii) processerror estimators (Walters and Hilborn 1976; Schnute 1977); and (iv) observation-error estimators (Butterworth and Andrew 1984; Ludwig and Walters 1985). All of these approaches yield estimates for parameters q, r, and K with the observation-error estimators requiring an extra estimate of stock biomass at the beginning of time series for which catch data are available. These estimation approaches differ in how errors are introduced into the dynamic model and observation models. For the equilibrium estimators, fish stocks are assumed to be in equilibrium, and there are no observation or process errors (i.e., σC = σI = σB = 0). Although this approach tends to yield parameters that appear biologically reasonable, the outcomes are often misleading because the equilibrium assumption is rarely, if ever, met. The estimates can be substantially biased. For stocks that are declining, the bias is positive, while for stocks that are increasing, it is negative (Hilborn and Walters 1992). No error structure is incorporated into the effort-averaging estimators. The equilibrium assumption is relaxed by using a weighted average fishing effort in effort-averaging estimators (Fox 1975). However, the parameters estimated using the effort-averaging estimators are often highly (positively) biased (Hilborn 1979; Polacheck et al. 1993). The problems associated with equilibrium and effort-averaging estimators are well known, and these two methods are not used in any serious stock assessment. Process-error estimators assume that the abundance index and catch are measured without errors and that all the error occurs in the change in population size among years. Thus, both σC and σI have values of 0. Several formulations of process-error models have been proposed (e.g., Walters and Hilborn 1976; Schnute 1977, 1989; Polacheck et al. 1993). Parameters are estimated using multiple regression analysis. The observation-error estimators used to date assume that there is no stochasticity in the population dynamics of fish stock and that all the error occurs in the observed index of abundance (Butterworth and Andrew 1984; Ludwig and Walters 1985; Ludwig et al. 1988). Thus, both σC and σB have values of 0. The observation model that relates stock biomass (that cannot be observed directly from the fishery) to the observed abundance index can be written as (6)
log(Ii) = log(q Bi) + εI,i
The model parameters (Binitial, q, r, and K) are commonly estimated by least squares (LS) methods, such as maximizing the appropriate likelihood function (Polacheck et al. 1993) or minimizing the sum of squared εI,i (Hilborn and Walters 1992). Time series of stock biomass are estimated by projecting the biomass at the start of the catch series (Binitial) forward under the historical annual catches. If catch data were collected in the early years of the fishery, Binitial is often assumed to be the same as K (Hilborn and Walters 1992). In this case, the number of parameters to be estimated is reduced to 3. Recently, it has been suggested that observation-error estimators are superior to processerror estimators because of their robustness in the face of uncertainty about error assumptions and the formulation of the dynamic models (Punt 1988, 1992; Hilborn and Walters 1992; Polacheck et al. 1993). Observation-error estimators are increasingly used in fitting production models to CPUE–catch data. Because of their importance and relative simplicity, we focus on observation-error estimators in this study. In practice, however, it is almost certain that both observation and process errors exist in modelling the biomass dynamics of a fish stock. If the assumption about errors is realistic, σI, σC, and σB all have © 1998 NRC Canada
751
Chen and Andrew nonzero values. In this case, the application of either process-error or observation-error estimator should be evaluated with care. Because the LS type of estimation methods tend to be sensitive to the assumption about the model error structure (Rousseeuw and Leroy 1987), the unrealistic error assumption associated with process-error and observation-error estimators may result in large errors in parameter estimates when fitting models to data (Schnute 1989). With the more realistic error assumption (i.e., nonzero values of σI, σC, and σB), if the parametric distribution of all error terms can be fully defined, we can apply the Kalman filter to generate a likelihood function and then maximize this likelihood to yield parameter estimates (Sullivan 1992; Reed and Simons 1996), or we can define an appropriate variance–covariance matrix based on the defined error structure and then apply a generalized least squares method to estimate model parameters (Paloheimo and Chen 1996). However, the former approach is rather complicated with the current models and error structure. The later approach needs information about levels of process error and errors associated with observed CPUE and catch. Such information is probably nonexistent in most fisheries. Moreover, the parametric assumption about error distribution may not be true. In practice, the type and magnitude of errors present in modelling the dynamics of fish stock biomass are poorly understood and difficult to define with confidence. Thus, for observation-error estimators, it is desirable to replace LS methods with a method that is robust to assumptions about error structure when fitting production models to CPUE–catch data. In this study, we propose a robust observation-error estimator, and then evaluate it together with the commonly used LS type of observation-error estimator under different assumptions about the model error structure. The LS type of method used in this study is maximum likelihood (ML) (Hilborn and Walters 1992; Polacheck et al. 1993). Its objective function can be written as ˆε2I,i e− 2σˆ2
N
(7)
ML estimator: maximize L = ∏ i=1
I
(2π)1/2 σ ˆI
where εˆI,i = log(Ii) – log(Ii) and N
ˆ 2I = ∑ σ i=1
ˆε2I,i N
Nonlinear parameter estimation techniques are needed to fit the models to data using the ML. In this study, the simplex method of Nelder and Mead (1965) is used to conduct the nonlinear parameter estimation. A simplex of starting values are given at the beginning of iteration (Press et al. 1992). The maximum number of iterations was set at 5000. If no minimum value was identified within the 5000 iterations, the initial values were changed. A wide range of initial values were tested to make sure that the log likelihood was maximized (minimizing negative log likelihood) globally rather than locally. The proposed robust observation-error estimator is the least median of squared errors (LMSE). Its objective function for the parameter estimation can be written as (8)
LMSE estimator: minimize median (log(Ii) – log(Ii))2 1,...,N
This estimator is based on the least median of squares used in linear regression analyses (Rousseeuw and Leroy 1987). The least median of squares have been found to be robust to the assumption about error structure in linear regression analysis (Rousseeuw and Leroy 1987; Chen et al. 1994). However, its estimation algorithms cannot be directly used in this study because the observation-error estimator require nonlinear parameter estimation algorithms. Estimation algorithms for the LMSE estimator are detailed in the appendix.
Simulation study The performance of the two objective functions for observationerror estimators were evaluated under different assumptions about the error structure using published data from the New Zealand rock lobster (Jasus edwardsii) and northern Namibian Cape hake (Merluccius capensis and M. paradoxus) fisheries (Polacheck et al. 1993). The stock parameters estimated using the ML method for these two fisheries (see Polacheck et al. 1993), together with its catch data, were used in simulating the observed CPUE and catch data based on the eqs. 2–4. The two fisheries included in the simulation have very different patterns in the change of CPUE over years. The New Zealand rock lobster is an example of a “one-way trip” with its CPUE decreasing steadily (Polacheck et al. 1993). This type of data series are considered to be the least informative in fitting production models to CPUE–catch data (Hilborn and Walters 1992). However, good contrast in CPUE was observed in the northern Namibian hake fishery (Polacheck et al. 1993). For each fishery, six catch–CPUE data sets were simulated with the observation and process errors for rock lobster and hake (Table 1). Simulated values for CPUE (Ii) and catch (Ciobs) derived from eqs. 3 and 4 were used as input data for parameter estimation in the simulation. As can be seen, data set 1 was simulated with the observation error in CPUE data only, and set 2 was simulated with process error only. Data sets 3 and 5 were simulated with process error and observation error in CPUE, but no error in observed catch, while data sets 4 and 6 were simulated with the process and observation errors in both CPUE and catch (Table 1). The σIs of 0.21 and 0.13 in observed CPUE were estimated in the ML analysis for rock lobster and hake, respectively (Polacheck et al. 1993). Values of other error terms were determined somewhat arbitrarily for the purposes of the simulation. Stock biomasses of rock lobsters in 1945 and hake in 1965 (the first year in the catch series) were assumed to be the same as their respective Ks (Polacheck et al. 1993). Thus, the parameters to be estimated in the Monte Carlo simulation are r, K, and q for both fisheries. These parameters, together with the catch information (Ciobs), determined stock dynamics, and were used to calculate the following management parameters: maximum sustainable yield (MSY), calculated as rK/4; optimal effective effort (EMSY), calculated as r/(2q); current stock biomass (Bcurr), calculated from eq. 1; and current depletion, calculated as Bcurr /K (Ricker 1975; Polacheck et al. 1993). Because the two fisheries were simulated using the “known” parameter values for the New Zealand rock lobster and northern Namibian hake fisheries (i.e., assuming that MLestimated K, q, and r were true; Polacheck et al. 1993) and identical data sets were used by each estimation method in each simulation run, the performance of each estimation method can be evaluated by comparing the true values of the parameters and the estimates from the simulated data. For each simulation scenario, 2000 sets of simulated CPUE–catch data were generated. The two estimation methods used in this study were applied to each of these 2000 simulated data sets. An index, relative estimation error (REE), was used to summarize the estimation results and to evaluate the performance of the estimators (Chen and Paloheimo 1995). It is defined as (9)
REE(µˆ i) =
(|µˆ i − µ|2)1/2 µ
100% © 1998 NRC Canada
752
Can. J. Fish. Aquat. Sci. Vol. 55, 1998
Table 1. Observation and process errors used in the simulation study using the CPUE–catch data from the New Zealand rock lobster fishery and the northern Namibian hake fishery. Simulated data set I II III IV V VI
σ∗I 0.21 0 0.21 0.21 0.21 0.21
Rock lobster σ∗C σ∗B 0 0 0 0.15 0 0.15
0 0.2 0.1 0.1 0.2 0.2
Hake σI
σC
σB
0.13 0 0.13 0.13 0.13 0.13
0 0 0 0.15 0 0.15
0 0.2 0.1 0.1 0.2 0.2
*σI, standard deviation for observation error in catch per unit of effort; σC, standard deviation for observed error in catch; σB, standard deviation for process error.
where µˆ i is the parameter estimated in the ith simulation run, and µ is the assumed true value of the parameter. REE is an index of estimation error (i.e., including both variance and bias) relative to the true value of the parameter. The larger the REE is, the less reliable the estimated parameters are. The median, mean, and lower and upper 5 percentiles were calculated from 2000 runs of simulation for each parameter and its REE.
Applications In addition to evaluating estimator performance with simulated data, the estimators were applied to CPUE–catch data for the Pacific cod (Gadus macrocephalus; Hilborn and Walters 1992), Hecate Strait rock sole (Lepidopsetta bilineata; Hilborn and Walters 1992), and northern Namibian hake (Polacheck et al. 1993). Differences in the parameter estimates using these methods were evaluated.
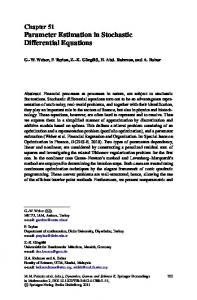
Results Simulation Observation error in CPUE only For data set 1, which was simulated with errors only in observed CPUE, the mean and median values of three model parameters (i.e., r, K, and q), and four management parameters (i.e., MSY, EMSY, Bcurr, and Bcurr /K) estimated using the ML method in 2000 runs of simulation were almost identical to the true values of these parameters (Figs. 1 and 2). They tended to be closer to the true values than those of the LMSE-estimated parameters, indicating that the ML yields parameters with smaller biases. However, the differences were small. The MLestimated parameters tended to have smaller 90% confidence intervals than the LMSE (Fig. 1). For both estimation methods, there were small differences between the mean and median values of each parameter. The ML-estimated parameters tended to have smaller mean and median values of REE compared with the LMSE-estimated parameters (Figs. 3 and 4). The confidence limits of the REE for each parameter estimated using the ML method were smaller than those of the LMSE method. The results tended to be consistent between data sets simulated based on rock lobster and hake fisheries. For simulated hake data, the differences between mean and median values of
REE were small for both methods. For data simulated based on rock lobster fishery, the mean values of REE were larger than the median values for the ML-estimated parameters. However, such differences were small for the LMSEestimated parameters (Figs. 3 and 4). Process error only For data set 2, which was simulated with process error εB,i only, the LMSE-estimated parameters tended to have their mean and median closer to the true values compared with those estimated using the ML method (Figs. 1 and 2). The differences were small between the mean and median values of the LMSEestimated parameters. However, for the ML-estimated parameters, the differences between mean and median values were large with median values being much more closer to the true values of the parameters. The LMSE-estimated parameters tended to have much smaller confidence intervals than the ML-estimated parameters (Figs. 1 and 2), indicating smaller variations were associated with the LMSE-estimated parameters. Both mean and median values of REE for the LMSEestimated parameters were smaller than those of the ML estimates (Figs. 3 and 4), indicating that the LMSE method yielded parameters with smaller estimation errors. There were small differences between mean and median values of REE for the LMSE method, but such differences were large for the ML method with the median values being much smaller than the mean values. This suggests that the ML method yields much more extreme values in the estimated parameters in simulation compared with the LMSE method. The 90% confidence intervals associated with the MLestimated parameters were much larger than those for the LMSE estimates (Figs. 3 and 4). The comparison results between the LMSE and ML methods were consistent between two data sets simulated according to the rock lobster and hake fisheries. Process error and observation error in CPUE For data sets 3 and 5, simulated with both process error (εB,i) and observation error in CPUE (εI,i), the mean and median values of the LMSE-estimated parameters tended to be closer to the true values than those of the ML-estimated parameters (Figs. 1 and 2). This suggests that LMSE-estimated parameters tended to have smaller estimation biases. For both data sets 3 and 5, the 90% confidence intervals for the LMSE-estimated parameters were smaller than those of ML-estimated parameters. For both estimation methods, although the mean and median values of the estimated parameters were similar between data sets 3 and 5, data set 5 had larger confidence intervals. The LMSE method had smaller mean and median values of REE for each parameter than the ML method (Figs. 3 and 4). Thus, the LMSE tended to yield parameters with smaller estimation errors than the ML method. For the ML method, mean values of REE tended to be larger than median values, and such differences increased when εB,i increased from 0.1 (set 3) to 0.2 (set 5). However, for the LMSE method, the differences between mean and median values of REE were small (Figs. 3 and 4). This suggests that the ML-estimated parameters tend to have more extra values that are far away from the true values of the parameters compared with the LMSE-estimated parameters. For the ML method, data set 5 had much larger mean © 1998 NRC Canada
Chen and Andrew
753
Fig. 1. Summary of parameters estimated using the ML and LMSE methods for rock lobster. Values on the x axis are data sets. For each data set: A, ML method; B, LMSE method.
© 1998 NRC Canada
754
Can. J. Fish. Aquat. Sci. Vol. 55, 1998
Fig. 2. Summary of parameters estimated using the ML and LMSE methods for hake. Values on the x axis are data sets. For each data set: A, ML method; B, LMSE method.
© 1998 NRC Canada
Chen and Andrew
755
Fig. 3. Summary of relative estimation error (REE) using the ML and LMSE methods for rock lobster. Values on the x axis are data sets. For each data set: A, ML method; B, LMSE method.
© 1998 NRC Canada
756
Can. J. Fish. Aquat. Sci. Vol. 55, 1998
Fig. 4. Summary of relative estimation error (REE) using the ML and LMSE methods for hake. Values on the x axis are data sets. For each data set: A, ML method; B, LMSE method.
© 1998 NRC Canada
757
Chen and Andrew
values of REE than data set 3, but differences in median values of REE between these two data sets were small. For the LMSE, such differences in mean and median values of REE between data sets 3 and 5 were small (Figs. 3 and 4). The comparison results tended to be consistent for data sets simulated based on rock lobster and hake fisheries.
Table 2. Parameters estimated using the ML and LMSE observation-error estimators for the Pacific cod, Hecate Strait rock sole (Hilborn and Walters 1992), and northern Namibian hake fisheries (Polacheck et al. 1993).
Process error and observation errors in CPUE and catch For data sets 4 and 6, simulated with process error (εB,i) and observation errors in both CPUE (εI,i) and catch (εC,i), results of comparisons between the ML and LMSE methods were more or less the same as those for data sets 3 and 5 (Figs. 1–4). Data sets 5 and 6 differed from sets 3 and 5, respectively, in that sets 5 and 6 had a nonzero observation error in catch while catch in sets 3 and 5 was assumed to be error free. However, for both methods, the introduction of error in catch did not change estimated parameters and their REE greatly. For the ML method, differences in 90% confidences intervals between data sets 3 and 4 were small for the estimated parameters and their REE. However, the differences between data sets 5 and 6 were larger. For the LMSE method, the differences were small both between data sets 3 and 4 and between sets 5 and 6. The comparison results were consistent between data sets simulated based on rock lobster and hake fisheries (Figs. 1–4).
Pacific cod r 0.1773 K 19.75 q 0.0524 MSY 0.875 EMSY 1.69 Bcurr 13.0 Bcurrent/K 0.658 Hecate Strait rock sole r 0.2765 K 7856.7 q 0.000 17 MSY 543.1 EMSY 813.2 Bcurr 1869.9 0.238 Bcurrent/K Northern Namibian hake r 0.3765 K (t, ×103) 2767.0 q 0.000 44 MSY (t, ×103) 253.5 EMSY 423.0 1650.3 Bcurr(t, ×103) Bcurrent/K 0.604
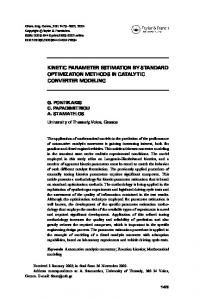
All simulated data The true values of the parameters were within the 90% confidence intervals for both the ML and LMSE methods for all simulated data sets (Figs. 1–4). When the assumption about error structure for the observation-error estimator was correct (data set 1), the ML performed better than the LMSE method, with smaller estimation bias and error in the estimated parameters. When a more realistic error structure was set up which included both process and observation errors (data sets 3–6) or when there was only process error (data set 2), the assumption about error structure for observation-error estimators is violated. In this case, the bias and error associated with the MLestimated parameters increased greatly compared with those for data set 1. This suggests that the ML method is sensitive to assumptions about error structure. However, the LMSE method tended to yield parameters with similar magnitudes of biases and REE among data sets simulated with different assumptions about error (Figs. 1–4). When the assumption about error structure for observation-error estimators is violated (data sets 2–6), the LMSE-estimated parameters had much smaller estimation bias and errors than the ML-estimated parameters for all three model parameters and four management parameters evaluated in this study (Figs. 1–4). Application For the Pacific cod, the ML-estimated r and q were twice and two thirds of the LMSE-estimated r and q, respectively, but the ML- and LMSE-estimated K were almost identical (Table 2). Maximum sustainable yield (calculated as rK/4) based on the LMSE was only half of that calculated based on the ML. The ML-estimated current biomass (Bcurr) and stock depletion (Bcurr/K) were much higher than those calculated based on the LMSE method. The LMSE-estimated EMSY was less than one third of the ML-estimated (Table 2). Differences between the ML- and LMSE-predicted CPUEs of Pacific cod were large in the earlier years but smaller in more recent years (Fig. 5).
Estimator Parameter
ML
LMSE
Difference (%)*
0.0874 19.69 0.0880 0.430 0.50 7.7 0.392
–50.7 –0.3 67.9 –50.9 –70.4 –40.8 –67.9
0.3622 6713.5 0.000 19 607.9 953.2 1745.5 0.260
31.0 –14.6 11.8 11.9 17.2 –6.6 9.2
0.3504 2879.7 0.000 42 252.3 417.1 1534.9 0.533
–6.9 4.1 –4.5 –0.5 –1.4 –7.0 –11.8
*Difference = 100((LSME estimate – ML estimate)/ML estimate).
Differences in parameter estimates using the ML and LMSE were small for the Hecate Strait rock sole (Table 2). The LMSE-estimated r was about 30% higher than the MLestimated r. The LMSE-estimated K was 15% lower than the ML-estimated K, while the LMSE-estimated q was 12% higher than the ML-estimated q. The LMSE-estimated MSY was 12% higher than that estimated using the ML. The LMSE-estimated stock depletion was slightly higher than that calculated using the ML, but the Bcurr calculated using the LMSE method tended to be slightly lower than the ML-estimated value. The LMSE-estimated EMSY was about 15% higher than the ML estimate (Table 2). Differences between the ML- and LMSEpredicted CPUEs were relatively large in the early years but smaller in more recent years (Fig. 5). For the northern Namibian hake, the ML- and LMSEestimated parameters were almost identical (Table 2). The ML-estimated current biomass was higher than that calculated based on the LMSE. The difference between EMSYs estimated using the ML and LMSE methods was small (Table 2). There was almost no difference between the ML- and LMSEpredicted CPUEs in the early years, but the difference increased in more recent years (Fig. 5).
Discussion The results of our simulation suggest that ML tend to have small biases and REEs and perform better than the robust method when observation error is the only source of error in © 1998 NRC Canada
758
Can. J. Fish. Aquat. Sci. Vol. 55, 1998
Fig. 5. Catch rate observed in the Pacific cod fishery, Hecate Strait rock sole fishery, and northern Namibian hake fishery, with the fits of the ML and LMSE estimators superimposed.
the model (Figs. 1–4). When a more realistic error structure is used, with both process and observation errors, the parameters estimated using this commonly used method have large biases and errors (Figs. 1–4). For some parameters, the biases and errors are so large that the parameter estimates are virtually meaningless. The biases and errors associated with LMSE-estimated parameters were similar among the six data sets simulated based on both rock lobster and hake fisheries. This suggests that the LMSE method is robust to different error structures. For most data observed in fisheries, it is impossible to specify the most appropriate error structure when fitting production models. The robustness of the LMSE method to differences in error structure is therefore desirable. The results derived from the comparison study between the ML and LMSE methods are remarkably consistent over simulations based on two fisheries with very different patterns in the change of CPUE over years. This may imply that the results observed in this study can be extended to other fisheries. However, because there are only two types of CPUE–catch data that are included in this study, more comparison studies using data from other fisheries may be needed to attest this inference. Production model estimators are often used to derive the quantities needed for risk analysis under different harvesting strategies. This requires some estimate of the uncertainty of the estimated parameters. A bootstrap approach has been proposed to estimate the uncertainty in the estimated parameters (Y. Chen and S. Montgomery, unpublished data). This
approach is similar to the bootstrap procedure used in a regression analysis, and includes the following procedure: (1) estimate parameters using the LMSE method; (2) calculate the predicted CPUEs using the LMSE-estimated model parameters; (3) calculate the residuals between observed and predicted log CPUEs; (4) randomly sample the residuals with replacement to add to the predicted logarithm CPUEs to yield pseudo observed CPUEs, (5) apply the LMSE method to the pseudo-observed CPUE data to estimate bootstrapped estimates; (6) repeat procedures 4 and 5 for B times to simulate B sets of pseudo- CPUE data and subsequently estimate the corresponding B sets of bootstrapped parameters; and (7) calculate the median value and probability distribution for each parameter using B bootstrapped estimates. There is a fundamental difference in the philosophy of fitting models using the ML versus LMSE estimators. The ML presumes that all data points can be described by the chosen model. This assumption is realized by treating all data points equally in fitting the model. Thus, the estimated parameters are the averages for all data. This approach disregards the fact that data from some years are observed in atypical conditions, such as extremely large measurement errors and atypical weather and fishing behaviours, differ remarkably from those observed under typical environmental conditions and cannot be well described by the chosen model. If these atypical data points are included in fitting the model, the parameter estimates tend to have large errors (Rousseeuw and Leroy 1987). The LMSE estimator presumes that only typical data points © 1998 NRC Canada
Chen and Andrew
can be described by the chosen model, and atypical data points (theoretically,