www.nature.com/scientificreports
OPEN
Particle dynamics and deposition in true-scale pulmonary acinar models
received: 06 May 2015 accepted: 18 August 2015 Published: 11 September 2015
Rami Fishler1, Philipp Hofemeier1, Yael Etzion2, Yael Dubowski2 & Josué Sznitman1 Particle transport phenomena in the deep alveolated airways of the lungs (i.e. pulmonary acinus) govern deposition outcomes following inhalation of hazardous or pharmaceutical aerosols. Yet, there is still a dearth of experimental tools for resolving acinar particle dynamics and validating numerical simulations. Here, we present a true-scale experimental model of acinar structures consisting of bifurcating alveolated ducts that capture breathing-like wall motion and ensuing respiratory acinar flows. We study experimentally captured trajectories of inhaled polydispersed smoke particles (0.2 to 1 μm in diameter), demonstrating how intrinsic particle motion, i.e. gravity and diffusion, is crucial in determining dispersion and deposition of aerosols through a streamline crossing mechanism, a phenomenon paramount during flow reversal and locally within alveolar cavities. A simple conceptual framework is constructed for predicting the fate of inhaled particles near an alveolus by identifying capture and escape zones and considering how streamline crossing may shift particles between them. In addition, we examine the effect of particle size on detailed deposition patterns of monodispersed microspheres between 0.1–2 μm. Our experiments underline local modifications in the deposition patterns due to gravity for particles ≥0.5 μm compared to smaller particles, and show good agreement with corresponding numerical simulations.
Understanding the basic transport mechanisms of inhaled particles in the deep alveolated regions of the lungs, i.e. pulmonary acini, has broad ramifications in the context of health risk assessment1,2 (e.g. occupational and environmental exposure) and inhalation therapy3,4 (e.g. systemic delivery or local lung targeting). However, acinar particle dynamics are not trivial due to the coupling between intrinsic transport mechanisms5 (e.g. gravity, diffusion) and the complex convective airflows that exhibit recirculating alveolar flow topologies and stretch-and-fold patterns characteristic of chaotic mixing6. In particular, inhaled aerosol kinematics are influenced by irreversible low-Reynolds-number airflows, a consequence of anisotropic deformations of septal walls during cyclic breathing7 combined with unique anatomical structures of the acinus8. A detailed characterization of particle transport mechanisms inside the pulmonary acinus requires resolving kinematic trajectories and detailed deposition patterns of inhaled aerosols under physiologically-realistic respiratory flow conditions. Yet, experimental studies of inhaled particle dynamics are scarce due to the intricate acinar anatomy and its small dimensions (i.e. the diameter of an alveolus is ∼ 200–300 μ m in a human adult9) To date, there are still no means to measure airborne particle trajectories in vivo, and high-resolution aerosol deposition patterns in acini can only be obtained from direct visualization in sacrificed animals9 or from human autopsys10. In live humans, investigations of inhaled aerosols are commonly restricted to imaging deposition patterns of radio-labeled particles with coarse spatial resolutions11,12 (e.g. gamma scintigraphy), or alternatively conducting inhalation studies by measuring bolus dispersion upon exhalation at the mouth13. An experimental in vitro platform enabling direct observations of acinar particle trajectories and deposition patterns is thus highly desirable 1
Department of Biomedical Engineering, Technion – Israel Institute of Technology, Haifa. 2Department of Civil and Environmental Engineering, Technion – Israel Institute of Technology, Haifa. Correspondence and requests for materials should be addressed to J.S. (email:
[email protected])
Scientific Reports | 5:14071 | DOI: 10.1038/srep14071
1
www.nature.com/scientificreports/ for investigating basic transport phenomena. One classic approach is brought with scaled-up models following hydrodynamic similarity matching; however, scaled-up setups are mostly limited to investigating a narrow range of realistic inhaled aerosol dynamics5,14,15 since Brownian diffusion mechanisms for submicron and ultrafine particles are altogether neglected. In the absence of versatile experimental tools numerical investigations, including computational fluid dynamics (CFD), have been highly valuable for investigating the dynamics of inhaled aerosols in models of acinar geometries, spanning simple alveolated ducts16–19 to more complex bifurcating tree networks20–22, and more recently using anatomically-reconstructed alveolar geometries23–25 with high-resolution imaging modalities (e.g. micro-computed tomography). An overarching finding is that the deposition processes of both large (e.g. 2 μ m and larger) and small (e.g. 0.1 μ m and smaller) particles are relatively quick (i.e. with time scales on the order of an inhalation period or less), where kinematics are dominated by gravitational sedimentation for heavier particles and Brownian motion for smaller ones. However, for fine particles in the intermediate size range of ∼ 0.1 to 1 μ m, transport is hypothesized to be largely affected by the local unsteady airflow patterns, leading to irreversible kinematics within alveolar cavities18,26–28. Despite such insight, the great majority of numerical works on aerosol kinematics have not been validated experimentally and have frequently discarded the role of Brownian motion. Here, we present an in vitro platform for studying inhaled acinar particle dynamics and deposition patterns. Using microfabrication techniques, we have constructed a true-scale microfluidic acinar model that allows direct observation of airborne particle trajectories and mapping detailed deposition locations. Following in the footsteps of seminal microfluidic airway models29,30, our acinus-on-chip platform consists of an anatomically-inspired, multi-generation network of bifurcating airway ducts lined with alveolar cavities, where the walls are periodically deformed in a physiologically-realistic breathing-like fashion. We first track and reconstruct the trajectories of airborne smoke particles near and within alveolar cavities using high-speed imaging. Next, we capture the deposition patterns of a wide range of monodispersed microspheres (from 0.1 to 2 μ m in diameter) following inhalation assays in the in vitro device. Together, our experimental observations give new insight into the coupling of aerosol transport mechanisms and local alveolar flow patterns that determine the dispersion and deposition of inhaled particles in acinar structures.
Results and Discussion
Device design. The acinus-on-chip geometry is designed to mimic the pulmonary acinar environ-
ment, capturing representative alveolar structures at true scale (Fig. 1A). At the heart of the design is an anatomically-inspired model featuring five generations of rectangular ducts (120 μ m in width and 100 μ m in height) lined with cylindrical alveoli (120 μ m in diameter; see Fig. 1B), constructed using well-established microfabrication techniques for Polydimethylsiloxane-based (PDMS) microfluidics31. Two master wafers were fabricated for PDMS molding using either SU-8 photolithography31 or deep reactive ion etching (DRIE) of a silicon on insulator wafer30,32; further details on device fabrication are presented in the supplementary information (SI). The thin PDMS airway walls are deformed in a periodic fashion with a 4 sec breathing period (T) by altering the pressure inside the surrounding top and side chambers (Fig. 1A) via a syringe pump (see Video S1). This results in a maximal deflection of ∼ 20 μ m for the upper channel wall and ∼ 10 μ m for the side walls, thus reproducing a normal to deep breathing scenario with a maximum total volume change of ∼ 30% of the minimum airway volume, where the tidal front reaches approximately up to the bifurcation point between the 4th and the 5th generations (see Fig. 1B and Videos S1 and S2). To characterize convective flow within the device, velocity profiles in acinar ducts and velocity maps of alveolar flow fields were resolved by micro-particle image velocimetry (μ PIV) measurements using liquid-suspended particles and hydrodynamic similarity matching30 (see Methods). The anatomically-inspired microfluidic acinar models differ in many ways from the anatomical in vivo environment30. Importantly, the alveolar to ductal volume ratio is much lower than expected anatomical values due to intrinsic microfabrication constraints30. In addition, airducts (120 μ m in width and 100 μ m in height) and alveoli (120 μ m in diameter and 100 μ m in height) are slightly smaller compared to anatomical data for adults9 such that our designs may be closer to acinar geometries of infants33. Nevertheless, it is stressed here that the underlying acinar airflow phenomena under breathing conditions are adequately captured in the present true-scale models. Namely, both local alveolar flow patterns and velocity flow magnitudes along the acinar ducts (see Methods) show consistent agreement with recent numerical simulations5,34. Hence, our model supports a detailed and systematic study of the basic acinar transport phenomena anticipated under respiratory acinar flow conditions5.
Visualization of incense particle trajectories. We first explored how the fate of inhaled aerosols
passing near an alveolus is affected by the time of arrival (e.g. inhalation or exhalation), sedimentation, diffusion and the local unsteady alveolar flow configuration. Here, we have visualized time-resolved trajectories of airborne particles inside the acinus-on-chip using a dense incense smoke (∼ 109 cm−3) to allow imaging of particles in a small field of view over short time scales. Following measurements of particle size distribution, the aerosol is found to be polydispersed, exhibiting an approximate log normal distribution with a count mean diameter of 0.46 μ m and a geometric standard deviation of 1.25; as such, particle sizes lie in the range of ∼ 0.2 to 1 μ m. Notably, while the range of examined particle sizes is relatively narrow, it corresponds to the size range where Scientific Reports | 5:14071 | DOI: 10.1038/srep14071
2
www.nature.com/scientificreports/
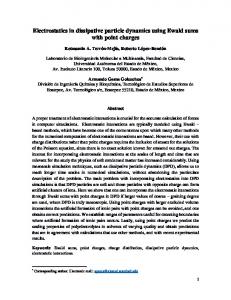
Figure 1. Schematic of the acinus-on-chip device. (A) Microfluidic acinar model consisting of three PDMS layers stacked on top of a PDMS-covered glass slide. (B) Magnified view of the acinar tree, featuring five alveolated airway generations (numbered 1 through 5). The thin airway walls, embossed in the bottom face of the bottom PDMS layer, are cyclically deformed by applying pressure to the surrounding top and side water chambers (colored in blue) via a syringe pump connected to port 1 (marked P.1). Particle tracking assays are conducted by injecting incense smoke through port 2. During deposition assays, an aerosol of polystyrene particles enters through the inlet and leaves mostly through an exhaust tube connected to the outlet. A syringe pump connected to port 2 (marked P.2) draws a slow stream of aerosols through the leading channel and auxiliary channels from which the aerosol is drawn into the alveolated airways as a result of the cyclic change of airway volume. (see Methods for further details on aerosol exposure assays).
our current understanding of particle dynamics is most limited, as discussed further below. Microfluidic devices were held vertically with the leading channel aligned with the direction of gravity, and a plume of incense smoke was injected through port 2. Particles were then imaged using dark field microscopy (see Videos S3-S5) and their location was identified using an in-house particle tracking algorithm. Selected aerosol trajectories in the vicinity of and within alveolar cavities are shown in Fig. 2, where individual trajectories are color-coded according to the breathing cycle (Fig. 2B). Instantaneous streamlines of the alveolar flow patterns at peak velocity (t/T ∼ 0.25) are overlaid for clarity; note that the model deformation is not strictly self-similar due to intrinsic heterogeneities in acinar airway strains, and therefore alveolar flow topologies may slightly evolve and differ from those plotted during the course of the breathing, as we have previously shown30. Although our visualizations of individual trajectories (n > 40) are restricted to 2D projections only, significant out-of-plane motion occurs due to a combination of the 3D nature of the acinar flow field24,30 and intrinsic Brownian diffusion for particles in this size range. In turn, some imaged particles disappeared from the focal plane during measurements (Fig. 2). Figure 2A compares aerosol trajectories that reach the vicinity of the alveolar opening at different times during the inhalation cycle for two selected alveoli located in the second (first row) and fourth (second row) generations (marked with a triangle and a star in Fig. 3, respectively). Note that the alveolus in the second generation features a recirculating flow pattern characteristic of proximal to mid-acinar regions; these regions are acknowledged to yield relatively higher deposition relative to deeper alveoli11 and feature enhanced convective mixing35. In contrast, streamline patterns in the fourth generation are radial with no recirculation zone, where ductal velocities are significantly slower due to mass conservation across the acinar network.
Scientific Reports | 5:14071 | DOI: 10.1038/srep14071
3
www.nature.com/scientificreports/
Figure 2. Kinematics of inhaled incense smoke particles. (A) Trajectories of individual particles. Colorcoding indicates time in breathing cycle, i.e. red and light blue correspond to transition from exhalation to inhalation and from inhalation to exhalation, respectively. Gray lines depict airflow streamlines at maximal velocity (i.e. peak inhalation), as obtained from micro-PIV measurements (see Methods). (B) Normalized average velocity versus normalized time at the opening region of an alveolus in the second generation, as measured from PIV. Color-coding is identical to panel (A). (C) Schematic framework for predicting particle fate near an alveolus in the mid-acinus (i.e. second generation in our model). During inhalation (left panel), a streamline crossing the threshold distance (h0) defines regions of particle capture or escape. At exhalation (right panel), the recirculation region constitutes a capture zone surrounded by an escape zone. Gravity and diffusion may divert a particle from an escape zone to a capture zone (or vice versa), in particular during flow reversal and inside the alveoli where convective flows are weak.
We observe distinctly different deposition mechanisms as a function of particle arrival time. Early on during the inhalation phase (t/T