Oct 10, 2005 - factors are often outside of the hosting provider's control. A more subtle factor ... a popular Counter-Strike server, our model predicts an ideal.
Patch Scheduling for On-line Games Chris Chambers Wu-chang Feng Portland State University {chambers,wuchang}@cs.pdx.edu
ABSTRACT One of the challenges facing the on-line gaming community is the delivery of new content to players. While the initial distribution of a game is typically done via large media formats such as CD-ROM or DVD-ROM, consumers expect regular updates to on-line games such as bug fixes, balance adjustments, and new content. In this paper, we develop a model for the bandwidth impact of patch delivery based on the time of day of the patch release. We evaluate our model against the Steam content delivery network and determine the best time to release a patch to be midway between the peak and trough of daily player load.
Categories and Subject Descriptors C.2.4 [Distributed Systems]: Distributed Applications
General Terms Performance, Management, Measurement
Keywords games, updates, patches
1.
INTRODUCTION
On-line games are an extremely popular form of entertainment, with millions of players playing at any moment of the day. One of the challenges in hosting on-line games is the dynamic provisioning of servers to meet player usage [1, 2, 3, 4, 5, 6, 7, 8]. Among issues that have been addressed include modeling the traffic to servers and developing infrastructure to allow on-line games to leverage on-demand computing. One unexplored provisioning challenge for game hosting is the allocation of resources to support the release of game updates. On-line gamers have come to expect periodic patches to their games over time in order to address bugs, to prevent cheating, to increase performance, or to provide additional content and functionality. While the on-line dissemination Permission to make digital or hard copies of all or part of this work for personal or classroom use is granted without fee provided that copies are not made or distributed for profit or commercial advantage and that copies bear this notice and the full citation on the first page. To copy otherwise, to republish, to post on servers or to redistribute to lists, requires prior specific permission and/or a fee. NetGames’05, October 10–11, 2005, Hawthorne, New York, USA. Copyright 2005 ACM 1-59593-157-0/05/0010 ...$5.00.
of patches is convenient for gamers and game developers, the aggregate bandwidth required to host the patch can be substantial. In the case of a highly anticipated game’s beta release, the amount of data distributed can exceed a petabyte and the instantaneous bandwidth can exceed tens of gigabits per second [9]. To make matters worse, such bandwidth consumption cannot simply be throttled since players typically cannot play until their version of the game matches the server’s version. The two most obvious factors related to the impact of a software release are the size of the patch and the number of players playing the game at any given point in time. These factors are often outside of the hosting provider’s control. A more subtle factor that can be controlled, however, is the timing of the software release. More specifically, player load for on-line games is periodic on both a daily and (to a lesser extent) a weekly time cycle. When patches are released during daily player peaks, more people are forced to download the patch immediately, a phenomenon similar to flash-crowds in web traffic. When patches are released during the daily minimum, less people download the patch immediately, however, as player load increases, the rising number of people who need the patch causes the problem to return. Given the variance in player populations of up to 50% between daily maximum and minimum [9], overprovisioning is an unattractive alternative. Our study proposes an inital model for patch delivery based on the time of release and evaluates it against patches delivered over a game-specific content delivery network called Steam. We use, as components of our model, player session times and interarrival times. Such data is readily available to any on-line game provider. Using statistics obtained from a popular Counter-Strike server, our model predicts an ideal patch release time that varies based on the goals of the service provider. For a service provider attempting to minimize peak bandwidth usage, a patch release exactly at the daily minimum is required. For a service provider attempting to minimize the cumulative bandwidth consumption across the first three days of the patch, a patch release occuring five hours after the peak player load is required. Since our evaluation only shows a coarse match between the model and the observed data, our results are somewhat preliminary. Section 2 discusses our methodology and data sets. Section 3 evaluates our model. Section 4 presents our conclusions and offers discussion of our work.
cs.mshmro.com trace Start time Tue Apr 1 2003 End time Mon May 31 2004 Total connections 2,886,992 Total unique players 493,889 Steam CDN trace Start time Mon Sep 27 2004 End time Mon Apr 8 2005 Content transferred 6,193 TB Average transfer rate 3.14 Gbs Table 1: Data sets 5000 Player count (1/51.48) Steam bandwidth
Megabits/second
4000
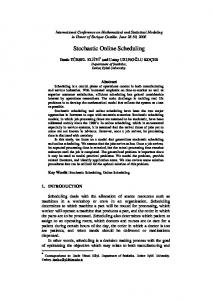
the Steam network is used for several distinct purposes: 1) all current players continuously download security modules that are used to detect cheating and 2) players and servers download new software patches to keep the game up to date. When patches are not being released, the bandwidth consumed by the Steam network should be roughly proportional to the number of active players. However, when new patches are released, the additional bandwidth consumed by patches varies over time. Initially, patch bandwidth is proportional to the number of current players. However, as more and more players download the patch, the bandwidth consumed decays significantly as the patched population increases. The patch in Figure 1 was released a few hours after the afternoon peak load. Because of the significant increase in bandwidth consumed during the release of a patch, it is of particular interest to estimate the likely load expected by releasing a patch at alternative times in the daily cycle.
2.2 3000
2000
1000
Mon
Tue
Wed
Thu Day of week
Fri
Sat
Sun
Figure 1: Bandwidth vs. players
Player bandwidth consumption
In order to determine the amount of bandwidth consumed by each player authenticating with Steam, we use a two-week section of the Steam bandwidth and player trace beginning January 25th, 2005. This is the longest section in our trace without significant patch activity. We denote the ith sample in this two-week player and bandwidth data as pi and si respectively. To test the hypothesis that each player consumes a constant amount of bandwidth, we compute the n X cumulative number of players cp = pi and bandwidth i=0
2. 2.1
METHODOLOGY Data sources
Studying on-line games is challenging because of the scarcity of public data. Game companies often keep statistics about their games private. However, we have obtained two unique sources of on-line gaming data: a trace from the game delivery network Steam, and a trace from a popular Counterstrike server cs.mshmro.com. The Steam game delivery network provides updates for a number of games such as Half-life, Counter-Strike, and Day of Defeat. The Steam network continuously exports data on the aggregate bandwidth being consumed by players as well as the number of unique players at any moment. Our data collection system records this data periodically at ten minute intervals. The other trace is from the server cs.mshmro.com, one of the busiest and longest running Counter-Strike servers in the country [10, 11]. The server itself is consistently among the busiest 20 servers as ranked by ServerSpy [12] and has logged more than 60 player years in activity since its launch in August 2001. The details of these two data sources are shown in Table 1. Our goal is to develop a model that accurately predicts the aggregate bandwidth load on the patch servers based on the timing of the patch release. In this paper, we focus on a specific patch released Monday, May 25th. Figure 1 shows the Steam load for the week with the patch, overlaid atop a scaled version of the player data. Note that
cb =
n X
si and scale the player data by the mean ratio
i=0
cb/cp. As Figure 3(a) shows, the player series follows the bandwidth series closely. However there are significant differences: the Steam data lags the player data by roughly an hour and a half and has been smoothed. We hypothesize that this is because the player data is not an instantaneous measure of player population. In Steam, active players are not in continuous contact with the central authentication server and players do not notify the central authentication server upon departure. Instead, active players only contact the central authentication server upon joining a new game server and upon map changes. As a result, the manner in which Steam must estimate its instantaneous player population is by counting the number of authentications in a sliding window. An additional source of differences between player count and bandwidth is the presence of server authentication data in the Steam bandwidth that is not represented in the player count. Servers authenticate, like players, upon startup and every map change. The discrepancy that comes about because of this smoothing, time lag, and inclusion of server authentication bandwidth becomes important when we consider subtracting the scaled player data from the bandwidth data in Figure 5. If the Steam bandwidth and player count corresponded perfectly, the mean ratio line would be flat, or random noise, with a jump upwards for the very small patches seen on days seven and eight. Unfortunately we see a pronounced daily variation that hides the patches instead.
1 5000
Mshmro session time histogram Curve fit
0.8
0.6 3000
percent
number of sessions
4000
0.4
2000
0.2
1000
20
40
80
60
100
120 140 minutes
160
180
200
220
0
240
0
20
40
80
60
(a) PDF
100
120 140 minutes
180
160
200
220
240
(b) CDF
Figure 2: Distribution of player session times at cs.mshmro.com
4000
4000 Steam bandwidth Player count (1/51.48)
3000
2500
2000
1500
1000
Steam bandwidth Player count (scaled by hour)
3500 bandwidth (megabits/second)
bandwidth (megabits/second)
3500
3000
2500
2000
1500
0
1
2
3
4
5
6
7 day
8
9
10
11
12
1000
13
0
1
2
(a) Mean scaling
3
4
5
6
7 day
8
9
10
11
12
13
(b) Hourly mean scaling
Figure 3: Scaling the player data by a constant ratio versus scaling by a ratio that varies by hour of day
1
40000 Msmro interarrival histogram Curve fit
0.8
30000
percent
0.6 20000
0.4 10000
0
0.2
0
1e+05
2e+05 Player minutes
(a) PDF
3e+05
4e+05
0
0
1e+07
2e+07
3e+07 player minutes
4e+07
(b) CDF
Figure 4: Distribution of player interarrival times at cs.mshmro.com
5e+07
6e+07
2000 Steam bandwidth without player authentication (mean ratio) Steam bandwidth without player authentication (hourly mean ratio)
bandwidth (megabits/second)
1500
1000
500
0
-500
-1000
0
1
2
3
4
5
6
7 day
8
9
10
11
12
13
Figure 5: Observed difference between player and bandwidth data under constant and hourly scaling In order to remove the effects of smoothing, skewing and server authentication data we compute the ratio of players to bandwidth per hour, for each hour of the day, as follows. 6i+5 X Let the player hourly average phai = 1/6 pi and let the j=6i
steam hourly average shai = 1/6
6i+5 X
si . Then the hourly
j=6i
mean ratio for hour i is defined as bn/24+1c
X hmri =
sha24j+i
j=0
(1)
bn/24+1c
X
pha24j+i
j=0
Figure 3(b) shows the results of scaling the player data with an hourly mean ratio. The daily anomolies have been removed from the Steam data, and as Figure 5 shows, the amount of variation in the difference between the two signals has been reduced by over 60%. Consequently, the small patch on day seven is more clearly visible.
2.3
Modeling player behavior
While aggregate player populations can be measured over time, the percentage of players out of the population that need to download the patch is only known at the time of the patch’s release when it is known that all players require the download. The percentage of players requiring an update afterwards is driven by user behavior. In particular, player session times, player arrival rates, and the fraction of arriving players that have previously downloaded the patch all determine the additional bandwidth consumed by the patch. To adequately predict the behavior of patch releases, we model the behavior of players as groups. Key player features of interest include the distribution of player session times as well as the distribution of time between their play sessions. While this information is not directly available to us due to the closed nature of the game authentication servers, we do have access to the data on our own game server. We make the assumption that the aggregate gaming population displays similar characteristics to the subset of
players on our server. Deriving player sessions from server logs is an interesting problem as only a few player events are recorded (kills, deaths, joins, leaves, and chat). While the presence of join/leave events seems ideal, players are observed to join and leave the server frequently in the same time period, partially due to game artifacts such as map changes. To construct player sessions, we strip away these artifacts and are left with an event series ES for each player i such that ES(i) = (t1 , t2 , ..., tk ) for a player with k time events recorded in seconds on our server. We then define a session to be a sequence of events (t1 , t2 , ..., tj ) such that ti+1 − ti < 1800: events within 30 minutes of each other. Figure 2 shows the histogram of session times recorded on cs.mshmro.com. The distribution has a number of extremely long sessions, which we ignore as game artifacts resulting from the presence of reserved slots and permanent players. Additionally we filter out sessions shorter than one minute in length. We fit this curve to a sum of exponentials of the form aebx + cedx with (a = 3710, b = −0.02534, c = 2970, d = −0.2917), which fits with a correlation coefficient of 0.996. Figure 2 also shows the cumulative distribution function (CDF) of the data. Of particular interest to us is the ten minute mark, which tells us that 19.35% of all users have session times of ten minutes or less. As our results show, this estimate is one possible source of error. We derive the estimated interarrival rate for players based on the session data as well. Figure 4 shows the resultant PDF and CDF. We find the best fit to the distribution to be a power series of the form f (x) = axb where (a = 1.579e007, b = −1.016). This fit has an correlation coefficient of 0.98.
2.4
Modeling unpatched players
The data we have tells us the number of aggregate players playing at each moment since the patch release. For time t, we call this Pt , with time zero being the moment of the P patch release, and we define P Mt = i0 Pi as the cumulative player-minutes since the patch. In order to model the impact of the patch release we must know, at each moment in time after the release, the number of connected players who need the patch. One key datum we are missing, however, is the number of players who have already downloaded the patch, as opposed to those who still need it. We work to derive this quantity from our known values with the following model. new(t) = Pt − cur(t) ∗ Pt−1 − ret(P Mt ) ∗ Pt
(2)
where new(t) represents the number of arriving players who need the patch, cur(t) the percentage of current players that are still playing from the previous sample Pt−1 and ret(t) the percentage of current players who are returning who do not need the patch. Note that while our model appears to be independent of the total player population, it is actually implicitly included through our use of Pt from the observed traces of player population. The model partitions the number of players at a given moment into one of these three categories: those arriving who need the patch, those arriving who do not need the patch, and players who are still playing after downloading the patch at the beginning
30
25
Minimized load count
Peak Bandwidth (GB/s)
40
30
20
20
15
10
5 10
0
2
4
6
8
10 12 14 Hour of release
16
18
20
22
24
Figure 6: Peak predicted bandwidth based on moment of release.
0
0
2
4
6
8
10 12 14 Hour of patch release
16
18
20
22
24
Figure 8: Number of times a particular release moment minimizes cumulative bandwidth
5e+08
peak Steam trough
4e+08
Megabits
3e+08
2e+08
1e+08
0
0
1
Days since patch
2
3
Figure 7: Predicted cumulative load for each 10minute timeslot of the day. of their sessions. We model cur(t) as a constant percentage of 80.65%, based on our session time CDF (Figure 2). Intuitively as time progresses, ret(t) should approach one, at which point all or nearly all of the players have received the patch. A key observation to our model of ret(t) is that the percentage of players returning to play after t minutes or less is the same as the percentage of players whose intersession time is less than or equal to t (Figure 4). We calculate ret(t) based on player-minutes instead of time alone to reflect the impact of the daily cycle.
3.
EVALUATION
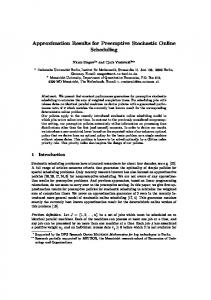
We first evaluate our model’s prediction of peak bandwith in Figure 6. Note that all times are given in the local time of our measurements (GMT-0700). As expected, peak bandwidth is minimized by a release at the minimum player load at 22 hours, and maximixed at the 13 hour player maximum. Next we use the model to minimize cumulative load throughout the first three days. Figure 7 shows the predicted load given by our model for every possible release moment during the day the patch was released. We highlight the cumulative load predicted by a patch release at the daily peak and trough of player load, as well as the load predicted by the actual patch release time. While all lines converge to
roughly the same cumulative load at the end of the three day period, the actual patch release line appears to minimize bandwidth delivered along the way, suggesting that a patch release approximately 40% of the distance between the peak and trough is optimal. We quantify this in Figure 8 by counting the number of times a given patch release would minimize cumulative bandwidth throughout the release. Note that all of the release times that minimize cumulative bandwidth are between the 13 hour peak player population and the 22 hour trough. The model suggests an optimal release at nearly five hours past the peak, which is when the patch was released. Next we compare our model with the observed excess load for this patch. Figure 9(a) shows our predicted load as compared to the observed load. As we do not have definitive data on the size of patches, we have scaled the predicted model to start at the same point as the observed. The model drops off extremely sharply compared to the data, due to the cur(t) factor in equation 2. There are two reasons why this is the case. The first is that our model does not include server patching. Servers are brought up and down throughout the day just as players join and leave throughout the day. When servers are up, they check for software patches every time they change maps (typically every 30 minutes). Since the number of servers is around 20,000 at any given point in time, our model underestimates the initial bandwidth consumption by only including player downloads. We aim to include a model for servers in future work. Another reason for the inaccuracy of the model is that our session data ignores all sessions less than one minute in duration. Since more than 60% of all sessions last less than a minute, our model substantially overestimates cur(t). As a result, session times are not representative and undercount the ratio of players with long sessions, we see the more accurate prediction seen in Figure 9(b) shows a more accurate prediction using a reduced value for cur(t). Another discrepancy between the model and the observed data is the increased presence of daily cycles in the data. These cycles appear in the model, but with less impact. As described in Section 2, this is due to the smoothing and skewing of the player data versus the bandwidth data. Af-
3000
3000
Observed load Predicted load
Predicted load Observed load
2000 Bandwidth (MB/s)
Bandwidth (MB/s)
2000
1000
1000
0
0
-1000
0
24
48
72 96 Hours since patch release
120
144
0
168
24
(a) cur(t) = .81
48
72 96 Hours since patch release
120
144
168
(b) cur(t) = .10
Figure 9: Predicted load from model 2000
our prediction.
actual predicted
5.
Bandwidth (Mb/s)
1500
1000
500
0
0
24
48
72 Hours since patch
96
120
144
Figure 10: Predicted versus observed after 24-hour smoothing
ter removing the cycles via windowed averaging, Figure 10 shows a much better fit.
4.
CONCLUSIONS
Game companies and hosts have a significant challenge before them: how to release content such that the bandwidth deliver load is not overwhelming. This problem is particularly urgent for games that require all players to be synchronized on the same version. Given the cyclic nature of player loads, the time of day of the release can significantly impact peak bandwidth and sustained bandwidth over the first few days. The key contributions of this work are the presentation of a novel problem and an initial modeling approach. We have constructed a predictive model of bandwidth load based on time of day using statistics about player arrivals and session times. To minimize peak bandwidth, our model suggests the expected release at minimum player load. To minimize cumulative patch load in the first three days, our model suggests a release of five hours after the peak player population. Our model’s ability to predict bandwidth load after release is relatively weak, perhaps due to inaccuracies in our player statistics. We expect future work on the problem to improve
REFERENCES
[1] IBM Corp., “On demand business,” http://www.ibm.com/ondemand. [2] IDC, “HP utility data center: Enabling enhanced data center agility,” http://www.hp.com/large/ globalsolutions/ae/pdfs/udc_enabling.pdf, May 2003. [3] Sun Microsystems, “N1 Grid – introducing just in time computing,” http: //wwws.sun.com/software/solutions/n1/wp-n1.pdf, 2003. [4] Global Grid Forum, ,” http://www.ggf.org. [5] IBM Corp., “Tivoli intelligent thinkdynamic orchestrator,” http://www.ibm.com/software/ tivoli/products/intell-orch, 2004. [6] E. Manoel et al., Provisioning On Demand: Introducing IBM Tivoli Intelligent ThinkDynamic Orchestrator, IBM International Technical Support Organization, December 2003, http://www.redbooks.ibm.com. [7] D. Saha, S. Sahu, and A. Shaikh, “A Service Platform for On-Line Games,” in NetGames, Redwood City, CA 2003. [8] A. Shaikh, S. Sahu, M. Rosu, M. Shea, and D. Saha, “Implementation of a Service Platform for Online Games,” in NetGames, August 2004. [9] Valve, Inc., “Steam,” http://www.steampowered.com/, 2005. [10] mshmro.com, ,” http://www.mshmro.com/. [11] W. Feng, F. Chang, W. Feng, and J. Walpole, “Provisioning On-line Games: A Traffic Analysis of a Busy Counter-Strike Server,” in Proc. of the Internet Measurement Workshop, November 2002. [12] ServerSpy, “ServerSpy.Net: World Server Ranks,” http://www.serverspy.net/site/serverranks/, 2004.