Dec 6, 2018 - circles) signals the instability, which eventually materi- alises in a topology driven pattern, .... caption of Fig. 3), with δ = 0.2. The remaining ...
Patterns of non-normality in networked systems Riccardo Muolo1 , Malbor Asllani2,3 , Duccio Fanelli4 , Philip K. Maini2 , Timoteo Carletti5 , 1
arXiv:1812.02514v1 [nlin.PS] 6 Dec 2018
Systems Bioinformatics, Vrije Universiteit Amsterdam, De Boelelaan 1108, 1081 HZ, Amsterdam, The Netherlands 2 Mathematical Institute, University of Oxford, Woodstock Rd, OX2 6GG Oxford, UK 3 MACSI, Department of Mathematics and Statistics, University of Limerick, Limerick V94 T9PX, Ireland 4 Dipartimento di Fisica e Astronomia, Universit´ a di Firenze, INFN and CSDC, Via Sansone 1, 50019 Sesto Fiorentino, Firenze, Italy and 5 Department of Mathematics and naXys, Namur Institute for Complex Systems, University of Namur, rempart de la Vierge 8, B 5000 Namur, Belgium (Dated: December 7, 2018) Several mechanisms have been proposed to explain the spontaneous generation of self-organized patterns, hypothesised to play a role in the formation of many of the magnificent patterns observed in Nature. In several cases of interest, the system under scrutiny displays a homogeneous equilibrium, which is destabilized via a symmetry breaking instability which reflects the specificity of the problem being inspected. The Turing instability is among the most celebrated paradigms for pattern formation. In its original form, the diffusion constants of the two mobile species need to be quite different from each other for the instability to develop. Unfortunately, this condition limits the applicability of the theory. To overcome this impediment, and with the ambitious long term goal to eventually reconcile theory and experiments, we here propose an alternative mechanism for promoting the onset of patterns. To this end a multi-species reaction-diffusion system is studied on a discrete, network-like support: the instability is triggered by the non-normality of the embedding network. The non-normal character of the dynamics instigates a short time amplification of the imposed perturbation, thus making the system unstable for a choice of parameters that would yield stability under the conventional scenario. Importantly, non-normal networks are pervasively found, as we shall here briefly review.
I.
INTRODUCTION
We are surrounded by spatially heterogeneous patterns [1, 2]. In many applications, the interplay between microscopic entities is modelled by means of reactiondiffusion equations, partial differential equations which govern the deterministic evolution of the concentrations in a multi-species model, across time and space. Homogeneous equilibria of a generic reaction-diffusion system may undergo a symmetry breaking instability, when exposed to a heterogeneous perturbation, and this underlies the self-organization theory of pattern-formation. The instability can develop according to different modalities, depending on the specificity of the system under consideration. Among existing approaches, the celebrated Turing instability occupies a prominent role [3]. The condition for the emergence of Turing patterns has been elegantly grounded in an interplay between slow diffusing activators and fast diffusing inhibitors [4]. Indeed, the parameter space for which the instability materializes shrinks to zero when the ratio of the diffusion constants tends to 1, an observation that limits the range of applicability of the theory, at least in its original conception. To state it differently, the condition for the Turing instability are solely met in a small region of the available parameter space, in stark contrast with the diversity of patterns that are routinely found across different fields and scales [5]. Considering more than two families of interacting entities and accounting for the role of en-
dogenous or exogenous noise enhance the robustness of the scheme and partially overcome the above limitations [6, 7]. In their pioneering paper, Othmer & Scriven [8], extended the Turing theory of pattern formation to reaction-diffusion systems defined on several discrete lattices, in arbitrary dimensions. More recently Nakao & Mikhailov [9] extended the analysis to systems defined on complex networks, a setting that is relevant too; for example, multispecies systems confined in compartimentalized geometries [10], optically controlled bioreactors [11], bistable chemical networks [12] and neuroscience [13]. The dispersion relation, that ultimately signals the onset of the instability, is a function of the discrete spectrum of the Laplacian matrix, i.e. the diffusion operator, associated to the underlying network. Laplacian eigenvalues set the spatial characteristics of the emerging patterns, when the system under scrutiny is rooted on a heterogeneous support. Patterns for systems evolved on complex graphs yield a macroscopic segregation into activator-rich and activator-poor nodes [9]. They are termed Turing patterns, because of the analogy with their continuum counterparts. For undirected (symmetric) networks, the topology defines the relevant directions for the spreading of the perturbation, but cannot impact on the onset of the instability. Network asymmetry can however trigger the system unstable, seeding the emergence of a generalised class of topology driven patterns, which extends beyond the conventional Turing scenario [14].
2 (a)
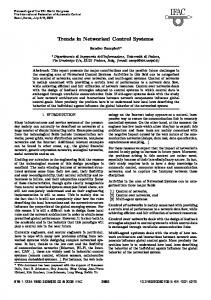
Starting from these premises, we here set to explore a new situation that is faced when the network of connections is non-normal [15, 16], hence inherently asymmetric, but the ensuing dynamics proves stable under a standard linear stability analysis. Otherwise stated, we will deal with homogeneous equilibria which are deemed stable and rely on the short time amplification of the perturbation, as instigated by the non-normal character of the network, to find a path towards the heterogeneous attractor. Non-normal patterns display a characteristic amplitude, comparable to that associated with their conventional homologues. Small initial perturbations, selfconsistently amplified by the non-normality, suffice to cross the barrier which separates the basins of attraction of, respectively, the homogeneous and heterogeneous solutions. The latter can be ideally pictured as the minima of a generalised energy landscape, as schematically highlighted in Fig. 1. Equally small perturbations cannot trigger the instability when the system is instead defined on a symmetrised version of the non-normal support. The net effect is a contraction of the basin of attraction of the homogeneous fixed point, as produced by the imposed degree of non-normality.
symmetric network B1 AAAB6nicbVBNS8NAEJ3Ur1q/qh69LBbBU0lEqMdSLx4r2g9oQ9lsN+3SzSbsToQS+hO8eFDEq7/Im//GbZuDtj4YeLw3w8y8IJHCoOt+O4WNza3tneJuaW//4PCofHzSNnGqGW+xWMa6G1DDpVC8hQIl7yaa0yiQvBNMbud+54lrI2L1iNOE+xEdKREKRtFKD42BNyhX3Kq7AFknXk4qkKM5KH/1hzFLI66QSWpMz3MT9DOqUTDJZ6V+anhC2YSOeM9SRSNu/Gxx6oxcWGVIwljbUkgW6u+JjEbGTKPAdkYUx2bVm4v/eb0Uwxs/EypJkSu2XBSmkmBM5n+TodCcoZxaQpkW9lbCxlRThjadkg3BW315nbSvqp5b9e6vK/VGHkcRzuAcLsGDGtThDprQAgYjeIZXeHOk8+K8Ox/L1oKTz5zCHzifP7ldjWo=
A1 AAAB6nicbVBNS8NAEJ3Ur1q/qh69LBbBU0lEqMeqF48V7Qe0oWy2m3bpZhN2J0IJ/QlePCji1V/kzX/jts1BWx8MPN6bYWZekEhh0HW/ncLa+sbmVnG7tLO7t39QPjxqmTjVjDdZLGPdCajhUijeRIGSdxLNaRRI3g7GtzO//cS1EbF6xEnC/YgOlQgFo2ilh+u+1y9X3Ko7B1klXk4qkKPRL3/1BjFLI66QSWpM13MT9DOqUTDJp6VeanhC2ZgOeddSRSNu/Gx+6pScWWVAwljbUkjm6u+JjEbGTKLAdkYUR2bZm4n/ed0Uwys/EypJkSu2WBSmkmBMZn+TgdCcoZxYQpkW9lbCRlRThjadkg3BW355lbQuqp5b9e4vK/WbPI4inMApnIMHNajDHTSgCQyG8Ayv8OZI58V5dz4WrQUnnzmGP3A+fwC3141p sha1_base64="hP+6LrUf2d3tZaldqaQQvEKMXyw=">AAAB2XicbZDNSgMxFIXv1L86Vq1rN8EiuCozbnQpuHFZwbZCO5RM5k4bmskMyR2hDH0BF25EfC93vo3pz0JbDwQ+zknIvSculLQUBN9ebWd3b/+gfugfNfzjk9Nmo2fz0gjsilzl5jnmFpXU2CVJCp8LgzyLFfbj6f0i77+gsTLXTzQrMMr4WMtUCk7O6oyaraAdLMW2IVxDC9YaNb+GSS7KDDUJxa0dhEFBUcUNSaFw7g9LiwUXUz7GgUPNM7RRtRxzzi6dk7A0N+5oYkv394uKZ9bOstjdzDhN7Ga2MP/LBiWlt1EldVESarH6KC0Vo5wtdmaJNChIzRxwYaSblYkJN1yQa8Z3HYSbG29D77odBu3wMYA6nMMFXEEIN3AHD9CBLghI4BXevYn35n2suqp569LO4I+8zx84xIo4 sha1_base64="prGb3x2WGT0iK/ZzVgZxWmWTnzo=">AAAB33icbZDNSgMxFIXv1L9aq1a3boJFcFVm3OhSceOyoq2FdiiZ9E4bmskMyR2hDH0ENy4U8a3c+TamPwttPRD4OCch954oU9KS7397pY3Nre2d8m5lr7p/cFg7qrZtmhuBLZGq1HQiblFJjS2SpLCTGeRJpPApGt/O8qdnNFam+pEmGYYJH2oZS8HJWQ83/aBfq/sNfy62DsES6rBUs1/76g1SkSeoSShubTfwMwoLbkgKhdNKL7eYcTHmQ+w61DxBGxbzUafszDkDFqfGHU1s7v5+UfDE2kkSuZsJp5FdzWbmf1k3p/gqLKTOckItFh/FuWKUstnebCANClITB1wY6WZlYsQNF+TaqbgSgtWV16F90Qj8RnDvQxlO4BTOIYBLuIY7aEILBAzhBd7g3VPeq/exqKvkLXs7hj/yPn8Ant6MFA== sha1_base64="fbFIzqp/nBk1y9qVWjSl7QSMlwA=">AAAB6nicbVBNS8NAEJ3Ur1q/oh69LBbBU0m86LHqxWNF+wFtKJvtpl262YTdiVBCf4IXD4p49Rd589+4bXPQ1gcDj/dmmJkXplIY9Lxvp7S2vrG5Vd6u7Ozu7R+4h0ctk2Sa8SZLZKI7ITVcCsWbKFDyTqo5jUPJ2+H4dua3n7g2IlGPOEl5ENOhEpFgFK30cN33+27Vq3lzkFXiF6QKBRp996s3SFgWc4VMUmO6vpdikFONgkk+rfQyw1PKxnTIu5YqGnMT5PNTp+TMKgMSJdqWQjJXf0/kNDZmEoe2M6Y4MsveTPzP62YYXQW5UGmGXLHFoiiTBBMy+5sMhOYM5cQSyrSwtxI2opoytOlUbAj+8surpHVR872af+9V6zdFHGU4gVM4Bx8uoQ530IAmMBjCM7zCmyOdF+fd+Vi0lpxi5hj+wPn8AbaXjWU=
x x⇤ AAAB6nicbVBNS8NAEJ34WetX1aOXxSKIh5KIoMeiF48V7Qe0sWy2m3bpZhN2J2IJ/QlePCji1V/kzX/jts1BWx8MPN6bYWZekEhh0HW/naXlldW19cJGcXNre2e3tLffMHGqGa+zWMa6FVDDpVC8jgIlbyWa0yiQvBkMryd+85FrI2J1j6OE+xHtKxEKRtFKd08Pp91S2a24U5BF4uWkDDlq3dJXpxezNOIKmaTGtD03QT+jGgWTfFzspIYnlA1pn7ctVTTixs+mp47JsVV6JIy1LYVkqv6eyGhkzCgKbGdEcWDmvYn4n9dOMbz0M6GSFLlis0VhKgnGZPI36QnNGcqRJZRpYW8lbEA1ZWjTKdoQvPmXF0njrOK5Fe/2vFy9yuMowCEcwQl4cAFVuIEa1IFBH57hFd4c6bw4787HrHXJyWcO4A+czx//gI2Y
x AAACBnicbVDLSsNAFJ34rPUVdSnCYBFEsCQi6LLoxmUF+4A2lsl00g6dTMLMjbSErNz4K25cKOLWb3Dn3zhpu9DWAxcO59w7c+/xY8E1OM63tbC4tLyyWlgrrm9sbm3bO7t1HSWKshqNRKSaPtFMcMlqwEGwZqwYCX3BGv7gOvcbD0xpHsk7GMXMC0lP8oBTAkbq2AfD+/QkO20DG0JKABShuYHNm1xmHbvklJ0x8Dxxp6SEpqh27K92N6JJyCRQQbRuuU4MXkoUcCpYVmwnmsWEDkiPtQyVJGTaS8dnZPjIKF0cRMqUBDxWf0+kJNR6FPqmMyTQ17NeLv7ntRIILr2UyzgBJunkoyARGCKcZ4K7XDEKYmQIoYqbXTHtkzwKk1zRhODOnjxP6mdl1ym7t+elytU0jgLaR4foGLnoAlXQDaqiGqLoET2jV/RmPVkv1rv1MWldsKYze+gPrM8f/LOZcQ==
⇤
(b)
attraction basin
x
nb
n
non-normal network A1 AAAB6nicbVBNS8NAEJ3Ur1q/qh69LBbBU0lEqMeqF48V7Qe0oWy2m3bpZhN2J0IJ/QlePCji1V/kzX/jts1BWx8MPN6bYWZekEhh0HW/ncLa+sbmVnG7tLO7t39QPjxqmTjVjDdZLGPdCajhUijeRIGSdxLNaRRI3g7GtzO//cS1EbF6xEnC/YgOlQgFo2ilh+u+1y9X3Ko7B1klXk4qkKPRL3/1BjFLI66QSWpM13MT9DOqUTDJp6VeanhC2ZgOeddSRSNu/Gx+6pScWWVAwljbUkjm6u+JjEbGTKLAdkYUR2bZm4n/ed0Uwys/EypJkSu2WBSmkmBMZn+TgdCcoZxYQpkW9lbCRlRThjadkg3BW355lbQuqp5b9e4vK/WbPI4inMApnIMHNajDHTSgCQyG8Ayv8OZI58V5dz4WrQUnnzmGP3A+fwC3141p sha1_base64="hP+6LrUf2d3tZaldqaQQvEKMXyw=">AAAB2XicbZDNSgMxFIXv1L86Vq1rN8EiuCozbnQpuHFZwbZCO5RM5k4bmskMyR2hDH0BF25EfC93vo3pz0JbDwQ+zknIvSculLQUBN9ebWd3b/+gfugfNfzjk9Nmo2fz0gjsilzl5jnmFpXU2CVJCp8LgzyLFfbj6f0i77+gsTLXTzQrMMr4WMtUCk7O6oyaraAdLMW2IVxDC9YaNb+GSS7KDDUJxa0dhEFBUcUNSaFw7g9LiwUXUz7GgUPNM7RRtRxzzi6dk7A0N+5oYkv394uKZ9bOstjdzDhN7Ga2MP/LBiWlt1EldVESarH6KC0Vo5wtdmaJNChIzRxwYaSblYkJN1yQa8Z3HYSbG29D77odBu3wMYA6nMMFXEEIN3AHD9CBLghI4BXevYn35n2suqp569LO4I+8zx84xIo4 sha1_base64="prGb3x2WGT0iK/ZzVgZxWmWTnzo=">AAAB33icbZDNSgMxFIXv1L9aq1a3boJFcFVm3OhSceOyoq2FdiiZ9E4bmskMyR2hDH0ENy4U8a3c+TamPwttPRD4OCch954oU9KS7397pY3Nre2d8m5lr7p/cFg7qrZtmhuBLZGq1HQiblFJjS2SpLCTGeRJpPApGt/O8qdnNFam+pEmGYYJH2oZS8HJWQ83/aBfq/sNfy62DsES6rBUs1/76g1SkSeoSShubTfwMwoLbkgKhdNKL7eYcTHmQ+w61DxBGxbzUafszDkDFqfGHU1s7v5+UfDE2kkSuZsJp5FdzWbmf1k3p/gqLKTOckItFh/FuWKUstnebCANClITB1wY6WZlYsQNF+TaqbgSgtWV16F90Qj8RnDvQxlO4BTOIYBLuIY7aEILBAzhBd7g3VPeq/exqKvkLXs7hj/yPn8Ant6MFA== sha1_base64="fbFIzqp/nBk1y9qVWjSl7QSMlwA=">AAAB6nicbVBNS8NAEJ3Ur1q/oh69LBbBU0m86LHqxWNF+wFtKJvtpl262YTdiVBCf4IXD4p49Rd589+4bXPQ1gcDj/dmmJkXplIY9Lxvp7S2vrG5Vd6u7Ozu7R+4h0ctk2Sa8SZLZKI7ITVcCsWbKFDyTqo5jUPJ2+H4dua3n7g2IlGPOEl5ENOhEpFgFK30cN33+27Vq3lzkFXiF6QKBRp996s3SFgWc4VMUmO6vpdikFONgkk+rfQyw1PKxnTIu5YqGnMT5PNTp+TMKgMSJdqWQjJXf0/kNDZmEoe2M6Y4MsveTPzP62YYXQW5UGmGXLHFoiiTBBMy+5sMhOYM5cQSyrSwtxI2opoytOlUbAj+8surpHVR872af+9V6zdFHGU4gVM4Bx8uoQ530IAmMBjCM7zCmyOdF+fd+Vi0lpxi5hj+wPn8AbaXjWU=
A2 x00 AAAB+XicbVBNSwMxEJ2tX7V+rXr0EiyCp7Irgh6LXjxWsB/QriWbTtvQbHZJssWy9J948aCIV/+JN/+NabsHbX0ww+O9GTJ5YSK4Np737RTW1jc2t4rbpZ3dvf0D9/CooeNUMayzWMSqFVKNgkusG24EthKFNAoFNsPR7cxvjlFpHssHM0kwiOhA8j5n1Fip67pPj1knUTzCRZ923bJX8eYgq8TPSRly1LruV6cXszRCaZigWrd9LzFBRpXhTOC01Ek1JpSN6ADblkoaoQ6y+eVTcmaVHunHypY0ZK7+3shopPUkCu1kRM1QL3sz8T+vnZr+dZBxmaQGJVs81E8FMTGZxUB6XCEzYmIJZYrbWwkbUkWZsWGVbAj+8pdXSeOi4nsV//6yXL3J4yjCCZzCOfhwBVW4gxrUgcEYnuEV3pzMeXHenY/FaMHJd47hD5zPH0CTlAs=
x⇤ AAAB6nicbVBNS8NAEJ34WetX1aOXxSKIh5KIoMeiF48V7Qe0sWy2m3bpZhN2J2IJ/QlePCji1V/kzX/jts1BWx8MPN6bYWZekEhh0HW/naXlldW19cJGcXNre2e3tLffMHGqGa+zWMa6FVDDpVC8jgIlbyWa0yiQvBkMryd+85FrI2J1j6OE+xHtKxEKRtFKd08Pp91S2a24U5BF4uWkDDlq3dJXpxezNOIKmaTGtD03QT+jGgWTfFzspIYnlA1pn7ctVTTixs+mp47JsVV6JIy1LYVkqv6eyGhkzCgKbGdEcWDmvYn4n9dOMbz0M6GSFLlis0VhKgnGZPI36QnNGcqRJZRpYW8lbEA1ZWjTKdoQvPmXF0njrOK5Fe/2vFy9yuMowCEcwQl4cAFVuIEa1IFBH57hFd4c6bw4787HrHXJyWcO4A+czx//gI2Y
x⇤
attraction basin
AAACBnicbVDLSsNAFJ34rPUVdSnCYBFEsCQi6LLoxmUF+4A2lsl00g6dTMLMjbSErNz4K25cKOLWb3Dn3zhpu9DWAxcO59w7c+/xY8E1OM63tbC4tLyyWlgrrm9sbm3bO7t1HSWKshqNRKSaPtFMcMlqwEGwZqwYCX3BGv7gOvcbD0xpHsk7GMXMC0lP8oBTAkbq2AfD+/QkO20DG0JKABShuYHNm1xmHbvklJ0x8Dxxp6SEpqh27K92N6JJyCRQQbRuuU4MXkoUcCpYVmwnmsWEDkiPtQyVJGTaS8dnZPjIKF0cRMqUBDxWf0+kJNR6FPqmMyTQ17NeLv7ntRIILr2UyzgBJunkoyARGCKcZ4K7XDEKYmQIoYqbXTHtkzwKk1zRhODOnjxP6mdl1ym7t+elytU0jgLaR4foG
(c)
x00
attraction basin
AAACEXicbVDLTgIxFO3gC/GFunTTSEzYSGaMiS6JblxiIo8EkHTKBRo6nUl7x0Am/IIbf8WNC41x686df2MHWCh4kjYn59x723v8SAqDrvvtZFZW19Y3spu5re2d3b38/kHNhLHmUOWhDHXDZwakUFBFgRIakQYW+BLq/vA69esPoI0I1R2OI2gHrK9ET3CGVurki6P7pBVpEcDsnpy2EEaYMETNeFpD7XihJp18wS25U9Bl4s1JgcxR6eS/Wt2QxwEo5JIZ0/TcCNsJ0yi4hEmuFRuIGB+yPjQtVSwA006mG03oiVW6tBdqexTSqfq7I2GBMePAt5UBw4FZ9FLxP68ZY++ynQgVxQiKzx7qxZJiSNN4aFdo4CjHljCuhf0r5QOWRmFDzNkQvMWVl0ntrOS5Je/2vFC+mseRJUfkmBSJRy5ImdyQCqkSTh7JM3klb86T8+K8Ox+z0owz7zkkf+B8/gB3e56n
non-normal transient A1 AAAB6nicbVBNS8NAEJ3Ur1q/qh69LBbBU0lEqMeqF48V7Qe0oWy2m3bpZhN2J0IJ/QlePCji1V/kzX/jts1BWx8MPN6bYWZekEhh0HW/ncLa+sbmVnG7tLO7t39QPjxqmTjVjDdZLGPdCajhUijeRIGSdxLNaRRI3g7GtzO//cS1EbF6xEnC/YgOlQgFo2ilh+u+1y9X3Ko7B1klXk4qkKPRL3/1BjFLI66QSWpM13MT9DOqUTDJp6VeanhC2ZgOeddSRSNu/Gx+6pScWWVAwljbUkjm6u+JjEbGTKLAdkYUR2bZm4n/ed0Uwys/EypJkSu2WBSmkmBMZn+TgdCcoZxYQpkW9lbCRlRThjadkg3BW355lbQuqp5b9e4vK/WbPI4inMApnIMHNajDHTSgCQyG8Ayv8OZI58V5dz4WrQUnnzmGP3A+fwC3141p sha1_base64="hP+6LrUf2d3tZaldqaQQvEKMXyw=">AAAB2XicbZDNSgMxFIXv1L86Vq1rN8EiuCozbnQpuHFZwbZCO5RM5k4bmskMyR2hDH0BF25EfC93vo3pz0JbDwQ+zknIvSculLQUBN9ebWd3b/+gfugfNfzjk9Nmo2fz0gjsilzl5jnmFpXU2CVJCp8LgzyLFfbj6f0i77+gsTLXTzQrMMr4WMtUCk7O6oyaraAdLMW2IVxDC9YaNb+GSS7KDDUJxa0dhEFBUcUNSaFw7g9LiwUXUz7GgUPNM7RRtRxzzi6dk7A0N+5oYkv394uKZ9bOstjdzDhN7Ga2MP/LBiWlt1EldVESarH6KC0Vo5wtdmaJNChIzRxwYaSblYkJN1yQa8Z3HYSbG29D77odBu3wMYA6nMMFXEEIN3AHD9CBLghI4BXevYn35n2suqp569LO4I+8zx84xIo4 sha1_base64="prGb3x2WGT0iK/ZzVgZxWmWTnzo=">AAAB33icbZDNSgMxFIXv1L9aq1a3boJFcFVm3OhSceOyoq2FdiiZ9E4bmskMyR2hDH0ENy4U8a3c+TamPwttPRD4OCch954oU9KS7397pY3Nre2d8m5lr7p/cFg7qrZtmhuBLZGq1HQiblFJjS2SpLCTGeRJpPApGt/O8qdnNFam+pEmGYYJH2oZS8HJWQ83/aBfq/sNfy62DsES6rBUs1/76g1SkSeoSShubTfwMwoLbkgKhdNKL7eYcTHmQ+w61DxBGxbzUafszDkDFqfGHU1s7v5+UfDE2kkSuZsJp5FdzWbmf1k3p/gqLKTOckItFh/FuWKUstnebCANClITB1wY6WZlYsQNF+TaqbgSgtWV16F90Qj8RnDvQxlO4BTOIYBLuIY7aEILBAzhBd7g3VPeq/exqKvkLXs7hj/yPn8Ant6MFA== sha1_base64="fbFIzqp/nBk1y9qVWjSl7QSMlwA=">AAAB6nicbVBNS8NAEJ3Ur1q/oh69LBbBU0m86LHqxWNF+wFtKJvtpl262YTdiVBCf4IXD4p49Rd589+4bXPQ1gcDj/dmmJkXplIY9Lxvp7S2vrG5Vd6u7Ozu7R+4h0ctk2Sa8SZLZKI7ITVcCsWbKFDyTqo5jUPJ2+H4dua3n7g2IlGPOEl5ENOhEpFgFK30cN33+27Vq3lzkFXiF6QKBRp996s3SFgWc4VMUmO6vpdikFONgkk+rfQyw1PKxnTIu5YqGnMT5PNTp+TMKgMSJdqWQjJXf0/kNDZmEoe2M6Y4MsveTPzP62YYXQW5UGmGXLHFoiiTBBMy+5sMhOYM5cQSyrSwtxI2opoytOlUbAj+8surpHVR872af+9V6zdFHGU4gVM4Bx8uoQ530IAmMBjCM7zCmyOdF+fd+Vi0lpxi5hj+wPn8AbaXjWU=
A2 AAAB6nicbVBNS8NAEJ3Ur1q/qh69LBbBU0mKoMeqF48V7Qe0oWy2k3bpZhN2N0IJ/QlePCji1V/kzX/jts1BWx8MPN6bYWZekAiujet+O4W19Y3NreJ2aWd3b/+gfHjU0nGqGDZZLGLVCahGwSU2DTcCO4lCGgUC28H4dua3n1BpHstHM0nQj+hQ8pAzaqz0cN2v9csVt+rOQVaJl5MK5Gj0y1+9QczSCKVhgmrd9dzE+BlVhjOB01Iv1ZhQNqZD7FoqaYTaz+anTsmZVQYkjJUtachc/T2R0UjrSRTYzoiakV72ZuJ/Xjc14ZWfcZmkBiVbLApTQUxMZn+TAVfIjJhYQpni9lbCRlRRZmw6JRuCt/zyKmnVqp5b9e4vKvWbPI4inMApnIMHl1CHO2hAExgM4Rle4c0Rzovz7nwsWgtOPnMMf+B8/gC5W41q
The role of non-normality has been already studied in [17], where it was shown that reactivity, i.e. the amplification of the disturbance as seeded by the non-normal nature of the reaction terms, is a necessary condition for the onset of classical Turing patterns, i.e. patterns ensuing from a reaction-diffusion system defined on continuous. Endogenous noise, or perpetual exogenous perturbations, can effectively contribute to the stabilisation of the patterns [18], the more effectively the larger the degree of non-normality of the reaction component [19]. At variance with the former studies, we shall hereafter focus on the non-normality as stemming from the couplings which define the spatial support of the investigated model. The reason for such a choice is twofold: on the one hand, existing reaction models do not exhibit a large non-normal behaviour [20], and on the other hand, a strong non-normality manifests as a natural property of empirical networks, as it has been recently reported in [21]. In conclusion, based on the above, we can affirm that the non-normal nature of the imposed spatial couplings contributes to significantly enlarging the parameter space where patterns are predicted to occur, potentially increasing the applicability of the theory. The paper is organised as follows: in the next section we will introduce the mathematical framework and then turn, in Section III, to discussing the emergence of pattern for a reaction-diffusion model defined on a nonnormal, network-like support. In Section IV we will develop the concept of pseudo-dispersion relation for predicting the onset of the non-normal instability. This serves as a powerful diagnostic tool beyond the linear order of approximation, as routinely employed. Finally, in Section V we summarise up and draw our conclusion.
x00 AAAB+XicbVBNSwMxEJ2tX7V+rXr0EiyCp7Irgh6LXjxWsB/QriWbTtvQbHZJssWy9J948aCIV/+JN/+NabsHbX0ww+O9GTJ5YSK4Np737RTW1jc2t4rbpZ3dvf0D9/CooeNUMayzWMSqFVKNgkusG24EthKFNAoFNsPR7cxvjlFpHssHM0kwiOhA8j5n1Fip67pPj1knUTzCRZ923bJX8eYgq8TPSRly1LruV6cXszRCaZigWrd9LzFBRpXhTOC01Ek1JpSN6ADblkoaoQ6y+eVTcmaVHunHypY0ZK7+3shopPUkCu1kRM1QL3sz8T+vnZr+dZBxmaQGJVs81E8FMTGZxUB6XCEzYmIJZYrbWwkbUkWZsWGVbAj+8pdXSeOi4nsV//6yXL3J4yjCCZzCOfhwBVW4gxrUgcEYnuEV3pzMeXHenY/FaMHJd47hD5zPH0CTlAs=
x⇤ AAAB6nicbVBNS8NAEJ34WetX1aOXxSKIh5KIoMeiF48V7Qe0sWy2m3bpZhN2J2IJ/QlePCji1V/kzX/jts1BWx8MPN6bYWZekEhh0HW/naXlldW19cJGcXNre2e3tLffMHGqGa+zWMa6FVDDpVC8jgIlbyWa0yiQvBkMryd+85FrI2J1j6OE+xHtKxEKRtFKd08Pp91S2a24U5BF4uWkDDlq3dJXpxezNOIKmaTGtD03QT+jGgWTfFzspIYnlA1pn7ctVTTixs+mp47JsVV6JIy1LYVkqv6eyGhkzCgKbGdEcWDmvYn4n9dOMbz0M6GSFLlis0VhKgnGZPI36QnNGcqRJZRpYW8lbEA1ZWjTKdoQvPmXF0njrOK5Fe/2vFy9yuMowCEcwQl4cAFVuIEa1IFBH57hFd4c6bw4787HrHXJyWcO4A+czx//gI2Y
↵ x⇤ AAACBnicbVDLSsNAFJ34rPUVdSnCYBFEsCQi6LLoxmUF+4A2lsl00g6dTMLMjbSErNz4K25cKOLWb3Dn3zhpu9DWAxcO59w7c+/xY8E1OM63tbC4tLyyWlgrrm9sbm3bO7t1HSWKshqNRKSaPtFMcMlqwEGwZqwYCX3BGv7gOvcbD0xpHsk7GMXMC0lP8oBTAkbq2AfD+/QkO20DG0JKABShuYHNm1xmHbvklJ0x8Dxxp6SEpqh27K92N6JJyCRQQbRuuU4MXkoUcCpYVmwnmsWEDkiPtQyVJGTaS8dnZPjIKF0cRMqUBDxWf0+kJNR6FPqmMyTQ17NeLv7ntRIILr2UyzgBJunkoyARGCKcZ4K7XDEKYmQIoYqbXTHtkzwKk1zRhODOnjxP6mdl1ym7t+elytU0jgLaR4foGLnoAlXQDaqiGqLoET2jV/RmPVkv1rv1MWldsKYze+gPrM8f/LOZcQ==
attraction basin
v
n x00 AAACEXicbVDLTgIxFO3gC/GFunTTSEzYSGaMiS6JblxiIo8EkHTKBRo6nUl7x0Am/IIbf8WNC41x686df2MHWCh4kjYn59x723v8SAqDrvvtZFZW19Y3spu5re2d3b38/kHNhLHmUOWhDHXDZwakUFBFgRIakQYW+BLq/vA69esPoI0I1R2OI2gHrK9ET3CGVurki6P7pBVpEcDsnpy2EEaYMETNeFpD7XihJp18wS25U9Bl4s1JgcxR6eS/Wt2QxwEo5JIZ0/TcCNsJ0yi4hEmuFRuIGB+yPjQtVSwA006mG03oiVW6tBdqexTSqfq7I2GBMePAt5UBw4FZ9FLxP68ZY++ynQgVxQiKzx7qxZJiSNN4aFdo4CjHljCuhf0r5QOWRmFDzNkQvMWVl0ntrOS5Je/2vFC+mseRJUfkmBSJRy5ImdyQCqkSTh7JM3klb86T8+K8Ox+z0owz7zkkf+B8/gB3e56n
attraction basin
FIG 1 Attract on andscape A schemat c ayout to dep ct the andscape o a gener c react on-d ffus on system defined on a symmetr c network (a) the bas n o attract on assoc ated w th the homogeneous equ br um x∗ ( ght b ue) s d sp ayed the atter extends cons derab y to eventua y entw ne a arge ract on o orb ts (as e g A1 ) On y tra ector es wh ch are d stant enough rom the homogeneous fixed po nt (as e g B1 ) can evo ve towards a d fferent poss b y non homogeneous equ br um x (turquo se) Once the dynam cs s made to flow on a non-norma support (pane b) the effect ve bas n o attract on o the homogeneous fixed po nt shr nks cons derab y Th s s the d rect s gnature o the short t me amp ficat on o the mposed perturbat on as st mu ated by the non-norma character o the under y ng support The amp ficat on makes t poss b e or the system to overcome the barr er as d sp ayed n (c) and eventua y resu ts n the dynam ca andscape that s p ctor a y exemp fied n (b)
II
REACTION-DIFFUSION MODELS ON NETWORKS
We cons der the coup ed evo ut on of two spec es wh ch are bound to d ffuse on a d rected network We ntroduce the ndex i = 1 N to dent fy the nodes of the co ect on and denote by u and v the concentrat on of the spec es on the i-th node Loca react ve dynam cs s assumed to be governed by the non- near funct ons f (u v ) and g(u v ) The under y ng network s character sed by a b nary adjacency matr x A A j s equa
3
FIG. 2. Non-normal dynamics. Time evolution for the norm of x, solution of the stable linear system x˙ = Ax for a normal (blue) and non-normal (red) system. In both cases the system is stable, meaning that the spectral abscissa is negative α(A) ≡ sup 0 where H = (A + A∗ ) /2 is the Hermitian part of A. The norm of the solution is lower bounded by the Kreiss constant K(A) ≤ supt≥0 k x(t) k / k x(0) k [15].
to unity if there is a link that goes from node j to node i, and zero otherwise. The species relocate across the network, following available edges and subject to standard Fickean diffusion. For example, relative to species u, the PN net flux at node i is given by Du j=1 Aij (uj −ui ) where the sum is restricted to the subset of nodes j for which Aij 6= 0 and Du is the diffusion coefficient for species u. Collecting this information together, the system under examination obeys the following set of 2N ordinary differential equations: P u˙ i = f (ui , vi ) + Du N j=1 Lij uj (1) P N v˙ = g(u , v ) + D L v , i i i v ij j j=1
d , Lij = Aij − δij kiin are the dt P elements of the Laplacian matrix L and kiin = j Aij stands for the incoming degree of node i, i.e. the number of connections pointing towards i. It is worth recalling that standard reaction-diffusion systems on continuous domains are customarily described by a closed set of partial differential equations (PDEs), for concentrations. When discretising the PDE over a finite spatial mesh, the problem can be equivalently cast in the form (1), for a specific choice of the operator L and by properly rescaling the coupling constants, so as to account for the selected mesh size, e.g. the 2D lattice case. As a prerequisite for the forthcoming analysis, we shall assume the existence of a homogeneous equilibrium. This is labelled (u∗ , v ∗ ), and satisfies the condition f (u∗ , v ∗ ) = g(u∗ , v ∗ ) = 0. The solution (ui , vi ) = (u∗ , v ∗ ) where the “dot” denotes
for all i is further assumed to be stable under homogeneous perturbations. As first intuited by Turing, the aforementioned equilibrium can become unstable upon injection of a small heterogeneous perturbation, which activates the diffusive couplings. These latter are otherwise silenced, as long as the solution stays homogeneous. Under specific conditions, non-homogeneous disturbances amplify: the system is consequently driven towards different asymptotic attractors, termed in the literature as Turing patterns. To isolate the conditions that make the instability possible, one proceeds with a conventional linear stability analysis. The key idea is to introduce a small perturbation of the homogeneous equilibrium, x = (u1 , . . . , uN , v1 , . . . , vN )T − (u∗ , v ∗ )T and insert it in the governing Eq. (1). By expanding at the first oder in the perturbation, we obtain the following linear system: d x = (J0 + L) x , dt
(2)
where the Jacobian matrix J0 is � � fu 1N fv 1N J0 = = J0 ⊗ 1 N , (3) gu 1N gv 1N � � fu fv the 2 × 2 Jacobian of the reaction part for J0 = gu gv evaluated at the fixed point (u∗ , v ∗ ). The generalised Laplacian operator L is given by � � � � Du L 0N Du 0 L= = ⊗ L, (4) 0N Dv L 0 Dv The eigenvalues λ of the 2N × 2N matrix J0 + L, define the fate of the perturbation. If there exists (at least) one eigenvalue with a positive real part, then the perturbation initially grows exponentially, and the homogeneous fixed point is predicted unstable, as follows the conventional Turing mechanism. An elegant procedure to compute the spectrum of J0 + L, involves the eigenvectors of the Laplacian operator L. Assume the latter to be diagonalisable, introduce its eigenvalues Λ(α) and P (α) (α) associated eigenvectors φ(α) , as j Lij φj = Λ(α) φi , with α = 1, ..., N . Then we can expand the perturbation on the basis of the Laplacian operator and project the 2N ×2N Eqs. (2), onto a collection of N independent 2×2 problems, each referred to a given subspace, as spanned by the corresponding eigenvector. When the underlying network is symmetric, the Laplacian eigenvalues Λ(α) are real and non-positive. Moreover, the eigenvectors form an orthonormal basis of the embedding manifold. The short time evolution of the imposed perturbation is exponential and the associated growth (or damping) factors λ can be readily computed as a function of the eigenvalues entries Λ(α) , by solving the following characteristic problem: � � f + Du Λ(α) − λ fv det u =0 (5) gu gv + Dv Λ(α) − λ
4 The eigenvalue with the largest real part, λ = maxα 0, then the non-normal matrix is termed reactive, and perturbations may display an initial, transient growth. The degree of non-normal amplification can be quantified through diverse indicators [15]. In our setting, the reaction diffusion system is amenable to its linear homologue (2), when operating in the vicinity of a stationary stable homogeneous attractor. Asymmetry, a key ingredient for non-normality, can be hence accommodated in the matrix that encodes for paired couplings, so triggering a short time amplification of the imposed perturbation that will prove instrumental for a generalised class of diffusion-driven instabilities.
III.
NON-NORMAL PATTERNS FOR STABLE SYSTEMS
Without loss of generality, we shall assume in the following the Brusselator model [22–24], as a reference reaction scheme. The Brusselator is a paradigm of non-linear dynamics, and it is often employed in the literature as a reference model for self-organisation, synchronisation and pattern formation. Our choice amounts to setting f (x, y) = 1−(b+1)x+cx2 y and g(x, y) = bx−cx2 y where b and c denote positive parameters. The system admits a trivial homogeneous fixed point for (ui , vi ) = (1, b/c), ∀i, that is stable provided c > b − 1. We can easily determine the conditions for a Turing instability. Assuming as a starting point a symmetric spatial support, we conclude that the diffusion coefficients need to comply with the necessary condition Du < Dv , for patterns to emerge. A straightforward calculation enables us to conclude that √ c < Dv /Du (b + 1 − 2 b), as an additional constraint on the parameters, for the Turing instability. The above conditions allow us to isolate the domain in the parameter space (b, c) where Turing patterns are predicted to occur. The region of interest is displayed in Fig. 3, with a green shading, and it is delimited by the curves c = b−1 √ (dashed line) and c = Dv /Du (b + 1 − 2 b) (solid line) (region (iii)). Consider now the Brusselator model defined on a directed, non-normal network. In the following we choose to operate with the class of non-normal networks introduced in [16]. The recipe for the network generation goes as follows. Start with a weighted directed 1D ring, and assume the weights to be randomly drawn from a
5
70 60
Patterns of Non-normality
ii
Topology driven patterns
i
50
Turing region
⇣ b+
1
40
20
D
c=
u
D
v
30
10
iii
2 p ⌘ b
80
c=
b
1
sha1_base64="O3cy6xOf4cAgEE3KC4ogYfY6xoM=">AAAB7HicbVBNS8NAEJ3Ur1q/qh69LBbBiyURQS9C0YvHCsYW2lA220m7dLMJuxuhhP4GLx4U8eoP8ua/cdvmoK0PBh7vzTAzL0wF18Z1v53Syura+kZ5s7K1vbO7V90/eNRJphj6LBGJaodUo+ASfcONwHaqkMahwFY4up36rSdUmifywYxTDGI6kDzijBor+ew6PPN61Zpbd2cgy8QrSA0KNHvVr24/YVmM0jBBte54bmqCnCrDmcBJpZtpTCkb0QF2LJU0Rh3ks2Mn5MQqfRIlypY0ZKb+nshprPU4Dm1nTM1QL3pT8T+vk5noKsi5TDODks0XRZkgJiHTz0mfK2RGjC2hTHF7K2FDqigzNp+KDcFbfHmZPJ7XPbfu3V/UGjdFHGU4gmM4BQ8uoQF30AQfGHB4hld4c6Tz4rw7H/PWklPMHMIfOJ8/3MeODA==
sha1_base64="hP+6LrUf2d3tZaldqaQQvEKMXyw=">AAAB2XicbZDNSgMxFIXv1L86Vq1rN8EiuCozbnQpuHFZwbZCO5RM5k4bmskMyR2hDH0BF25EfC93vo3pz0JbDwQ+zknIvSculLQUBN9ebWd3b/+gfugfNfzjk9Nmo2fz0gjsilzl5jnmFpXU2CVJCp8LgzyLFfbj6f0i77+gsTLXTzQrMMr4WMtUCk7O6oyaraAdLMW2IVxDC9YaNb+GSS7KDDUJxa0dhEFBUcUNSaFw7g9LiwUXUz7GgUPNM7RRtRxzzi6dk7A0N+5oYkv394uKZ9bOstjdzDhN7Ga2MP/LBiWlt1EldVESarH6KC0Vo5wtdmaJNChIzRxwYaSblYkJN1yQa8Z3HYSbG29D77odBu3wMYA6nMMFXEEIN3AHD9CBLghI4BXevYn35n2suqp569LO4I+8zx84xIo4 sha1_base64="+awu1F0MjbatGFMO0saHCi6dabU=">AAACCXicbZDLSgMxGIX/qbdaq45u3QwWoVIsM93oRhB04bKCbYXOUDJppg3NXEz+KZRhHsKNr+LGhSK+gDvfxvSy0NYDCYdzEpL/8xPBFdr2t1FYW9/Y3Cpul3bKu3v75kG5reJUUtaisYjlg08UEzxiLeQo2EMiGQl9wTr+6Hrad8ZMKh5H9zhJmBeSQcQDTgnqqGfW6KUbSEKzm94411uau4IFWPVrzlnDVY8SMz93JR8M8bRnVuy6PZO1apyFqcBCzZ755fZjmoYsQiqIUl3HTtDLiEROBctLbqpYQuiIDFhX24iETHnZbKjcOtFJ3wpiqVeE1iz9fSMjoVKT0NcnQ4JDtdxNw/+6borBhZfxKEmRRXT+UJAKC2NrSsjqc8koiok2hEqu/2rRIdGMUHMsaQjO8sirpt2oO3bdubOhCEdwDFVw4Byu4Baa0AIKT/ACb/BuPBuvxsccV8FYcDuEPzI+fwDEqJ0C sha1_base64="DUfeXb0c+E5YOzjGJSvi/BtBpAg=">AAACFHicbVDLSsNAFJ3UV62vqEs3wSJUiiXpRjdCURcuK9gHNCFMppN26OThzE2hhHyEG3/FjQtF3Lpw5984bbPQ1gP3cjjnXmbu8WLOJJjmt1ZYWV1b3yhulra2d3b39P2DtowSQWiLRDwSXQ9LyllIW8CA024sKA48Tjve6Hrqd8ZUSBaF9zCJqRPgQch8RjAoydWr5NL2BSbpjTvOVEsym1MfKl7VOqvb8kFA6mW2YIMhnLp62ayZMxjLxMpJGeVouvqX3Y9IEtAQCMdS9iwzBifFAhjhNCvZiaQxJiM8oD1FQxxQ6aSzozLjRCl9w4+EqhCMmfp7I8WBlJPAU5MBhqFc9Kbif14vAf/CSVkYJ0BDMn/IT7gBkTFNyOgzQQnwiSKYCKb+apAhVhmByrGkQrAWT14m7XrNMmvWnVluXOVxFNEROkYVZKFz1EC3qIlaiKBH9Ixe0Zv2pL1o79rHfLSg5TuH6A+0zx+Q7J59 sha1_base64="dh/AKscMvmKQrF/rPSBY/fRy8Yg=">AAACFHicbVDLSsNAFJ34rPUVdekmWIRKsSRF0I1Q1IXLCvYBTQiT6aQdOnk4c1MoIR/hxl9x40IRty7c+TdO2yy09cC9HM65l5l7vJgzCab5rS0tr6yurRc2iptb2zu7+t5+S0aJILRJIh6Jjocl5SykTWDAaScWFAcep21veD3x2yMqJIvCexjH1AlwP2Q+IxiU5OoVcmn7ApP0xh1lqiWZzakPZa9indZs+SAg9TJbsP4ATly9ZFbNKYxFYuWkhHI0XP3L7kUkCWgIhGMpu5YZg5NiAYxwmhXtRNIYkyHu066iIQ6odNLpUZlxrJSe4UdCVQjGVP29keJAynHgqckAw0DOexPxP6+bgH/hpCyME6AhmT3kJ9yAyJgkZPSYoAT4WBFMBFN/NcgAq4xA5VhUIVjzJy+SVq1qmVXr7qxUv8rjKKBDdITKyELnqI5uUQM1EUGP6Bm9ojftSXvR3rWP2eiSlu8coD/QPn8AkiyegQ==
δcrit = 0.005 suffices for the dawning of the patterns. For any b we define δcrit to be the smallest value of the initial perturbation for which patterns emerge. In the right panel of Fig. 6, the value of δcrit is represented against b: the basin of attraction of the homogeneous state shrinks considerably, when the system is defined on a non-normal support, an observation which contributes to explain the augmented propensity of non-normal systems for pattern formation. The shrinking of the basin of attraction of the homogeneous fixed point follows the transient growth of the perturbation, as driven by non-normality. In the left panel of Fig 7 the evolution of the norm of the pertur-
7 6
2
0.3
1
1
0 0
0
50
100
150
8
-1
-1
0
-2
-4
0
0
100
-1
150
0
0
50
5
100
10
-4
150
15
20
25
30
-5
0
0
50
100
150
4
-2 2
0
50
5
100
10
-2.5
150
15
20
25
-3
30
0
0
0
50
5
100
150
10
15
20
25
2.5
2.5
2.5
2
2
2
1.5
symmetric network
1.5
symmetric network
1.5
symmetric network
1
1
1
0.5
0.5
0.5
0
0
0
2.5
2.5
2
2
2.5
2
1.5
1.5
non-normal network
1.5
non-normal network
non-normal network 1
1
1
0.5
0.5
0.5
0
0
0
2.5
2.5
2.5
2
2
2
1.5
1.5
1.5
1
1
1
0.5
non-normal network
0
6
-1.5
2
2
-3
50
4
-3
4
0.1
0
6
6
-2
0.2
-0.5
0.1
2
0
0.3
0
0.2
4
0
0.5
non-normal network
0
0.5
non-normal network
0
FIG. 4. The dispersion relation and the ensuing patterns in different regions of the parameter plane. Turing patterns (b, c) = (26, 61.1) (left column), topology-driven patterns (b, c) = (24, 61.1) (middle column), patterns of non-normality (b, c) = (22.5, 61.1) (right column, enclosed in the red box). The position of the selected working points is marked in Fig. 3, with, respectively, a triangle, a square and a circle. In all cases, the dispersion relation is drawn for the non-normal (directed) network (red dots) and the symmetrised network (green dots). Recall that the instability is set once the dispersion relation is positive. The insets in the panels that form the first row, show the time evolution of the norm of the system for the non-normal network (red curves) and the symmetric settings (green curves). Here, the system is initialised δ-close to the equilibrium (see caption of Fig. 3), with δ = 0.2. The remaining parameters, as well as the network employed, are those used in Fig. 3. The ensuing patterns are displayed for, respectively, the symmetric setting (second row), and the non-normal network. In particular, in the third row, the patterns are depicted when representing the network with a stylized lattice layout (as for the symmetric setting). In the fourth row, the edges of the networks are instead shown. Nodes displaying a low concentration are assigned to the central portion of the cluster.
bation is tracked under the linear approximation, which follows Eq. (2). The norm grows at short times, and then converges to zero, as it should since the homoge-
neous fixed point proves linearly stable. The evolution of the perturbation as obtained for the full non-linear model is instead quite different, as can be visually appre-
8
(A)
(B) A
Symmetric network
B
Symmetric network 2
0.8
1013
0.7
1.5
0.6 0.5
1
0.4 0.3
0.5
0.2 0.1 0
10-10
10-5
100
Non-normal network
Patterns of non-normality
Patterns of directionality
Turing region
0
10-10
10-5
100
Non-normal network 1.2
0.4 0.35
1
0.3
0.8
0.25
0.6
0.2 0.15
0.4
0.1
0.2
0.05 0 10-15
10-10
10-5
100
0
105
2
3
4
5
6
FIG. 5. On the amplitude of the ensuing patterns. Main panel (centre): the average pattern amplitude hAi is plotted as a function of the parameter b, for c = 61.1. Red circles refer to the system evolved on a non-normal network, while green squares stand for its symmetrised analogue. The grey region corresponds to parameters giving rise to Turing instability and the blue one to instability driven by the network directionality. Finally, the domain coloured in pink highlights the region where the homogeneous fixed point is stable according to a linear stability analysis, but where patterns can emerge due to non-normality. The insets show histograms of pattern amplitudes, for two specific values of b, namely b ∼ 20.5 (A), b ∼ 22.5 (B). Red symbols refer to data collected when the Brusselator model is evolves on a non-normal support. Green histograms are computed from simulations that assume symmetric support. The remaining parameters have been set to Du = 0.5, Dv = 1.925, δ = 0.2. Simulations have been performed using the same networks as in Fig. 3.
ciated. Non-linearities eventually stabilise the norm to a non-zero value which was made accessible to the system under the transient evolution. In the right panel of Fig. 7, ∆(δ) := maxt ||x(t)|| − ||x(0)|| is represented as a function of the perturbation size δ, for respectively, nonnormal network (red symbols) and symmetric one (green symbols). The two curves run parallel to each other in log-log scale and the relative shift is rationalised as follows: Consider, for example, the right panel of Fig. 6, where δcrit is plotted against b and focus in particular on b = 22. For the case of a non-normal network, we readily obtain (δcrit )nn ' 0.05, while (δcrit )sym ' 0.6. On the other hand, the value of ∆(0.05) (i.e. a direct measure of the transient growth induced by non-normality for δ ' 0.05, under the linear approximation) is about 0.4 (see right panel of Fig. 7, drawn for b = 22), i.e. of the correct oder of magnitude to explain the observed discrepancy between (δcrit )sym and (δcrit )nn . As recalled in the Introduction, Turing patterns requires the inhibitor to diffuse faster than the activator. Moreover, the ratio of the diffusivities Dv /Du should be sufficiently large for the pattern to materialise in a extended region of parameters. For the Brusselator, sending Dv /Du → 1 contextually implies setting b and c very large for the patterns to set in, via a conventional Turing instability. Network asymmetry, and the associated nonnormality, enable us to extend the region where patterns are reported to occur to smaller ratios of Dv /Du → 1, without forcing the reactive parameters to unphysical
large values. As an example see Fig. 8 where we show the pattern amplitude for Dv = 0.75 and Du = 0.5, resulting in Dv /Du = 1.5, for values of the parameters b and c of the same order of the ones used in Fig. 5. Patterns of non-normality do exist for a large range of values of the b parameter (observe also that in this setting Turing patterns cannot develop on a symmetric support). The patterns are of amplitude with a magnitude up to b ∼ 21. Below this value the magnitude reduces, as depicted in Fig. 8. This is a spurious effect due to the fact that, for b ∈ [20, 21], there is a coexistence of two distinct solutions, one corresponding to the macroscopic pattern and the other to the persisting homogeneous state (see also Fig. 5).
IV.
PSEUDO-DISPERSION RELATION
In the above discussion we have shown that patterns can emerge due to the non-normality of the underlying network, when the dispersion relation would deem the homogeneous fixed point stable. Our conclusions rely on a direct numerical integration of the governing equations and we lack a predictive tool that could eventually be employed to anticipate the phenomenon. In the following we shall propose an extended definition of the dispersion relation that builds on the concept of the pseudospectrum [15]. We begin by recalling the definition of the
9 1 0
10
0.8 0.6
-5
10
0.4 -10
10
0.2 -4
10
10
-2
10
0
0 20
21
22
23
24
25
FIG. 6. On the stability domain. Left panel: average pattern amplitude as a function of the size of the initial perturbation δ, for b = 22.56. The average is computed over 500 independent realisations of the dynamics. Right panel: the size of the stability domain δcrit is computed for, respectively, the Brusselator defined on the non-normal network (red points) and on its symmetric analogue (green points), and plotted as a function of b. The remaining parameters are set to c = 61.1, Du = 0.5, Dv = 1.925. For the analysis we employed the networks used in Fig. 3. 102
2.5 2
100
non-linear system
1.5
10-2 1
10-4
0.5 linearised system 0
0
20
40
60
80
10-6 -3 10
100
10-2
10-1
100
FIG. 7. Transient amplification and linearised dynamics. Left panel: we show the time evolution of the norm of the perturbation for the linearised dynamics (dotted line) and for the full non-linear model (solid line). For the linear system, we can see the transient growth and the subsequent decrease towards the asymptotic equilibrium. The non-linear system stabilises eventually to a value of the norm which is different from zero. Here, δ = 0.2. Right panel: ∆(δ) := maxt ||~ x(t)|| − ||~ x(0)|| as a function of the perturbation size δ, for non-normal (red dots) and symmetric networks (green dots). The parameters are set to b = 22, c = 61.1, Du = 0.5, Dv = 1.925. The networks employed are those used in Fig. 3.
pseudospectrum σ� (M) of, a matrix M, namely: σ� (M) = σ(M + E), ∀ ||E|| < � ,
(8)
where σ(M) denotes the spectrum of the matrix M and � is a scalar positive defined quantity. The pseudospectrum is an important and relatively recent mathematical tool which has been successfully applied to different disciplinary contexts where non-normality occurs [15]. The Kreiss constant, a lower bound for the linear growth of an imposed perturbation, can be computed from the pseudospectrum. While the behaviour of a linear (non-normal) system is relatively well understood in the framework of pseudospectrum theory, extending this to non-linear models is challenging. Consider a generic non-linear system,
x˙ = f(x), where f : Rn → Rn is a vector-valued non-linear function. The problem of local stability is tackled by performing a Taylor expansion about a given fixed point x∗ , f(x∗ ) = 0. The evolution of the perturbation � near the equilibrium x∗ is then given by: � � 1 �˙ = Df(x∗ ) + �T D2 f(x∗ ) � + . . . , (9) 2! where Df(x∗ ) and D2 f(x∗ ) are, respectively, the Jacobian matrix and the Hessian tensor [? ] of the non-linear function f, both evaluated at the fixed point. Keeping only the first term on the right hand side corresponds to performing a linear analysis, i.e. computing the spectrum of Df(x∗ ), and straightforwardly yields the definition of
10
Patterns of non-normality
Patterns of directionality
FIG. 8. Patterns of non-normality for Dv /Du ∼ 1. We report the average pattern amplitude hAi as a function of the parameter b, for c = 23.72 and Dv /Du = 1.5, for the Brusselator model evolving on the non-normal network used in Fig. 3. Values of b lying in the blue region yield instability driven patterns due to the network directionality. The region coloured in pink highlights the interval in b where the homogeneous fixed point is linearly stable and patterns can emerge due to non-normality. Each point is the average over 100 independent replicas. The remaining model parameters are the same as those used in Fig. 3.
Let us denote by η the norm of P and observe that if �0 → 0 then η → 0. Let us denote by µη one eigenvalue of J + P, once ||P|| = η. Notice that, in doing this, we are abusing notation because P - and thus its norm - depends on �0 , so different initial perturbations can produce different P, but all with the same norm. We can, however, account for this fact by averaging µη over several initial conditions that share the condition ||P|| = η. For η = 0, we have that µ0 is an eigenvalue of J and thus we can find an eigenvalue Λ(α) of the Laplacian matrix such that µ0 = µ0 (Λ(α) ). Then varying continuously s ∈ (0, η) we can follow, with continuity, µs (Λ(α) ). In Fig. 9 (left panel) we show