Nov 24, 2008 - IEEE TRANSACTIONS ON RELIABILITY, VOL. 53, NO. ... certain scenarios in the biological sciences involving a compe- tition for resources.
IEEE TRANSACTIONS ON RELIABILITY, VOL. 53, NO. 3, SEPTEMBER 2004
401
Specifying Interdependence in Networked Systems Nozer D. Singpurwalla and Chung-Wai Kong
Abstract—Realistic assessments of the reliability of networked systems, series and parallel systems being special cases, require that we account for interdependence between the component lifelengths. The key to doing this is the specification and use of a suitable probability model in two or more dimensions. Consequently, several multivariate probabilistic models have been proposed in the literature. Many of these models have marginal distributions that are exponential; the ones by Gumbel, and by Marshall and Olkin being some of the earliest and the best known. The purpose of this paper is two fold: The first purpose is to articulate the nature of dependence encapsulated by such models, using a perspective which is best appreciated by a user. Specifically, we anchor on the bivariate case, and focus attention on the conditional mean as a measure of dependence. The second purpose, motivated by the first, is to introduce a new family of multivariate distributions with exponential marginals, whose conditional mean fills a void in the general forms of the conditional means of the available models. The method of “copulas” is used to generate this new family of distributions. Attention is focused on the case of exponential marginals, because the notion of “hazard potentials” enables us to use multivariate distributions with exponential marginals as a seed for generating multivariate distributions with marginals other than the exponential. Index Terms—Bivariate exponential distributions, conditional expectaion, copulas, hazard potentials, interaction, regression function, reliability.
I. INTERDEPENDENT LIFE-TIMES
C
ONSIDER a two component system with component having life-time , , 2. When these components operate in a common environment as a system, or when they share similarities due to commonalities in design and/or manufacturing, & cannot be judged independent. Rather & are said to experience interaction or inter-dependence. Such inter-dependence is (probabilistically) encapsulated by a bivariate probability distribution having the property that for any , ; is the marginal distribution of , , 2. When , the life-times are said to be positively (negatively) dependent. With positive dependence, an assessor of these probabilities holds the view that a knowledge of the failure of one component exacerbates the assessment of failure of the surviving component. It is often the case that life-times of physical units are judged positively dependent. Negative dependence is rare, save for some certain scenarios in the biological sciences involving a competition for resources. Manuscript received October 23, 2002; revised June 30, 2003. This work was supported by Grants DAAD19-02-1-0195 and DAAD19-01-1-0502 from the U.S. Army Research Office. Associate Editor: W. Kuo. The authors are with the Institute for Reliability and Risk Analysis, Department of Statistics, The George Washington University, Washington, D.C. 20052, USA. Digital Object Identifier 10.1109/TR.2004.833423
The mere judgment that life-times are positively or negatively dependent is purely a qualitative one. At best, its only use is an ability to determine if a system reliability calculation, assuming independent life-times, provides an upper or a lower bound. To obtain sharp assessments of system reliability, we need to specify the degree, or the extent, to which the life-times are dependent. For this, several measures such as (Pearson’s) linear correlation, Kendall’s Tau, and Spearman’s Rho have been proposed. However, from the point of view of a user, say an engineer, these measures are not as intuitively appealing as another measure of interdependence, namely, the conditional mean, also known as the regression function. For example, Pearson’s linear and correlation only encapsulates the degree to which bear a linear relationship to each other. In principle, and could be highly dependent (though not linearly), and yet their could be close to zero; the bivariate exponential distribution of [6] is a case in point. Furthermore, a knowledge of provides little guidance as to what family of bivaraite distributions is a meaningful one to choose. By contrast, as will be shown here, the conditional mean is able to provide a nice discriminatory capability for model selection. This, plus the fact that the conditional mean value function can be elicited in lay terms, makes it a viable candidate for specifying the nature of interdependence in multi-component systems. In the interest of simplicity, we have restricted attention to the bivariate case by focusing on a two-component system. Whereas this by itself is of limited practical value it helps us lay the groundwork for addressing the case of specifying interdependencies in multi-component systems. II. THE REGRESSION FUNCTION The regression function of on , denoted , were is a function of , giving us the expected value of . This function is easy to elicit because all one need do is provide ones best assessment of , the time to failure of the component labeled 2, were , the time to failure of the compo. The elicited is a way nent labeled 1, is to encapsulate an expert’s view of the relationship between and in a form easy to articulate. The expert is free to specify , be it linear, polynomial, the general shape of or exponential, each shape corresponding to a suitable bivariate distribution. Possible shapes of the regression function for some well known bivariate distributions with exponential marginals are described below. A. Gumbel’s (Type I) Bivariate Exponential Distribution Gumbel [3] proposed a bivariate distribution with exponential marginals whose general form is
0018-9529/04$20.00 © 2004 IEEE
Authorized licensed use limited to: IEEE Xplore. Downloaded on November 24, 2008 at 10:57 from IEEE Xplore. Restrictions apply.
(1)
402
IEEE TRANSACTIONS ON RELIABILITY, VOL. 53, NO. 3, SEPTEMBER 2004
Fig. 2. Regression function for Gumbel’s type II bivariate exponential for different values of �. Fig. 1. Regression function of Gumbel’s type I bivariate exponential with � = 0:2.
for some ; is a parameter whose value describes the and . For this model, the nature of dependency between on is of the form regression of (2) This function of is polynomially decreasing, taking the value , and converging to 0 as ; see Fig. 1. The 2 at model encapsulates negative dependence, and consequently is of a limited interest in reliability. The parameter controls the rate at which the regression function decays to zero. B. Gumbel’s (Type II) Bivariate Exponential Distribution To incorporate both positive and negative dependence, and as a boundary case independence, Gumbel [3] has also proposed another bivariate distribution with exponential marginals. Here, , and , for some dependency parameter
(3) For this model, the regression function is (4) which for is an increasing (decreasing) function of , ; see Fig. 2. Consequently, and is a constant for encapsulates positive dependence, and encapsulates neg. Furative dependence; we have independence when , the regression function is thermore, because bounded between 1/2 & 3/2; when it increases or decreases, it does so exponentially. C. Marshall and Olkin’s Multivariate Exponential Distribution Marshall and Olkin [6] introduced a multivariate distribution with exponential marginals for describing positive dependence between the life-times of a multi-component system. In the bivariate case, their model takes the form
(5)
Fig. 3.
Regression function of Marshall and Olkin’s bivariate exponential for
� = 0 and � = 0:5.
where , , and are the parameters of the model, being the dependency parameter. With and , the regression function takes the form
for
(6)
The regression function increases linearly in when , ; see Fig. 3. For , and exponentially in when is bounded between and , allowing it to take a wider range of values than those taken by the regression function of Gumbel’s Type II bivariate exponential distribution . with D. Singpurwalla and Youngren’s Bivariate Distribution Whereas Gumbel’s bivariate exponential distributions have no physical motivation, Marshall and Olkin’s distribution does, in the sense that it is derived from Poisson shock generating processes. This is also true of a distribution introduced by Singpurwalla and Youngren [9]. This distribution is derived via a shock generating mechanism governed by a shot-noise process; it has the form of (7) (at the bottom of the next page) for some depen. dency parameter For this model, the regression function cannot be expressed in closed form. Fig. 4 illustrates the general form of the regression function, numerically evaluated . It is initially convex, and asymptotes as a linear for function of . The initial convexity signals the fact that small values of provide little insight about the behavior of ; for parallels that of . large values of , the behavior of
Authorized licensed use limited to: IEEE Xplore. Downloaded on November 24, 2008 at 10:57 from IEEE Xplore. Restrictions apply.
SINGPURWALLA AND KONG: SPECIFYING INTERDEPENDENCE IN NETWORKED SYSTEMS
403
constant, or concave increasing to a constant asymptote. The asymptotic nature of these regression functions suggests that, in the opinion of an assessor, the time to failure of the surviving component is independent of the time to failure of the failed is large. What therefore seems to be component, when missing is a bivariate distribution with exponential marginals whose regression function is convex and increasing. Once such a distribution is identified, we would have a catalogue of bivariate distributions whose regression functions cover a spectrum of possible shapes which a user is able to employ. The purpose of the Section II-F is to propose one such family of bivariate distributions with exponential(1) marginals; i.e., exponential distributions with scale parameter one. F. The Hazard Potential of Items Fig. 4. Regression function of Singpurwalla and Youngren’s bivariate = 1. exponential, with
m
A linear regression function is also characteristic of a bivariate exponential distribution proposed by Downton [4]. Here, , where is a dependency parameter. There are several other bivariate distributions with exponential marginals which have been proposed in the literature; a comprehensive review exists in [4]. For the purposes of this paper, we have confined attention to the four illustrations given above. E. Discussion: The Elicitation of Regression Functions Independence and dependence are judgments made by a single assessor or a group of assessors acting as one. Thus the nature of dependence has to be elicited, and the regression function is a vehicle for doing so. The regression function is attractive because it profiles an assessor’s view (via the mean) about the time to failure of a surviving component, given the several possible times to failure of the failed component. A constant regression function signals the lack of dependence, because it states that no matter what the time to failure of a failed component is, the time to failure of the surviving component is assessed at a constant. Similarly, an increasing (decreasing) regression function signals positive (negative) dependence in the sense that large values of the times to failure of the failed component signal large (small) times to failure of the surviving component. Corresponding to every bivariate distribution, there exists a regression function, and vice versa, though not necessarily unique. Consequently, we would like to portray as many functional forms of the regression function as is possible. ) encapsulate Gumbel’s Type I & Type II (with different forms of negative dependence, whereas Gumbel’s ), Marshall & Olkin’s bivariate Type II (with exponential, and Singpurwalla & Youngren’s bivariate distributions encapsulate different forms of positive dependence. However, not all forms of positive dependence are covered by the above candidates. Specifically, the (nondecreasing) regression functions corresponding to these distributions are either
Before proceeding to the material of Section III, it is appropriate to comment on the fact that the bivariate distributions catalogued here have their parameters chosen so that the marginal distributions are exponential(1). This is because dependent life-times are the manifestation of what are known as dependent “hazard potentials”, and it can be argued that the hazard potential of any component has an exponential(1) distribution; see [8]. The hazard potential of an item is interpreted as an unknown amount of resource possessed by the item upon its inception; the item fails when this resource gets exhausted. Using this argument, we can generate multivariate failure models having marginal distributions which are not exponential, using a multivariate distribution with exponential(1) marginals as a seed. The details are in [8]. III. MULTIVARIATE EXPONENTIALS WITH CONVEX AND INCREASING REGRESSIONS In this section, we introduce a new family of multivariate distributions whose marginal distributions are exponential(1), and where regression functions (in the bivariate case) are convex & increasing. The former requirement is per the dictates of hazard potentials, and the latter is to fill a gap in our catalogue of shapes for regression functions. A. The Notion of Copulas There are many approaches for constructing multivariate distributions with specified marginals, one of which is the method of “copulas” [7]. Briefly, copulas are functions which couple univariate distribution functions to form multivariate distribution functions. In the two dimensional case, a copula is a functo with the property that tion which maps is continuous and nondecreasing in each variable, and that & for all in . The concept of copulas was initially used as a means for characterizing and measuring the dependence between two random variables. In particular, it can be seen that Spearman’s Rho and Kendall’s Tau are functions of their copulas alone, so
(7) ,
Authorized licensed use limited to: IEEE Xplore. Downloaded on November 24, 2008 at 10:57 from IEEE Xplore. Restrictions apply.
404
IEEE TRANSACTIONS ON RELIABILITY, VOL. 53, NO. 3, SEPTEMBER 2004
that knowing the latter is equivalent to knowing the former [7]. By contrast, Pearson’s correlation coefficient depends on both the copula, and the marginal distributions. The importance of copulas to this section can be seen from Sklar’s [10] famous theorem. Theorem 1 (Sklar): Let be a two-dimensional distribution function with marginal distribution functions & . Then, there exists a copula such that . & , Conversely, for any univariate distribution functions defined above is a two-diand any copula , the function mensional distribution function with marginals & . Furthermore, if & are continuous, then is unique. Thus, in the bivariate case, Sklar’s theorem plus the fact that implies that a copula is itself a bivariate . distribution function with uniform marginals on Another consequence of Sklar’s theorem is that two random , variables & are independent, if and only if & are positively quadrant dependent (i.e., and for all & ) if and only if , for all , ; similarly with negative quadrant dependence. B. Copula of a Bivariate Pareto and Its Induced Bivariate Exponential The multivariate Pareto distribution, as a model for depen, was proposed by Lindley and dent life-times , Singpurwalla [5]. This model is based on the premise that dependent life-times are a consequence of the action of a common but unknown environment on all components. When the unknown environment is characterized by a gamma distribution & a scale parameter , the with a shape parameter is a multivariate Pareto. In the resulting distribution of the bivariate case, this results in the form (8) with marginal distribution functions (9) Applying Sklar’s theorem to the above yields the copula
(10) Observe that it is only the shape parameter which goes into determining this copula; the role of is immaterial. If we set & , and for invoking Sklar’s theorem in reverse, we prouse duce the following bivariate distribution with exponential(1) marginals:
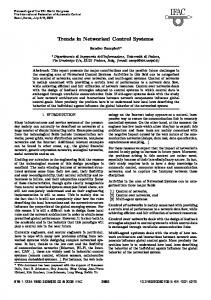
(11) The regression function of the bivariate exponential of (11) does not exist in closed form. A plot of with , evaluated numerically, is shown in
Fig. 5. A convex, increasing regression function generated by the new family of bivariate exponential distributions.
Fig. 5; it is a convex, increasing function of . Furthermore, is linear in , suggesting that a plot of , for , grows exponentially in . C. Invariance Properties of Copula Induced Regressions The approach of Section III-B is general in the sense that we may start with any bivariate distribution with known marginals, and determine its copula. We then use this copula to generate a bivariate distribution with any desired marginals. In our case, we started with a bivariate Pareto as a seed, and using Sklar’s the. We then used this to orem obtained its copula invoke the converse of Sklar’s theorem to induce a multivariate distribution with exponential(1) marginals, which is what we wanted. We shall refer to this process of producing the desired multivariate distributions as “copula induced transformation of a parent distribution”. The question now arises as to whether the conditional mean of the induced distribution retains the general form of the conditional mean of the parent distribution. In our particular case we see that the regression function of the [5]—is a linearly increasing funcbivariate Pareto— tion of , whereas that of the bivariate exponential of (11) is, for , a convex increasing function of . This observation leads us to claim that the conditional mean is not invariant under the copula induced transformations of the parent distribution. Thus, unlike Spearman’s Rho and Kendall’s Tau, but like Pearson’s correlation, the conditional mean, as a measure of dependence, cannot be characterized by a copula alone. IV. SUMMARY AND CONCLUSIONS It is well known [1] that for series systems, the assumption of independence (of life-times) underestimates system reliability when in actuality the assumption of positive dependence is germane; the reverse is true of parallel systems. But to capture the import of interdependence, one needs to specify a multivariate probability distribution for the component life-times. The best way to do this is to develop a probabilistic model which incorporates all aspects of the basic failure mechanisms. This could be a difficult task, because it calls for a deep appreciation of the physics of failure of each component. An alternative is to elicit the informed judgments of experienced individuals who may have views about the relationships between the failure times of
Authorized licensed use limited to: IEEE Xplore. Downloaded on November 24, 2008 at 10:57 from IEEE Xplore. Restrictions apply.
SINGPURWALLA AND KONG: SPECIFYING INTERDEPENDENCE IN NETWORKED SYSTEMS
the various components. It is with the above in mind that the material of this paper has been developed. Specifically, we have advocated a use of the conditional mean as a measure of dependence. Our reason for advocating this choice is a naturalness of interpretation, and an ease of elicitation. Consequently, we have portrayed via Figs. 1–4, the conditional means of several bivariate exponential distributions whose marginal distributions are exponential(1). To complement this catalogue of conditional means, we have introduced, in Section III, a new family of multivariate exponential distributions, and have shown via Fig. 5, the general form of its conditional mean. We focus on multivariate distributions with exponential(1) marginals because such distributions can serve as a seed for generating multivariate life distributions having marginals that are other than the exponential. So how can a practioner such as a network designer use the results of this paper? Our proposal is that the designer elicit a regression function from a panel of experts (the designer could also act as an expert), and to then match this function against the catalogue of regressions given here. The designer then chooses that probability model whose regression best matches the elicited regression. Clearly, this approach can work well when comparing any two component life-times. The problem becomes trickier when one has three or more components to contend with. For example, in the case of three life-times , , and one would have, as a process of pairwise elicitation, , one for three bivariate distributions, one for and one for . How should one combine these bivariate distributions to obtain a trivariate distribution? This question remains to be addressed more carefully, but one possible is strategy is to assume conditional independence, so that if judged independent of given , we would have
405
too is a simplifying assumption, and as such is only one step away from complete independence per se. The matter of how to go beyond conditional independence remains to be addressed, and so is the matter of how to formally elicit regression functions. Gokhale and Press [2] have discussed methods of formally eliciting correlations, but as we have said before, correlations do not quite convey the intuitive import of the conditional mean. REFERENCES [1] R. E. Barlow and F. Proschan, Statistical Theory of Reliability and Life Testing. New York: Holt, Rinehart and Winston, 1975. [2] D. V. Gokhale and S. J. Press, “Assessment of a prior distribution for the correlation coefficient in a bivariate normal distribution,” Journal of the Royal Statistical Association, vol. 145, pp. 237–249, 1982. [3] E. J. Gumbel, “Bivariate exponential distributions,” Journal of the American Statistical Association, vol. 55, pp. 698–707, 1960. [4] S. Kotz, N. Balakrishnan, and N. L. Johnson, Continuous Multivariate Distributions. New York: John Wiley, 2000. [5] D. V. Lindley and N. D. Singpurwalla, “Multivariate distributions for the life lengths of components of a system sharing a common environment,” J. Appl. Prob., vol. 23, no. 2, pp. 418–431, 1986. [6] A. W. Marshall and I. Olkin, “A multivariate exponential distribution,” Journal of the American Statistical Association, vol. 62, pp. 30–44, 1967. [7] R. Nelsen, An Introduction to Copulas. New York: Springer, 1999. [8] N. D. Singpurwalla, The Hazard Potential of Items and Individuals. [9] N. D. Singpurwalla and M. A. Youngren, “Multivariate distributions induced by dynamic environments,” Scandinavian Journal of Statistics, vol. 20, pp. 251–261, 1993. [10] A. Sklar, “Random variables, distribution functions, and copulas—A personal look backward and forward,” in Distributions With Fixed Marginals and Related Topics, Ruschendorff and Taylor, Eds. Hayward, CA: Institute of Mathematical Statcistics, 1996, pp. 1–14.
Nozer D. Singpurwalla is Professor of Statistics and Distinguished Research Professor at The George Washington University. He is Fellow of the American Statistical Association, the Institute of Mathematical Statistics, the American Association for the Advancement of Sciences, and an elected member of the International Statistical Institute. He has authored and coauthored over 170 papers and 2 books.
and mutatis mutandis if is independent of given . Conditional independence is commonly used when analyzing belief networks. However, it should be borne in mind that this
Chung-Wai Kong was a graduate student at the Institute for Reliability and Risk Analysis at The George Washington University.
Authorized licensed use limited to: IEEE Xplore. Downloaded on November 24, 2008 at 10:57 from IEEE Xplore. Restrictions apply.