School of Electrical Engineering & Computer Science (SEECS). National University of ...... Network Traffic,â Technical Report, Florida Tech.,. CS-2001-4.
On Mitigating Sampling-Induced Accuracy Loss in Traffic Anomaly Detection Systems ∗
Sardar Ali, Irfan Ul Haq, Sajjad Rizvi, Naurin Rasheed, Unum Sarfraz, Syed Ali Khayam and Fauzan Mirza School of Electrical Engineering & Computer Science (SEECS) National University of Sciences & Technology (NUST) Sector H-12, Islamabad 44000, Pakistan
{sardar.ali,
irfan.haq, sajjad.rizvi, naurin.rasheed, unum.sarfraz, ali.khayam, fauzan.mirza}@seecs.edu.pk
ABSTRACT
1.
Real-time Anomaly Detection Systems (ADSs) use packet sampling to realize traffic analysis at wire speeds. While recent studies have shown that a considerable loss of anomaly detection accuracy is incurred due to sampling, solutions to mitigate this loss are largely unexplored. In this paper, we propose a Progressive Security-Aware Packet Sampling (PSAS) algorithm which enables a real-time inline anomaly detector to achieve higher accuracy by sampling larger volumes of malicious traffic than random sampling, while adhering to a given sampling budget. High malicious sampling rates are achieved by deploying inline ADSs progressively on a packet’s path. Each ADS encodes a binary score (malicious or benign) of a sampled packet into the packet before forwarding it to the next hop node. The next hop node then samples packets marked as malicious with a higher probability. We analytically prove that under certain realistic conditions, irrespective of the intrusion detection algorithm used to formulate the packet score, PSAS always provides higher malicious packet sampling rates. To empirically evaluate the proposed PSAS algorithm, we simultaneously collect an Internet traffic dataset containing DoS and portscan attacks at three different deployment points in our university’s network. Experimental results using four existing anomaly detectors show that PSAS, while having no extra communication overhead and extremely low complexity, allows these detectors to achieve significantly higher accuracies than those operating on random packet samples.
The last few years have witnessed an exponential increase in the volume and sophistication of network attacks. To combat these rapidly evolving attacks, design of accurate Anomaly Detection Systems (ADSs), which can detect zeroday (previously unseen) attacks, has received significant attention with commercial ADSs now experiencing widespread deployments. In view of the unprecedented traffic volumes observed on contemporary enterprise networks and due in part to the stringent memory and complexity constraints of network devices, it is not possible for a real-time ADS to examine every packet in detail. Packet and flow sampling, originally proposed for network monitoring applications, are now being used to reduce the amount of data to be analyzed by a real-time ADS [1, 2]. Commercial ADS products are integrating sampling and anomaly detection algorithms in the routing fabric in order to achieve high-speed and truly-inline anomaly detection in real-time [3]–[6]. Packet sampling is an inherently lossy process which provides an incomplete and biased approximation of the underlying traffic. While minimization of estimation error on flow statistics is well-investigated [7]–[10], there have only been a handful of studies on the impact of packet sampling on anomaly detection [11]–[14]. While these studies unanimously agree that packet sampling can introduce significant accuracy degradations in an ADS, solutions to mitigate this accuracy loss are largely unexplored in research literature. The seminal paper in this domain concluded that [12]: “anomaly detection algorithms can be improved under sampling if the information loss and distortions is compensated or better avoided. Another relevant open question is whether correlating sampled traces from multiple vantage points could improve the anomaly detection process at relatively low sampling rates, hence avoiding the need for detailed packet trace collection.” In this paper, we propose a solution to simultaneously address these open problems by enabling an inline ADS to achieve higher accuracy under sampling by correlating traffic from different points of deployment in a network. Specifically, as opposed to prior studies which spatially distribute ADSs in a network [15, 16], we propose that ADSs are deployed progressively on nodes on a packet’s path. We then allow these ADSs to communicate with each other by encoding their binary score (malicious or benign) of the packet inside the packet’s header before forwarding it to the next hop
Categories and Subject Descriptors C.2.0 [Computer Systems Organization]: ComputerCommunication Networks—Security and protection.
General Terms Security, Measurement.
Keywords anomaly detection, packet sampling, denial-of-service (DoS), portscan. ∗ This work is supported by the Pakistan National ICT R&D Fund.
ACM SIGCOMM Computer Communication Review
5
INTRODUCTION
Volume 40, Number 3, July 2010
node. The ADS operating at the next hop uses this score as side information for packet sampling and anomaly detection. This binary side information can be effortlessly encoded inside IP packets, thus allowing different nodes to collaborate without any additional communication overhead. We show that this simple collaboration model, referred to as Progressive Security-Aware Sampling (PSAS) in this paper, enables inline anomaly detectors to achieve significantly higher accuracies by mitigating the information loss under sampling. First, we empirically show that, for a fixed sampling budget, an increase in the amount of malicious traffic in the sampled subset induces at least a linear, and mostly a much faster than linear, improvement in an ADS’ accuracy. To achieve these accuracy dividends, we propose the PSAS algorithm which samples packets marked as malicious with higher probabilities, while adhering to a given packet sampling budget. We analytically compare security-aware and random sampling for a fixed sampling budget. This comparison reveals that, regardless of the ADS algorithms employed by each node, PSAS samples considerably more malicious packets at each node than blind random sampling. To evaluate accuracy dividends and complexity of the proposed PSAS algorithm, we collect a labeled dataset of Internet attack traffic at three different points of deployment; these attacks include DoS and portscan attacks launched at varying rates. Using this dataset, we input randomly sampled and security-aware sampled traffic to four existing anomaly detectors [17]–[20]. ROC-based performance evaluation substantiates that security-aware traffic samples enable the anomaly detectors to consistently achieve significantly higher accuracies than random packet samples. These accuracy improvements are sustained for both low and high rate attacks. Moreover, we show that, in addition to having no additional communication overhead and memory requirements, PSAS’ run-time complexity is comparable to random sampling.
2.
are also disturbed but the traffic pattern is generally visible. A common approach followed by existing work is to use multiple ADSs on a single hop [26]–[28]. However, if the sampled subset of traffic is not representative of the overall traffic trends (e.g., does not contain enough malicious packets), then adding more ADSs on the same node will not increase an improvement in accuracy. Our focus on this work is to improve the sampled subset to facilitate the ADS deployed on a node. Hence, the multiple ADSs based detectors can also benefit from using a security-aware sampler. The biased and incomplete traffic captured by a packet sampler when input to an anomaly detector induces an undesirable loss of accuracy, thereby compromising the purpose for which the traffic was being sampled. Intuitively, an ADS operating on sampled traffic would want to operate on as much malicious data as possible. Therefore, instead of the security-unaware or blind packet/flow samplers, we need to design security-aware packet sampling algorithms. In view of the above discussion, we concern ourselves with security-aware packet sampling for an inline and realtime ADS. Due to our focus on real-time anomaly detection (which is typically integrated with the routing fabric), we do not consider flow sampling algorithms in this work.1 The main design constraints that a practical securityaware sampler should satisfy are: 1) It should sample high volumes of malicious traffic; 2) It should be generic or algorithmindependent so that it can be seamlessly integrated with any anomaly detector; 3) It should have low (if any) communication overhead to allow inline realization; and 4) It should have low complexity 2 to facilitate its real-time implementation. Consequently, while we will allow our approach to incorporate some changes to the nodes’ operation and for some information to be communicated between nodes, these changes must have very low complexity and communication overhead.
3. ATTACK TRAFFIC DATASET AND ANOMALY DETECTION ALGORITHMS
RELATED WORK AND DESIGN CONSTRAINTS
For the present problem, we needed a traffic dataset that meets the following requirements:
Most network anomalies tend to persist over time and are detected by performing sophisticated statistical analysis on a time-series of network parameters. In this context, packet and flow sampling techniques can have a serious adverse affect on the accuracy of the ADSs that are operating on the sampled traffic. Mai et al. [11] evaluated the impact of packet sampling on three portscan detection algorithms and concluded that packet sampling is an inherently lossy process which provides an incomplete and biased approximation of the underlying traffic. This work was extended in [12] and the affect of sampling was analyzed using four popular sampling techniques; random packet sampling, random flow sampling, sample-and-hold [21], and smart sampling [22]. Three anomaly detectors [23]–[25] were used to cover broad categories of volumetric and portscan detection. Results showed that all sampling algorithms adversely affect both volumetric and portscan anomaly detectors. Similarly, it was shown in [13] that the accuracy of an ADS is dependent on the rate of sampling when flow-based metrics are used. Brauckhoff et al. [14] analyzed the volume and feature entropy metrics and showed that packet sampling does not have much impact on volumetric packet counts but can introduce significant bias in flow counts. Feature entropies
ACM SIGCOMM Computer Communication Review
• Attack traffic is captured as it passes through different points in a network; • At each deployment point, benign (background) and attack data had to be labeled accurately to allow judicious evaluation of the impact of sampling on ADS accuracy; • For comprehensive performance evaluation, we needed attacks of different types (DoS, portscan, etc.) and rates; • For repeatable performance benchmarking by future studies, the dataset had to be publicly available; and 1 While some recently-proposed real-time flow sampling algorithms [29]–[32] can also benefit from the proposed PSAS algorithm, we do not consider them in this paper because they will introduce undesirable communication overhead between communicating nodes. 2 We define complexity in terms of run-time complexity and memory usage.
6
Volume 40, Number 3, July 2010
Table 1: Background Traffic Information During Attacks Attack Name
Attack Characteristics
ICMP Protocol Unreachable Portscans
Random dest IP addr Fixed src IP addr
ICMP Path MTU Discovery Portscans
Random dest IP addr Fixed src IP addr
TCP-SYN portscans
Random dest IP addr Fixed src IP addr Two distinct attacks: First scan on port 80, Second scan on port 135
ICMP echo ping flood (DoS)
Spoofed src IP addr Two different public IPs attacked (two remote servers)
TCP-SYN flood (DoS)
Spoofed src IP addr Two remote servers attacked Attacked ports: 143, 22, 138, 137, 21
UDP flood fraggle
Spoofed src IP addr Two remote servers attacked Attacked ports: 22, 80, 135, 143
Attack Rate (pkts/sec) 0.1 1 10 100 1000 0.1 1 10 100 1000 0.1 1 10 100 1000 0.1 1 10 100 1000 0.1 1 10 100 1000 0.1 1 10 100 1000
• To cater for different types of ADSs and attacks (present and future,) the dataset should contain different types (ICMP, TCP, UDP, etc.) of packets with full (header + payload) packet information.
Endpoint Traffic
Before the attacks were launched, some background (benign) data had to be collected at each network entity in order to train our algorithms under normal circumstances. At the endpoint, this background dataset was collected at three computers in our research lab. Background data were logged during six separate periods, each one of over three hours duration, for an aggregate of approximately nineteen hours. More specifically, traffic was collected on six separate days during peak hours of Internet activity, and included traffic from activities such as peer-to-peer file sharing, software downloading from remote servers, web browsing, and real-time video streaming. The average traffic rates on these endpoints varied between 200 to 650 packets/second with a standard deviation of approximately 153 packets/second; the high standard deviation is due to bursty video traffic. This high, yet realistic, volume of background traffic was introduced so that the attack traffic mixes up with benign data and does not stand out. During the onset of an attack, this background traffic remained uninterrupted. The three endpoints were scheduled to simultaneously launch each attack, aimed to emulate a
ACM SIGCOMM Computer Communication Review
Attack Time Wing Router µ σ 2646.6 578.2 2948.4 371.1 3305.2 340.7 6495.8 3075.6 3082.1 279.3 2255.7 341.8 5381.6 2409.0 3242.6 550.5 1893.9 255.6 3242.5 222.1 2462.9 474.4 3002.6 398.0 3325.2 397.7 6100.0 2492.4 3084.7 247.4 2021.9 184.3 2466.8 272.6 4318.5 1790.1 5565.0 2493.8 3128.4 245.2 2240.1 216.7 2699.1 328.8 4409.8 1666.2 3964.1 1670.4 3000.9 238.0 2025.8 506.4 2479.1 291.0 4028.4 1893.1 6565.7 3006.9 2883.7 260.8
botnet or localized scanning scenario in which a pool of compromised hosts exist in a network. The attacks were launched at five different rates. The rates were progressively increased to launch the attacks over a range of values (0.1, 1.0, 10, 100, and 1000 pkts/sec). For the portscan attacks, the slow rates are ideal as hackers can avoid detection using very low rates while the damage caused by DoS attacks is more prominent at high rates. To label the attack traffic, we set the reserved flag in the IP header of each attack packet; this bit is unused and generally a default value of zero is used for it. In an inline setting, the same bit may be used by a node to communicate its packet anomaly score to the next hop nodes.
Existing public traffic attack datasets [33]–[36] do not satisfy one or more of the above requirements. Therefore, we collected our own traffic dataset and the rest of this section explains our data collection experimentFor repeatable performance evaluation, our labeled dataset is publicly available at http://wisnet.seecs.edu.pk/datasets/.
3.1
Background Traffic Statistics at (pkts/sec) Endpoints Lab Router µ σ µ σ 151.4 115.3 897.8 440.6 201.8 114.3 963.6 140.2 202.2 59.1 1211.2 309.2 264.8 117.5 2310.9 907.5 212.0 50.9 937.7 144.0 360.9 96.0 809.3 144.8 377.1 166.8 1037.5 417.0 394.9 84.3 962.7 151.9 377.0 93.4 515.1 224.0 430.8 83.1 899.6 105.1 576.7 94.5 1184.6 138.2 549.4 146.8 1487.2 265.0 534.0 81.9 1645.5 180.9 555.5 67.3 1244.6 188.1 698.8 96.3 1253.9 138.4 478.2 59.4 943.2 96.6 452.7 76.7 1024.7 103.3 786.2 75.5 1616.3 150.8 819.4 82.9 1438.1 141.2 639.2 119.7 1191.4 124.4 354.3 52.9 781.2 109.8 504.6 62.6 1175.5 142.7 724.6 118.2 2734.3 1777.2 471.9 90.5 1031.7 123.1 426.0 59.2 980.4 106.8 323.5 48.7 693.7 108.2 300.1 61.7 907.4 113.7 421.3 54.7 2261.8 1847.1 494.2 66.7 1151.9 157.6 578.7 62.3 1069.7 111.5
3.2
Lab and Research Wing Routers’ Traffic
The network at NUST SEECS comprises three distinct wings (named as academic, faculty, and research) with the labs located within the research wing. Traffic from each lab is routed by a lab router (first hop) to a research wing router (second hop). These wing routers are in turn connected to a distribution router that handles traffic from the entire school. The first hop lab router handles traffic from a total of 28 computers running different operating systems, applications and services. The wing router manages traffic of approximately 50 hosts situated in three distinct labs. Ports were mirrored on the research lab and wing routers to receive the traffic (inbound, outbound and internally routed). The mean and standard deviation of the background traffic on the lab router were approximately 1220 and 620 packets/sec. Mean and standard deviation on the wing router were approximately 3060 and 1510 packets/sec.
7
Volume 40, Number 3, July 2010
3.3
Preliminary Traffic Statistics
the Ethernet, IP, TCP, UDP and ICMP headers. An anomaly score is assigned to each packet header field in the testing phase and the fields’ scores are summed to obtain a packet’s aggregate anomaly score. We evaluate PHAD-C32 [19] using the following packet header fields: source IP, destination IP, source port, destination port, protocol type and TCP flags. The top n values are thresholded as anomalous. The value of n is varied to generate ROCs.
Table 1 shows the diversity of the collected attack dataset. At the endpoints, the background traffic rate during low rate attacks (0.1 and 1 attack packets/sec) is two or three orders of magnitude greater than the attack rate. On the other hand, background traffic rate is comparable to or less than the high rate attacks (1000 packets/sec). At the lab router, the low-rate attacks are further diminished by large volumes of background traffic. However, the high rate attacks still comprise a considerable fraction of the first hop traffic. At the wing router, the high rate attacks have two to three times lesser rate than the background traffic and therefore do not dominate the total traffic. Based on this attack and background traffic rate diversity, we expect that detection will become more and more difficult as we move from the endpoints to the Wing router mainly because the attack traffic will mix with considerable volumes of background traffic.
3.4
• Network Traffic Anomaly Detector (NETAD) [20]: NETAD detects incoming IP traffic anomalies and operates on the first 48 bytes of a packet including header in a modeled subset. It computes a packet score depending on the time and frequency of each byte of packet in the modeled subset. All packets exceeding a certain threshold are marked as anomalous. For our performance evaluation, we operated NETAD in the reverse (outgoing) direction. As with PHAD, the top n values are thresholded as anomalous.
Anomaly Detectors used in this Study
Since it is not possible to evaluate all existing ADSs, we selected the following four ADSs for this study: Maximum Entropy Anomaly Detector [17]; Credit-Based Threshold Random Walk (TRW) Anomaly Detector [18]; Packet Header Anomaly Detector (PHAD) [19]; and Network Traffic Anomaly Detector (NETAD) [20]. The two main rationales for choosing these ADSs were: 1) Diversity in Accuracy: These detectors have been shown to provide varying accuracies at different points of deployment [36]; 2) Diversity in Detection Principles and Features: These ADSs use different traffic features and detection principles and operate at different traffic granularities. The rest of this section briefly summarizes the basic detection principles of these anomaly detectors. Interested readers are referred to the original papers for details description of each detector.
4. SECURITY-AWARE PACKET SAMPLING In the context of accuracy loss, which is due to packet sampling, an important question that is still unanswered is: For a given and fixed sampling budget, would an ADS’ accuracy improve if we can somehow sample a larger fraction of malicious traffic? If this question is answered in affirmative, another resultant question is: How much improvement in accuracy should we expect with such securityaware sampling? Finally, and most importantly, how can we design an efficient (low-complexity, low-overhead) securityaware packet sampler to sample higher fractions of malicious packets? In this section, we empirically answer the first two questions by evaluating ADS’ under increasing number of malicious samples. After establishing consistent accuracy benefits provided by higher volumes of malicious samples, the remainder of this section is dedicated to designing and analytically evaluating an efficient security-aware sampler.
• Maximum Entropy Anomaly Detector [17]: This detector computes real-time ADS scores of various classes of network traffic based on a baseline benign traffic distribution. An alarm is raised if a packet class’s ADS score repeatedly exceeds a fixed threshold a certain number of times. We varied this threshold of obtain accuracy points on the ROC plane. To identify maliciousness at the packet level, we identified the packet classes which exceeded the detection threshold in a time-window and then marked all packets belonging to that class as malicious.
4.1
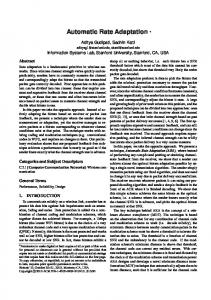
To empirically answer the first two questions posed above, we use TCP portscan and TCP-SYN flood attacks at different rates. From each attack dataset, we created five sampled subsets each with a sampling budget of ps = 0.05 To emulate higher malicious packet fractions within this sampling budget, we respectively introduced 1%, 2%, 3%, 4% and 5% of malicious traffic samples in the five datasets. To analyze the impact of sampling with an increasing ratio of maliciousto-benign packets, the portscan datasets were input to TRW and NETAD, while the TCP-SYN flood datasets were input to Maximum Entropy and PHAD detectors. It can be intuitively argued that a linear increase in the number of malicious packets at an ADS’ input should introduce a linear increase in accuracy; this projected linear trend is shown as a dotted line in Fig. 1. The lines marked using asterisks in the detection plots represent the total number of malicious packets that are sampled in each dataset; i.e., the maximum number of detections that can be achieved by an ADS. Note that for Maximum Entropy, TRW and PHAD, a much faster than linear improvement in detection rate is observed. At the same time, the false positive rates of these detectors decrease exponentially with an in-
• Credit-Based Threshold Random Walk (TRW) Algorithm [24, 18]: The original TRW algorithm [24] computes an ADS score by applying the sequential hypothesis on a remote host’s connection attempts. This ADS score is thresholded to determine whether or not a remote host is a scanner. TRW-CB [18] is a hybrid solution, leveraging the complementary strengths of Rate Limiting and TRW. A credit increase/decrease algorithm is used to slow down hosts that are experiencing unsuccessful connections. We generate ROCs for TRW-CB by varying its upper and lower hypothesis testing thresholds. • Packet Header Anomaly Detector (PHAD) [19]: PHAD learns the normal range of values for all 33 fields in
ACM SIGCOMM Computer Communication Review
Impact of Increasing Malicious Packet Samples on ADS Accuracy
8
Volume 40, Number 3, July 2010
4
5
x 10
3 Total Malicious Pkts Maxent (Actual) Maxent (Projected Linear) PHAD (Actual) PHAD (Projected Linear)
8
x 10
2.5
False Positives
Malicious Packets Detected
10
6
4
2
2 1.5 1 0.5
0 1
2
3
4
0 1
5
Malicious Packets (%)
2
3
4
5
Malicious Packets (%)
(a) Detections: MaxEnt/PHAD
(b) False Positives: MaxEnt/PHAD
4
x 10
8
10000 Total Malicious Pkts TRW (Actual) TRW (Projected Linear) NETAD (Actual) NETAD (Projected Linear)
8000
False Positives
Malicious Packets Detected
10
6
4
4000
2000
2
0 1
6000
2
3
4
0 1
5
2
3
4
5
Malicious Packets (%)
Malicious Packets (%)
(c) Detections: TRW/NETAD
(d) False Positives: TRW/NETAD
Figure 1: Linear, maximum and actual number of detections and false positives under different malicious-tobenign sampling ratios; ps = 0.05. crease in malicious traffic samples. Improvements for the NETAD detector are largely linear because the detector inherently has a very high detection rate with very few false positives even for the 1% dataset. It should be highlighted that accuracy improvements get more and more pronounced with an increase in the number of malicious sampled traffic. The detection rates of Maximum Entropy, TRW and PHAD quickly approach the maximum with an increase in the fraction of malicious packets. For instance, the PHAD detector achieves approximately 80% detection for the 5% dataset as opposed to only 25% detection rate for the 1% dataset. These detection rate improvements are complemented by drastically reduced false positives rates. Based on the proof-of-concept results of this section, we conclude that a loss of sampling-induced accuracy in an ADS is proportional to the malicious-to-benign traffic samples at its input. Thus, in addition to being detected, these additional malicious packets also facilitate detection of other packets. The better-than-linear accuracy improvements achieved by increasing the number of malicious packets in a traffic ensemble motivates the need for a security-aware packet sampling algorithm which can sample higher volumes of malicious traffic. We propose such a technique in subsequent section.
ACM SIGCOMM Computer Communication Review
9
4.2
Progressive Security-Aware Packet Sampling (PSAS)
At this point, we have established the considerable accuracy benefits of sampling higher volumes of malicious traffic. Therefore, we turn our attention to the last question of how a security-aware sampler will sample higher volumes of malicious traffic. While having high malicious sampling rates, a practical security-aware sampler must also satisfy the other design constraints set forth in Section 2 We propose a Progressive Security Aware Sampling (PSAS) algorithm which operates on the following principle: ADSs are deployed progressively on nodes on a packet’s path. These ADSs communicate with each other by encoding their binary score (malicious or benign) of a packet inside the packet’s header before forwarding it to the next hop node. The first node uses random sampling since it has no prior information to perform informed (security-aware) sampling. The security-aware sampler (PSAS) operating at the next hop uses this score as side information to sample packets marked as malicious (by the last hop node) with higher probabilities, while adhering to a given sampling budget. It should be clear that when a packet is classified as malicious at a node k − 1 it may or may not be classified as malicious at the next node k. Specifically, node k − 1 marks sampled and potentially-malicious packets to facilitate sampling at node
Volume 40, Number 3, July 2010
Algorithm 1: PSAS Algorithm
Table 2: Symbols Definitions
Input: Input Traffic D, Sampling Budget ps , Security-Aware Sampling rate pso , and a random number generator rnd. Output: Sampled Traffic d
Symbol (k) pB|B (k)
1 begin 2 db ← 0; */ db is the number of sampled marked packets. */
pM |M
3
pc
M |B
db ; |D|
4
fs ← ps − pso ×
5
/* score is a bit that contains the packet’s security mark. */
6
if p.score == malicious then
7
generate rnd;
8
if rnd ≤ pso then
9
(k)
pc
M |M
(k)
k results in fs = 0. PSAS’ apparently simple methodology satisfies our design constraints:
d.add(p);
10
db = db + 1;
11
/* packets sampled by PSAS sampler become input to the ADS at each PSAS node. The ADS process and calculate its malicious score. */
12 13 14
end
15
else
1. It can be observed intuitively—and will be mathematically proven shortly—PSAS will sample higher volumes of malicious packets if the progressive anomaly detectors are accurate. In fact, since anomaly detection accuracy generally degrades as we move from the endpoints to the network core [36], PSAS’ sampling efficiency—which is driven by the previous hops—should improve at each progressive node.
p.score = processP acket(p); end
16
generate rnd;
17 18
if rnd ≤ fs then d.add(p);
19
20 21 22 23
(k)
foreach (Packet p in D) do
2. PSAS can be used with any ADS. In fact, since PSAS allows different ADSs to be deployed at each hop, each of these ADSs can be customized for the traffic characteristics and attack vulnerabilities for a given point of network deployment.
/* packets sampled by PSAS sampler become input to the ADS at each PSAS node. The ADS process and calculate its malicious score. */ p.score = processP acket(p); end
3. PSAS has no additional communication overhead because progressive nodes communicate using only a single bit which can be encoded in unused IP packet headers, thereby precluding the need for an additional communication channel [15, 16] between nodes.
end /* forward packet p to the next hop node */
24 p.f orward(p.destIP ); 25 end 26 end
4. PSAS has very low complexity; empirical results substantiate this claim in the following section.
(k)
k. Under a given packet sampling budget ps at node k, traffic which has been classified and then marked as malicious by the ADS at node k − 1 is sampled with a high prob(k) ability pso at next node k. After this security-aware sampling, the remaining packet sampling budget is exhausted by random samples from unmarked traffic. The ADS deployed at each node k marks the classified as malicious packets independent of the fact that a packet was previously marked as malicious or it is previously unmarked. The mark on a packet is used by a PSAS sampler to preferentially sample the packets at the input of the ADS; however, the mark is not used as side information during ADS processing. Hence, the ADS at each node marks the classified as malicious packets which come: 1) from the previously marked packets; and 2) from randomly sampled packets. Consequently, as compared to random sampling, PSAS increases the number of correctly marked packets along a packet path as the number or nodes increases To meet the sampling budget, unmarked traffic is randomly sampled according to the following sampling function: (k)
Definition Probability that an unmarked benign packet is received at k-th hop Probability that an unmarked malicious packet is received at k-th hop Probability that a benign packet mistakenly marked as malicious is received at k-th hop Probability that a malicious packet correctly marked as malicious is received at k-th hop
Stepwise execution of the proposed PSAS algorithm is shown in Algorithm 1. The following section mathematically proves that under certain realistic conditions PSAS always samples more malicious packets than blind random sampling.
4.3
We first detail our assumptions and system model which is followed by analytical comparison of the two sampling approaches.
4.3.1
System Model and Assumptions
For analytical comparison, we make the following realistic assumptions: (k)
• The total sampling budget is fixed to ps ; • All the attacking nodes belong to the same subnet and each node i of them generates the malicious traffic at λM i packets per unit time;
(k)
(k) fs(k) = p(k) s − pso (pM c/M + pM c/B ).
• Benign traffic increases at each node along the path; • Probability of correct detection of malicious packets (k) pd is greater or equal to probability of false positives (k) pf ; and
(k)
The value of fs is greater or equal to zero. In the worst case, where all the sampled packet are marked as malicious (k) by a node k − 1, and sampled with pso = 1 at the next hop
ACM SIGCOMM Computer Communication Review
Analytical Comparison of PSAS and Random Sampling
10
Volume 40, Number 3, July 2010
Input Symbols
*
k) I(B|B
ADS 1 − fs(k)p(fk) (k )
λ(B2)
Output Symbols
k) O(B|B
fs pf
1 − fs(k)p(dk) (k )
k
λB(k +1)
( )
λB
λB(1) λ M(1)
(k )
k) I(M|M
λ(B3)
k) O(M|M
(k )
fs pd
Node 1 **
I(k) � M|B I(k) � M|M
1 − p(fk)
p(fk)
1 − p(dk)
p(dk) * **
O(k) � M|B
O(k) � M|M
Lemma 1. The ratio of malicious packets in marked traffic is higher than the ratio of malicious packets in unmarked (k) (k) traffic at any node k for all pd ≥ pf , where k = 1, 2, . . ..
Unmarked Traffic Marked Traffic Benign Traffic Malicious Traffic
Proofs are provided in the appendix. (k) (k) The pd ≥ pf condition in the above lemma is quite relaxed. Recall that, as opposed to random sampling which samples from the entire traffic randomly, the proposed PSAS sampler samples packets marked as malicious with higher probability. Hence, in essence the above lemma states that (k) for a given sampling budget ps , the fraction of malicious traffic will be higher in security-aware sampled traffic. (k) (k) By further constraining the relation between pd and pf within realistic limits, we reach the following corollary.
(k)
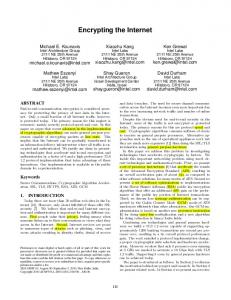
• ps◦ = 1; this assumption is invoked to simplify mathematical exposition. Based on the above assumptions, the rate of malicious traffic at each node is the same λM , while the rate of benign P (i) traffic at the k-th hop is ki=1 λB . The k-th node samples (k) the incoming traffic with probability ps and passes it to the ADS which marks it based on its maliciousness level. Two types of traffic are received at each node: marked traffic (i.e., traffic marked as malicious) and unmarked traffic (i.e., traffic marked as benign or previously unsampled traffic). To analytically model the packet sampling operation, we adopt a unique perspective: We treat sampling and the malicious traffic detection algorithm at each node as a channel. The input of this channel comprises four types of traffic called symbols in communication theory literature. The four symbols are: 1) unmarked benign packets, 2) unmarked malicious packets, 3) packets marked as malicious which are in fact malicious (correct detections), and 4) packets marked as malicious which are in fact benign (false positives). We follow the notation described in Table 2. The probabilities that one symbol will get mapped to an(k) (k) other is dependent on the accuracy (pf and pd ) of the k-th hop ADS as shown in Fig. 2. For instance, the probability that once sampled a marked malicious packet will again be (k) marked as malicious is pd . These probabilities are tuned in (k) accordance with the sampling function fs defined earlier. At the first node, we only have two types of traffic (unmarked benign and unmarked malicious); i.e., the probability of all other symbols is zero. Progressive packet markings by subsequent nodes will result in the cascaded channel shown in Fig. 3.
Corollary 1. The ratio of malicious packets in marked traffic is much higher than the ratio of malicious packets in (k) (k) unmarked traffic at any node k for all pd ≥ 2pf , where k = 1, 2, . . .. This corollary states that, under the very reasonable con(k) (k) dition of pf = pd /2, PSAS will always sample considerably more malicious packets than random sampling. Note that these constraints on detection and false positive rates should be satisfied by any practical ADS. Hence, irrespective of the ADS used at each hop, PSAS should always sample higher fractions of malicious traffic than random sampling. The following section quantifies accuracy improvements provided by these additional malicious samples using the attack dataset. We also evaluate the complexity of the PSAS algorithm.
5. 5.1
PERFORMANCE EVALUATION Accuracy Evaluation
Random sampling mainly causes an increase in missed detections. To cater for these missed detections, an ADS’ classification threshold is generally decreased so that the few malicious packets which have been randomly sampled can be classified correctly. Interestingly, such a strategy results in more false positive because many benign packets are classified as malicious due to the low threshold. Therefore, random sampling affects both the detection rate and false alarm rate of an ADS. PSAS mitigates this problem by sampling malicious packets preferentially. We use Receiver Operating Characteristic (ROC) curves to evaluate the accuracy improvements provided by PSAS. We deploy the same ADS at each hop and repeat the experiment for each of the four ADSs. ADSs are evaluated on
Malicious Traffic Sampling Rates
We now analytically compare the malicious traffic sampling rate of the proposed security-aware sampling with random sampling. In security-aware sampling, we sample from two different types of traffic: marked (as malicious) and unmarked (unsampled or marked as benign). We state the first result based on the above sampling function as follows.
ACM SIGCOMM Computer Communication Review
Node k
Figure 3: Security-aware sampling algorithm as a cascaded channel.
Figure 2: Probabilistic model of an ADS operating on security-aware traffic samples.
4.3.2
Node 2
11
Volume 40, Number 3, July 2010
10
Malicious Packets Detected (%)
Malicious Packets Detected (%)
10 9 8 7 6 5 4
TCP Flood (PSAS) TCP Flood (Random) UDP Flood (PSAS) UDP Flood (Random) TCP PortScans (PSAS) TCP PortScans (Random)
3 2 1 0 0
0.01
0.02
0.03
0.04
0.05
0.06
0.07
9
7 6 5 4 3 2 1 0 0
0.08
TCP Flood (PSAS) TCP Flood (Random) UDP Flood (PSAS) UDP Flood (Random) TCP PortScans (PSAS) TCP PortScans (Random)
8
0.005
0.01
False Positives (%)
(a) Maximum Entropy: First hop
Malicious Packets Detected (%)
Malicious Packets Detected (%)
8 7 6 5 4 3 2 1 0.01
0.02
0.03
0.04
0.05
0.06
0.07
0.04
7 6 5 4 3 2 1 0 0
0.08
0.01
0.02
0.03
0.04
0.05
0.06
0.07
False Positives (%)
(d) PHAD: Second hop
10
Malicious Packets Detected (%)
10
Malicious Packets Detected (%)
0.035
8
(c) PHAD: First hop
9 8 7 6 5 4 3 2 1 0.01
0.02
0.03
0.04
0.05
0.06
0.07
9 8 7 6 5 4 3 2 1 0 0
0.08
0.01
0.02
False Positives (%)
0.03
0.04
0.05
0.06
False Positives (%)
(e) TRW: Second hop
(f) TRW: First hop
12
Malicious Packets Detected (%)
12
Malicious Packets Detected (%)
0.03
9
False Positives (%)
10
8
6
4
2
0 0
0.025
10
9
0 0
0.02
(b) Maximum Entropy: Second hop
10
0 0
0.015
False Positives (%)
0.005
0.01
0.015
0.02
0.025
10
8
6
4
2
0 0
0.03
0.005
0.01
0.015
False Positives (%)
False Positives (%)
(g) NETAD: First hop
(h) NETAD: Second hop
0.02
Figure 4: ROC-based accuracy evaluation at the first and second hops (second and third nodes); results are computed by averaging over all the attack packets of a particular attack.
ACM SIGCOMM Computer Communication Review
12
Volume 40, Number 3, July 2010
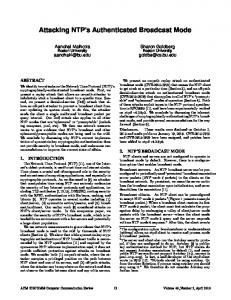
TCP-SYN flood, UDP flood, and TCP portscans. We separately input security-aware and randomly sampled packets into these ADSs. Other sampling parameters are as follows: (k) (k) ps = 0.05; pso = 1; k = 0, 1, 2. We designed an experimental setup for three cascaded nodes (Endpoint, lab router, and research wing router). The first node (endpoint) on a packet’s path has no prior information about the maliciousness of the packet. We randomly sample packets at this first node. The second node along the packet path (first hop lab router) has some knowledge about the maliciousness of the traffic. The second node samples the packet marked by the first node as malicious with higher probability and the remaining sampling budget, if any, is exhausted by sampling the remaining budget randomly. The ADS at this second node marks any packets detected as malicious and similarly the third node along the packet path (e.g., the second hop research wing router in our experiments) follows the same procedure of sampling the marked packets with higher probability, marking any of the sampled traffic that is considered malicious by the ADS at that node and forwarding the (marked or unmarked) packet to the next hop along the path. We obtain the results on the ADSs in offline mode. First, we input the randomly sampled endpoint traffic of the collected dataset to the ADSs. The ADSs mark the classified as malicious packets and then we use these marked packets as side information for the PSAS sampler to sample the marked packets preferentially in the lab router’s traffic in the collected dataset. Similarly, the PSAS sampler uses the marked packets from the lab router traffic to sample the second hop research wing traffic of the dataset. Fig. 4 shows accuracy results for all three attacks averaged on varying (0.1, 1, 10, 100, and 1000 pkts/sec) attack intensities. Fig. 4 (a) – (d) show that PSAS introduces a significant and consistent improvement in anomaly detection accuracy. The most significant improvements are observed for the flood attacks; for instance, at a false positive rate of 0.03 for the TCP flood at first hop, approximately 3 and 2 times higher detection rate than random sampling are observed for Maximum Entropy and PHAD, respectively. The improvement for the same attack is more significant at the second hop; for instance, at a false positive rate of 0.015 for Maximum Entropy and 0.02 for PHAD, approximately 9 and 6 times higher detection rate than random sampling are observed respectively. Even for the portscan attacks at the first hop, 3 and 10 times improvements in detection rate (at 0.03 false positive rate) over random sampling are respectively achieved for the two algorithms. Similar or better improvements for the portscans at the second hop are observed. The improvements in accuracies are also quite pronounced for TRW and NETAD [Fig. 4(e) – (h)]. For TCP portscans, TRW can achieve twice as many detections as random sampling for a false positive rate of 0.01 at the first hop and the improvement for the same attack is more pronounced at the second hop. Improvements for UDP flood are not pronounced mainly because TRW is specifically designed to detect TCP portscans. NETAD has very low false positive rates but its detection rate saturates under random sampling. For the same false positive rate, PSAS allows NETAD to double its number of detections. Fig. 5 illustrates the accuracies of two ADSs at the second hop (research wing) router’s dataset under varying (high
ACM SIGCOMM Computer Communication Review
Table 3: Complexity of PSAS and Random Sampling to Sample One Second of Traffic Attack rate (pkts/sec) Time (sec)
PSAS 10 0.074
Random 10 0.082
PSAS 1000 0.0578
Random 1000 0.0765
and low-rate) attack rates. It can be seen that for both the Maximum Entropy and NETAD algorithms, the detection accuracy is improved by a significant factor irrespective of attack rate. For example, in the case of a low-rate attack (considered more difficult to accurately detect as compared to high-rate attacks), the detection accuracies of both algorithms are more than double than the accuracies achieved using random sampling. Thus, we conclude that PSAS can improve anomaly detection accuracies regardless of the underlying attack rates. We do not show the results of the ADSs on 0.1 and 1 pkts/sec attack intensities.The reason is that the affect of sampling on very low rate attacks is most severe and these attacks remain undetectable. In our scenario, under sampling budget of 5%, the intensities of 0.1 and 1 pkts/sec attacks decrease to 0.005 and 0.05 pkts/sec respectively. Detection of such low rate attacks at today’s high speed links is very difficult to realize and therefore we observed a 0% detection rate for all ADSs.
5.2
Complexity and Communication Overhead
As emphasized earlier, our proposed PSAS algorithm allows different nodes in the network to communicate using only a binary score which can be easily encoded inside an IP packet. This procedure does not utilize any additional bandwidth or communication overhead. Moreover, PSAS does not require any extra memory because the packet marks are stored inside the packet. Therefore, additional data structures are not required by PSAS and its data memory requirements are identical to random sampling. Table 3 shows that the run-time complexity3 of PSAS is comparable to random sampling at low attack rates. Interestingly, the run-time complexity of PSAS is lower than random sampling at high attack rates. This was observed because the random sampler generates a random number rnd, between 0 and 1, for each incoming packet and samples the packet when the rnd is less than or equal to the (k) (k) sampling budget ps ; in our experiments we use pso = 1 and consequently the PSAS’ sampling simply involved picking up a large number of marked malicious packets and the overhead of random number generation was reduced. We argue that our sampling algorithm is substantially less expensive as compared to the normal operation of a typical Gigabit network router which has to extract and change destination MAC addresses from each packet, as well as update the CRC value. In comparison, checking and modifying a single bit value in each packet has negligible complexity. The computational complexity of PSAS may be further improved by modifying the packet marking technique as under: when a packet is marked as malicious at a node k, all the subsequent packets of the same flow can be marked as malicious without the need of inspecting each individual sampled packet by the ADS. However, this technique does 3
Complexity is measured using the hprof tool on a dual core 2.2 GHz Intel machine. File I/O is not included in complexity.
13
Volume 40, Number 3, July 2010
12
Malicious Packets Detected (%)
Malicious Packets Detected (%)
14 12 10 8 6 4 2 0 0
0.2
0.4
0.6
0.8
1
1.2
10 TCP Flood (PSAS) TCP Flood (Random) UDP Flood (PSAS) UDP Flood (Random) TCP PortScans (PSAS) TCP PortScans (Random)
8
6
4
2
0 0
1.4
0.01
False Positives (%)
(a) MaxEnt: attack rate 10 pkts/sec
0.04
0.05
12
Malicious Packets Detected (%)
Malicious Packets Detected (%)
0.03
(b) MaxEnt: attack rate 1000 pkts/sec
16 14 12 10 8 6 4 2 0 0
0.02
False Positives (%)
0.002
0.004
0.006
0.008
10
8
6
4
2
0 0
0.01
0.005
0.01
0.015
0.02
0.025
0.03
0.035
0.04
False Positives (%)
False Positives (%)
(c) NETAD: attack rate 10 pkts/sec
(d) NETAD: attack rate 1000 pkts/sec
Figure 5: Accuracy evaluation at the second hop (third node) under varying attack intensities; results are computed separately for low and high rate attacks; results for other ADSs and hops are available at http://wisnet.seecs.edu.pk/publications/2010/PSAS/. not necessarily provide higher detection accuracy because the detection by the ADS might be incorrect.
6.
LIMITATIONS AND COUNTERMEASURES
We now highlight some limitations of the proposed PSAS technique and offer solutions to circumvent these limitations. • Since PSAS samples every marked packet with prob(k) ability ps◦ , if a malicious packet is skipped at node k −1, it will likely continue to be skipped further along its path. This problem can occur when significant portion of the sampled packets is marked as malicious; the probability of which is very low in real-traffic. More(k) over, to counter this issue, the sampling parameter ps◦ can be tuned to support detection of new malicious packets while sustaining previously detected threats.
• Inline intrusion detection can have an adverse affect on delay sensitive applications; for example, undesirable jitter may be introduced in a multimedia application. Such a scenario will only arise if the delay-sensitive packets are marked as malicious. This problem can only be mitigated by improving anomaly detection accuracy.
• Malicious packets can evade sampling by increasing the rate of attack so that the sampling budget is exhausted; e.g., DoS attacks can be used to hide portscan attacks. This type of evasion can be mitigated by maintaining a list of malicious hosts observed in window n and then sampling these hosts preferentially in window n + 1.
7. CONCLUSION To the best of the authors’ knowledge, this paper proposes the first known solution to mitigate sampling-induced accuracy loss in an anomaly detection system. PSAS sampling is efficient, having no communication overhead and low
• We do not assume that all ADSs are deployed by the
ACM SIGCOMM Computer Communication Review
same operator, and we do indeed consider that a node in the PSAS scheme may be untrusted (e.g., mismarking packets intentionally). If a node is not trusted, it affects the PSAS only at a single point, because at each hop the ADS decides for a packet maliciousness independently. The marks are only used by PSAS not by the ADS. However, it might be possible to subvert the effectiveness of PSAS if a malicious node intentionally exploits the design of PSAS - however, in order to do this, it would need to know the PSAS sampling parameters of its neighbours.
14
Volume 40, Number 3, July 2010
complexity. We also showed that the sampling-induced accuracy degradation in an ADS can be significantly reduced by PSAS, with promising avenues for further research in this area.
8.
[21]
REFERENCES
[22]
[1] M. S. Kim, H. J. Kang, S. C. Hung, S. H. Chung, and J. W. Hong, “A Flow-based Method for Abnormal Network Traffic Detection,” IEEE/IFIP NOMS, 2004. [2] A. Lakhina, M. Crovella, and C. Diot, “Mining Anomalies Using Traffic Feature Distributions,” ACM SIGCOMM, 2005. [3] Cisco Anomaly Guard Module Homepage, www.cisco.com/en/US/products/ps6235/. [4] Arbor Networks Peakflow-X Homepage, http: //www.arbornetworks.com/en/peakflow-x.html. [5] Endace NinjaBox Homepage, http://www.endace.com/ninjabox.html. [6] FireEye Homepage, http://www.fireeye.com/. [7] B. Y. Choi, J. Park, and Z. L. Zhang, “Adaptive random sampling for total load estimation,” IEEE ICC, 2003. [8] N. Duffield, C. Lund, and M. Thorup, “Properties and prediction of flow statistics from sampled packet streams,” ACM IMC, 2002. [9] N. Duffield, C. Lund, and M. Thorup, “Estimating Flow Distributions from Sampled Flow Statistics,” ACM SIGCOMM, 2003. [10] N. Hohn and D. Veitch, “Inverting Sampled Traffic,” ACM IMC, 2003. [11] J. Mai, A. Sridharan, C. N. Chuah, H. Zang, and T. Ye, “Impact of packet sampling on portscan detection,” IEEE J. SAC, 24(12):2285-2298, 2006. [12] J. Mai, C. N. Chuah, A. Sridharan, T. YE, and H. Zang, “Is sampled data sufficient for anomaly detection?” ACM IMC, 2006. [13] G. Androulidakis, V. Chatzigiannakis, S. Papavassiliou, M. Grammatikou, V. Maglaris, “Understanding and Evaluating the Impact of Sampling on Anomaly Detection Techniques,” IEEE MILCOM, 2006. [14] D. Brauckhoff, B. Tellenbach, A. Wagner, M. May, A. Lakhina, “Impact of Packet Sampling on Anomaly Detection Metrics,” ACM IMC, 2006. [15] Y. Kim, W. C. Lau, M. C. Chuah, and H. J. Chao, “PacketScore: Statistics-based Overload Control against Distributed Denial-of-Service Attacks,” IEEE INFOCOM, 2004. [16] P. E. Ayres, H. Sun, and H. J. Chao, “ALPi: A DDoS Defense System for High-Speed Networks,” IEEE J. SAC, 24(10):1864-1876, 2006. [17] Y. Gu, A. McCullum, and D. Towsley, “Detecting anomalies in network traffic using maximum entropy estimation,” ACM IMC, 2005. [18] S. E. Schechter, J. Jung, and A. W. Berger, “Fast detection of scanning worm infections,” RAID, 2004. [19] M. V. Mahoney and P. K. Chan, “PHAD: Packet Header Anomaly Detection for Indentifying Hostile Network Traffic,” Technical Report, Florida Tech., CS-2001-4. [20] M. V. Mahoney, ”Network traffic anomaly detection
ACM SIGCOMM Computer Communication Review
[23]
[24]
[25]
[26]
[27]
[28]
[29]
[30]
[31]
[32]
[33]
[34] [35] [36]
based on packet bytes,” ACM Symposium on Applied Computing, 2003. C. Estan and G. Varghese, “New Directions in Traffic Measurement and Accounting,” ACM SIGCOMM, 2002. N. Duffield, C. Lund, and M. Thorup, “Properties and Prediction of Flow Statistics from Sampled Packet Streams,” ACM IMW, 2002. P. Barford, J. Kline, D. Plonka, and A. Ron, “A Signal Analysis of Network Traffic Anomalies,” ACM IMW, 2002. J. Jung, V. Paxson, A. W. Berger, and H. Balakrishnan, “Fast portscan detection using sequential hypothesis testing,” IEEE Symp S&P, 2004. A. Sridharan, T. Ye, and S. Bhattacharyya, “Connection Port Scan Detection on the Backbone,” IPCC Malware Workshop, 2006. R. Pokrywka, “Reducing False Alarm Rate in Anomaly Detection with Layered Filtering,” ICCS, 2008. R. Perdisci, D. Ariu, P. Fogla, G. Giacinto, W. Lee, “McPAD: A multiple classifier system for accurate payload-based anomaly detection”, Computer Networks, 2009. L. Huang, X. Nguyen, M. Garofalakis, J. M. Hellerstein, M. I. Jordan, A. D. Joseph, N. Taft, “Communication-Efficient Online Detection of Network-Wide Anomalies,” IEEE Infocom, 2007. A. Kumar and J. Xu, “Sketch Guided Sampling-Using On-Line Estimates of Flow Size for Adaptive Data Collection,” IEEE INFOCOM, 2006. L. Yuan, C. Chuah, and P. Mohapatra, “ProgME: Towards Programmable Network MEasurement,” ACM SIGCOMM, 2007. V. Sekar, M. K. Reiter, W. Willinger, H. Zhang, R. R. Kompella, and D. G. Andersen, “CSAMP: A System for Network-Wide Flow Monitoring,” USENIX, 2008. A. Ramachandran, S. Seetharaman, and N. Feamster, “Fast monitoring of traffic subpopulations,” ACM IMC, 2008. DARPA Intrusion Detection Data Sets, http://www.ll.mit.edu/mission/communications/ ist/corpora/ideval/data/index.html. LBNL/ICSI Dataset, http://www.icir.org/ enterprise-tracing/download.html. Endpoint Dataset, http://www.wisnet.seecs.edu. pk/projects/ENS/DataSets.html. A. B. Ashfaq, M. J. Robert, A. Mumtaz, M. Q. Ali, A. Sajjad, and S. A. Khayam, “A Comparative Evaluation of Anomaly Detectors under Portscan Attacks,” RAID, 2008.
APPENDIX Proof of Lemma 1 Proof. The ratio of malicious packets in marked traffic is εM c =
(k) M |M (k) (k) pc +p c M |M M |B
pc
, while the ratio of malicious packets
in unmarked traffic is εM =
(k) pM |M (k) (k) pB|B +pM |M
. To prove that
security-aware sampling algorithm samples more malicious
15
Volume 40, Number 3, July 2010
packets than random sampling, we need to show that εM c is greater than εM . That is, we have to show that: (k)
(k)
(k)
(k−1) (k−1)
(k)
(k)
pB|B pM c|M > pM |M pM c|B .
(k−1)
pB|B
Proof of Corollary 1 Proof. Equation (1) can be written as: ³ ³ ´ ´ (k−1) (k−1) (k) (k) (k) fs(k) pd − pf pB|B pM |M 1 − fs(k) pf + ³ ´ ³ ´ (k) (k) (k−1) (k−1) (k) (k) (k−1) (k−1) pd − pf pd − fs(k) pf + pM pB|B pM c|M c|B pM c|M ³ ´ (k−1) (k−1) (k) (k) (k−1) (k−1) (k) (k) (k) +pM |M pM 1 − pf fs(k) pd + pM |M pM c|B c|B fs pf pf
³
´ ³ ´i (k) (k−1) (k) 1 − fs(k) pf + pM 1 − pf × c|B h i (k−1) (k) (k−1) (k) (k) pM c|M pd + pM |M fs pd Q
h
(k−1)
pM |M
>>
³
´ ³ ´i (k) (k−1) (k) 1 − fs(k) pf + pM 1 − pd × c|M i h (k−1) (k) (k) (k−1) (k) pM c|B pf + pB|B fs pf
(k−1) (k−1) (k) pM |M pM c|B pf .
(2) All the terms in the above equation are positive as long as (k) (k) pd ≥ pf . The term at the right side of the above equation is smaller than the second term at the left side which implies that the left side is much greater than the right side. By taking only the second term from the left side, we get ´ ³ (k) (k−1) (k−1) (k) (k−1) (k−1) (k) > pM |M pM pB|B pM pd − fs(k) pf c|B pf , c|M
³ ´ ³ ´ (k−1) (k−1) (k) (k) (k) ⇒ pB|B pM |M 1 − fs(k) pf fs(k) pd − pf + ³ ´ ³ ´ (k−1) (k−1) (k) (k) (k−1) (k−1) (k) (k) pB|B pM pd − fs(k) pf + pM pd − pf c|M c|B pM c|M (k−1) (k−1) pM |M pM c|B
Q ´
h³ 1−
(k) fs(k) pf
(k)
where the inequality holds as long as pd > pf and the benign traffic rate is higher than the malicious traffic rate.
Putting values from our system model shown in Fig. 2, we get h
(k−1) (k−1)
pB|B pM c|M ≥ pM |M pM c|B
³ ´ i (k) (k) (k) pf − 1 − pf fs(k) pd
(k)
which is true if pd
(1)
satisfied when
(k) pd
≥
(k) (k)
− fs pf
(k)
≥ pf , a condition that is
(k) 2pf .
All the terms at the left hand side (LHS) of (1) are positive (> 0), while the term on the right hand side (RHS) may or may not be positive. Comparing the uncertain term on the RHS of equation (1) with a term on the LHS yields:
ACM SIGCOMM Computer Communication Review
16
Volume 40, Number 3, July 2010