David Gerónimo, Angel D. Sappa, Antonio López and Daniel Ponsa. Computer Vision Center and Universitat Aut`onoma de Barcelona, Spain. {dgeronimo ...
PEDESTRIAN DETECTION USING ADABOOST LEARNING OF FEATURES AND VEHICLE PITCH ESTIMATION David Ger´onimo, Angel D. Sappa, Antonio L´opez and Daniel Ponsa Computer Vision Center and Universitat Aut`onoma de Barcelona, Spain {dgeronimo,asappa,antonio,daniel}@cvc.uab.es ABSTRACT In this paper we propose a combination of different Haar filter sets and Edge Orientation Histograms (EOH) in order to learn a model for pedestrian detection. As we will show, with the addition of EOH we obtain better ROCs than using Haar filters alone. Hence, a model consisting of discriminant features, selected by AdaBoost, is applied at pedestrian-sized image windows in order to perform the classification. Additionally, taking into account the final application, a driver assistance system with realtime requirements, we propose a novel stereo-based camera pitch estimation to reduce the number of explored windows. With this approach, the system can work in urban roads, as will be illustrated by current results.
In this context, pedestrian detection is one of the most challenging problems: (1) pedestrians are non-rigid and aspect-changing objects; (2) pedestrian detection makes sense mainly in urban areas where, on the contrary to scenarios as highways, a high number of different clutter objects and backgrounds are present, sometimes leading to situations where the pedestrian is partially occluded. The high relevance of pedestrian detection has attracted the attention of many researchers in the last decade. For instance, in [2], a system based on a stereo pair is presented: a depth map is generated and 3D regions where a pedestrian could fit are identified. Maximum/minimum pedestrian sizes are assumed as well as the ground plane location with appropriate tolerances, all depending on the depth. Next, pedestrian classification is performed in the 2D windows corresponding to the selected 3D regions. The classification is done by a hierarchical template matching (coarse-to-fine) based on Chamfer distance (which needs edge detection [1]), followed by a texture classification done by a neural network and a final stereo verification of the shape template. Tracking is also incorporated to discard spurious detections. The system is able to give the distance to the pedestrians, which is essential to know the more appropriate action to take in the vehicle (do nothing, warn, break down and deploy external airbags, etc.) In [4, 5] the proposed system only considers a limited number of image windows assuming a flat road and a feasible pedestrian range of sizes, then vertical symmetry based on grey-level and horizontal gradient is used to classify the windows as possible pedestrians. However, since there are many sources of vertical symmetry, a posterior stereo refinement technique and other filters (no more detail is given) are applied to reduce the number of false positives. Besides the stereo refinement helps to better localize the feet of the pedestrians, thus, their distance to the camera. Temporal coherence and prediction capabilities are also added by tracking the pedestrians. Focusing in the pedestrian classification (given an image window), a widespread consensus is around the use of example-based learning techniques based on generic image features. For instance, [8, 9] use support vector machines (SVM) to learn a pedestrian model based on Haar wavelets. In [10] the authors make use of the AdaBoost algorithm in order to learn a cascade of classifiers based on spatiotemporal Haar wavelets (the images come from a stationary camera). In [11], a recognition-by-components approach is
KEY WORDS ADAS, pedestrian detection, adaboost learning, pitch estimation, haar wavelets, edge orientation histograms.
1 Introduction A main challenge of automotive industry is to develop low cost advanced driver assistance systems (ADAS) able to increase traffic safety. In this context we focus our work on the field of pedestrian detection, which is of high relevance taking into account that pedestrian-vehicle accidents are the second source of automotive fatalities worldwide. ADAS applications can be based on active sensors like radar or lidar, but also on passive ones such as cameras operating either in the visible spectrum or in the far infrared (FIR) one. For pedestrian detection, passive-vision-based approaches are quite promising [1, 2, 3, 4, 5, 6], either to work alone or to fuse with active sensors [7]. Common difficulties for on-board vision systems arise from dealing with a mobile platform in an outdoor scenario, this is, variability is present everywhere: images are acquired by a moving camera, and contain objects with unknown movement placed at different distances in front of a background that continuously changes both in content and spectral conditions. Hence, computer vision algorithms must detect, recognize and track objects of interest with a potentially high intra-class variability, seen from different angles, sizes, and different illumination/temperature conditions. Moreover, real-time requirements usually go from 5Hz to 25Hz, which is very challenging given the degree of complexity needed to address such high variability.
541-162
400
also based on Haar wavelets and SVM learning, where the components are relevant body parts (head, legs, arms). In [6] the classification is based on two SVM, one for detecting pedestrians in front/rear views and the other for side views, in both cases also using the gradient magnitude of the image as pedestrian features. In [3] the authors use recognition-by-components too (thirteen predefined overlapping regions), as well as different training for different poses, articulations and illumination conditions. The scale invariant feature transform (SIFT) is used as image feature and AdaBoost as learning technique. In [12] the classification is based on a neural network that uses the gradient magnitude of the image as pedestrian features. In order to reduce the number of windows where looking for pedestrians, [12] and [6] propose stereo and constrains on the range of feasible pedestrian sizes, while [3] proposes an attention mechanism based on texture, perspective constraints and size of the candidate pedestrians. From this short review we see that in the core of the different approaches there is an algorithm (pedestrian classifier) such that, given an image window that approximately fits the size of a pedestrian, classifies that window as containing a pedestrian or not according to the appearance of the window’s content. Of course, with a very high computational power we could just scan a whole image so that at least one window has its origin at every image pixel. However, nowadays this is fully prohibitive if we want to reach real-time. Hence, strategies to reduce the number of windows to examine are mandatory: a sort of background removing together with different geometric constraints. Finally, since we can have some false positives or multiple detections from the same pedestrian, temporal coherence must be added by a pedestrian tracker which can be also useful as predictor from one frame to the next. The work presented in this paper mainly addresses the pedestrian classification from images of the visible spectrum. More specifically, we focus our study on the features that will be used to build the pedestrian classifier. The outline of this paper is as follows. Section 2 presents two new feature sets, with proven efficiency in face detection [13, 14], that are combined to obtain the classifier: extended Haar wavelets and edge orientation histograms. As other authors, we rely on AdaBoost as learning technique. In Section 3 we outline a method to reduce the number of pedestrian candidate windows. It is based on perspective constraints and the range of possible pedestrian sizes. To apply these restrictions the camera’s pitch and height must be known, however, these parameters are continuously changing for a number of reasons. Other works also suggest the use of such restrictions, however, they do not always compute dynamically the pitch and height of the camera. Here, we propose a stereo-based method for dynamically computing the camera’s pitch and height. In this way, the system is open to incorporate free-space analysis in the future with the aim of even reducing more the number of pedestrian candidate windows. Section 4 presents experimental results. In particular, we show how the combina-
tion of Haar wavelets and edge orientation histograms improves the classification performance of using both types of features separately. Notice that in the mentioned literature on pedestrian detection the proposed classifiers either use some kind of gradient information or Haar wavelets, but not both of them. Besides, the presented results are based on windows that come from the camera’s pitch and height estimation on image sequences taken downtown from a car in movement, therefore, when accounting for false positives we do not include easy cases like windows in the sky (that would artificially improve any false positive metric). Finally, Section 5 summarizes the conclusions and outlines further improvements.
2 Pedestrian Classifier 2.1
AdaBoost Learning
From the different boosting proposals, we use Real AdaBoost [15] as learning method for obtaining a pedestrian model from a set of examples and counter-examples. The key idea is to build a (strong) classifier by combining the response of a set of simple (weak) classifiers, improving the performance that a complex classifier alone would have. In our case, the learning samples for AdaBoost consist of features computed at given image rectangular regions (windows). This is, we start by selecting windows in our sequences and labeling them as pedestrians (p) or non-pedestrians (np). The windows are chosen following the same image sampling procedure (Section 3) that will be used by the system when working in real-time. Once we have a complete set of n l labeled windows, feature values are calculated for each of them. Hence, F i = {f1 , ..., fnf } contains the nf values of a fixed feature set over a window i. Now the algorithm’s input consists in the set F = {(F1 , l1 ), ..., (Fnl , lnl )}, where label li ∈{p, np} indicates if window i is a pedestrian or not. Next, in an iterative manner, AdaBoost chooses the rule rj that best classifies the windows in the set. Rule rj is defined as rj (F ) = {fj , tj , sj , absj , conf ⊕, conf �}, where fj ∈F is the used feature, t j is the threshold that makes an optimal separation between the two classes, s j is a sign saying if pedestrian windows are above or below tj , absj indicates whether the threshold must be applied to fj or to ||fj ||, and conf denotes the confidence of the result when classifying a window as positive or negative. This rule’s response will be a positive real value, conf ⊕, in case of a pedestrian or a negative real value, conf �, in case of a non-pedestrian. In the algorithm, each window has a weight depending on prior classifications; this value is increased in case it has been missclassified by previous rules. Hence, at each iteration, the algorithm focuses its efforts on previous missclassified windows. Finally, the (strong) classification rule �n�f rj (F ), where for n�f features, n�f ≤nf , is DR(F ) = j=1 the sign of DR provides the classification decision (pedes-
401
(a)
(b)
(c)
(d)
(e)
(f)
(g)
(h)
Original sample
Edges modulus
k0
w
h
R
Edge bins (K=4)
[-ʌ/8, ʌ/8]
k1
(ʌ/8, 3ʌ/8] Feature value
(x,y)
k2
(3ʌ/8, 5ʌ/8]
FEOH (R )
Sum Sum
k3
(5ʌ/8, 7ʌ/8] Image Region
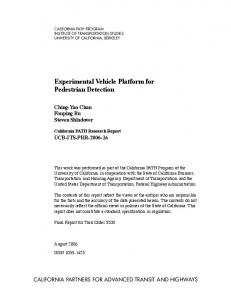
Figure 1. Haar filters. Left: Example of a filter with parameters (x, y, w, h, (a), 0 ◦ , R). Top-right: Basic forms of the Extended Haar set. Bottom-right: Examples of filters that give high response in regions containing pedestrians.
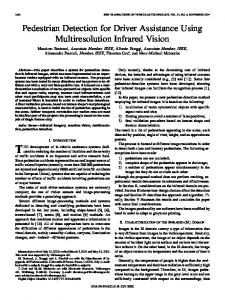
Figure 2. EOH features. The feature is defined as the relation between two orientations of a region. In this case, vertical orientations are dominant with respect to the diagonal orientations (k 3 ), so the feature will have a high value.
trian if positive, negative otherwise), and its absolute value the confidence of that decision. In fact, the learning process could continue until constructing a cascade of classification rules (as in [16] for face detection), where the first layer discards clear nonpedestrians, the second layer would discard less clear nonpedestrians and so on, being pedestrians those windows that are not rejected at any layer. However, in this paper we are more interested in showing that the combination of Haar wavelets and edge orientation histograms leads to better results that each one on its own. This will be shown by a receiver operating characteristic (ROC) curve and such curve is easily generated if we only consider one layer. Thus, in this paper we only present results based on training a single layer with the Real AdaBoost algorithm.
2.2 2.2.1
pixels, which in our acquisition system corresponds to a standard pedestrian at about 50m (see Section 3). Originally, [8] presents three basic templates (filters (a)(b)(c) in Fig.1) defining an overcomplete set covering the whole image region. Posteriorly, Viola and Jones add filters (d) and (e) to the previous set in order to achieve face detection [16] and pedestrian detection using a static camera [10], this set is referred in this paper as Simple Haar set. In our work, new filters from (a) to (h) and their 45 ◦ rotation are added to the simple set, coming to use the Extended Haar set described in [13] to detect faces.
2.2.2
Edge Orientation Histograms
When looking at pedestrian images, one realises that silhouette, and edge information in general, can be also an important cue apart from intensity differences between specific internal regions. In the face detection problem, Levi and Weiss [14] propose another set of features based on edge information, which not only maintains invariance to global illumination changes, but also is able to extract information usually difficult to capture with Haar filters. We expect that the richness of contour information in our images makes these features even more useful for our problem, due to the high variability of pose and texture of our targets. Thus, we propose their use to detect pedestrians. Features are computed as follows (see Fig. 2). First, a Sobel mask is applied to the image in order to calculate the edge orientation. In our case, we have used an adaptive threshold that depends on the variance of the image, since imposing a fixed one could supress interesting data. Then, Sobel image pixels are classified according to its edge orientation into K (in our case K = 4) images corresponding to K predefined orientation ranges (also referred as orientation bins). Therefore, a pixel in bin k n ∈K contains its gradient magnitude if its orientation is inside k n ’s range, otherwise is null. Integral images are now used to store the accumulation image of each of the edge bins. Finally, the feature value is defined as the relation between two orientations, k1 and k2 , of region R as:
Model Features Haar Wavelets
Haar wavelet templates are introduced in [8] to detect pedestrians using a static camera. A feature of this set is defined as the difference of illumination between two defined areas (white and black, see Fig.1 left). Here, the integral image representation [16] is used to store the accumulated intensity of a certain area, so summed values of a certain region, Ek (R), can be computed efficiently by only four accesses to that integral image. The feature value is then: FeatureHaar (x, y, w, h, type, α, R) = Ewhite (R) − Eblack (R) , where x, y is the bottom-left position of the given image region; w, h represent rectangle’s width and height; type is one of the configurations listed in Fig. 1 top-right, and α ∈ {0◦ , 45◦ }. The value of this difference can be thresholded to be used as a weak hypothesis in our learning algorithm. Due to perspective, the windows framing a pedestrian can have different sizes, so normalization is required to establish an equivalence between the features computed in each window. To achieve that, features are computed following the proposal in [16], obtaining results equivalent to normalizing examples’ aspect ratio to fit an area of 12×24
FeatureEOH (x, y, w, h, k1 , k2 , R) =
402
Ek1 (R)+� Ek2 (R)+�
,
(a)
(b)
(c)
(d)
Figure 3. Searching windows and 3D grid for user-defined vanishing lines (a, b, c) and automatically computed by [18] (d). If this value is above a given threshold, it can be said that orientation k1 is dominant to orientation k 2 for R, which can be exploited as a weak hypothesis too. The small value � is added to the factors for smoothing purposes.
urban scenarios. Other works, like the pedestrian detector system described in [4], use a constant pitch/height approach in urban scenarios, which is not a realistic assumption since camera pose is continuously modified. We propose to use a stereo system for computing the ground position and camera extrinsic parameters at each frame so that search windows are properly adjusted. In our case, following the proposal in [17], a 3D grid using intervals of 0.5m in both X, Z axes is projected on the 2D image plane, but now it is dynamically adjusted. The proposed technique consists of two stages. Initially, the original 3D data points extracted from the stereo pair (XY Z space) are mapped into a 2D space (Y Z plane). Then, noisy data are filtered and a RANSAC based least squares fitting is used to estimate the current road plane parameters; at the same time camera’s position and orientation are directly computed, referred to that plane. Independently of the road geometry, the provided results could be understood as a piecewise planar approximation, due to the fact that road and camera parameters are continuously computed and updated (see [18] for more details). Fig. 3 illustrates the importance of having the right estimation of camera’s position and orientation. Note that every pitch angle has a corresponding vanishing line, namely horizon, since any ground point at infinite distance lays on this 2D image line. Thus, searching windows can be computed by using the vanishing line value as input information. The first three image pairs show the projected 3D grid and some search windows (just some illustrative examples are highlighted) when a fixed vanishing line is assumed. Notice the problems to fix a correct horizon to cope with all the possible road orientations. On the contrary, (d) images present the grid and nearest windows by automatically computing the vanishing line with the proposed technique. It can be appreciated that independently of the road geometry vanishing lines are correctly computed.
3 Search Optimization Once the system has been trained with the aforementioned feature sets, a pedestrian search process is ready to proceed over a given sequence of images.
3.1
Windows Generation
In our method, pedestrian size is similar to the assumed in [4]. This is, a pedestrian is defined as a person with height H = 1.70m and a width W = 0.85m, but we add a bigger margin to the width, so that the information of extended arms and walking legs is not lost. Additionally, a standard deviation σ = 0.1m must be assumed in order to cope with different sizes of pedestrians. Having this in mind, the natural approach to achieve detection is to apply this classifier on all the average pedestrian sized windows over an image. This brute-force scanning is used in several papers, for instance in [8]. Therefore, such an exhaustive method would consist in scanning the image with all the possible windows (from the smallest one —in our case previously defined as 12×14 pixels— until the biggest), always keeping the aspect ratio.
3.2
Stereo-Based Pitch Estimation
In order to speed up the whole process, some authors propose to restrict the searching area at image locations determined from a priori knowledge of the current ground plane. For instance, in [17], an initial calibration fixes a pitch angle, which will be used to determine the 2D image position of any road 3D point. Hence, a 3D grid, sampling the road plane, is projected on the 2D image. The projected grid nodes are used to define the bottom-left corners of searching windows. In that example, to cope with pitch and height variations, only a relatively small range of possible pitches and heights of the camera are explored since the addressed scenarios are highways where interframe car accelerations and road imperfections are in general much lower than in
4 Experimental Results The proposed technique has been tested on different urban environments, providing good performance in different illumination conditions and ground profiles. The vision system is composed by a Bumblebee (www.pointgrey.com) stereo camera, which consists of two color CCD sensors with 6mm focal lenses, forming a baseline of 12cm. The
403
1
Detection Rate
0.95
0.9
40m 0.85
Simple Haar Extended Haar Edge Orientation Histograms Simple Haar + EOH Extended Haar + EOH
0.8
0.75 0
0.5
1.0
1.5
2.0 2.5 3.0 False Positives (%)
3.5
4.0
4.5
20m
5.0
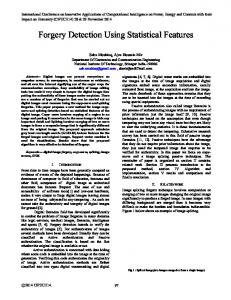
Figure 4. ROCs illustrate that EOH improve the results. images are of 640x480 pixels, and no downsampling is made. The camera settings are not specific for pedestrian detection since we want to base other ADAS applications on the same images. This means that computed stereo is set to work up to 50m while for pedestrian detection 30m would be a useful approach (with less computational cost). Since we have this 50m with stereo information we are currently trying to reach such distance. This means that we evaluate about 10,000 windows per image according to the grid we use (scanning just the half-bottom part of the image with the 10% of the possible sizes would require 10 6 ). Settings like shutter and gain are continuously adjusted by the camera to avoid saturation (this affects the contrast, which many times is not sufficiently good). The examples set consists of 1,000 hand-picked positive samples, i.e., pedestrians at different distance in real urban situations (see Fig. 5) and 5,000 negative samples including street furniture like benches, lamps, traffic lights and signs, and also trees, vehicles and any other region not fitting a pedestrian. Notice that examples are selected directly from the pedestrian sized grid windows, thus nonuseful windows above the horizon (e.g., containing sky) are not used in our experiments. Fig. 4 illustrates ROC curves for a classifier based in 100 weak hypothesis; i.e., 100 discriminatory features, learnt for each feature set. The curves correspond to the average of two experiments, each one with a random training and testing set. The most relevant conclusion is that, as we expected, the combination of two different feature sets provide better detection results with less false positives than using a single set. This is, EOH features provide enough complementary information to a Haar set, so detection results can be improved by using them together. On the other hand, to better clarify if Extended Haar features provide an appreciable improvement over the Simple set more experiments are needed because according to the current ROCs, for false positive ratios below the 1% the combination of EOH with Extended Haar features outperforms the combination with the Simple set, however, over the 1% such
10m Figure 5. Pedestrians at different distances (40, 20, 10m). improvement is not of the same relevance. Fig. 6 shows the system results in different situations using the classifier based on the combination of Simple Haar and EOH features for a false positive ratio of the 1%. Bounding boxes highlight windows with positive classification and horizontal lines correspond to the estimated horizon according to the automatically computed pitch. The current code, compiled with Visual C++ 6 with no specific software optimizations, runs at 2fps in a PIV 3.2GHz, broken down in the following timings: 50ms are gone in the stereo computation, 200ms to estimate the pitch, and about 250ms in the classification step.
5 Conclusion and Future Work We have presented a system for pedestrian detection in urban environments. The study of the feature sets performance made relevant that different Haar sets together with Edge Orientation Histograms improve the performance of the Simple Haar set alone when facing this problem. In addition, a stereo-based pitch-estimation technique allows us to determine the searching area as well as a sampling grid from where meaningful windows for applying the pedestrian classifier are obtained, thus, avoiding an exhaustive search on the whole image. As future work, we plan to improve the system by free-space analysis, cascade of classifiers, and removing redundant windows as well as spurious detections.
Acknowledgements: This work was supported by Spanish MEC grant BES-2005-8864 and project TRA2004-06702/AUT, and Ram´on y Cajal Program. 404
Figure 6. Pedestrian detection. Some examples showing detected pedestrians, including false positives not corresponding to our target. (Raw detection without any kind of post-processing, fixing the grid using the estimated pitch).
References
[9] C. Papageorgiou and T. Poggio. A trainable system for object detection. IJCV, 38(1), pp. 15–33, 2000.
[1] D.M. Gavrila. Pedestrian detection from a moving vehicle. ECCV, Dublin, Ireland, 2000.
[10] P. Viola, M.J. Jones and D. Snow. Detecting pedestrians using patterns of motion and appearance. IJCV, 63(2), pp. 153–161, 2005.
[2] D.M. Gavrila, J. Giebel and S. Munder. Vision-Based Pedestrian Detection: The PROTECTOR+ System. IVS, Parma, Italy, 2004.
[11] A. Mohan, C. Papageorgiou and T. Poggio. ExampleBase Object Detection in Images by Components. Trans. on PAMI, 23(4), pp. 349–361, 2001.
[3] A. Shashua, Y. Gdalyahu and G. Hayun. Pedestrian Detection for Driving Assistance Systems: Singleframe classification and System Level Performance. IVS, Parma, Italy, 2004.
[12] L. Zhao and C. Thorpe. Stereo and neural network based pedestrian detection. Trans. on ITS, 1(3), pp. 148–154, 2000.
[4] M. Bertozzi, R. Chapuis, F. Chausse, A. Fascioli and A. Tibaldi. Shape-based pedestrian detection and localization. ITS, Shangai, China, 2003.
[13] R. Lienhart and J. Maydt, An extended set of haar-like features for rapid object detection. ICIP, Rochester NY, USA, 2002.
[5] M. Bertozzi, A. Broggi, A. Fascioli, A. Tibaldi, R. Chapuis, F. Chausse. Pedestrian localization and tracking system with Kalman filtering. IVS, Parma, Italy, 2004.
[14] K. Levi and Y. Weiss. Learning object detection from a small number of examples: the importance of good features. CVPR, Washington DC, USA, 2004. [15] R. Schapire and Y. Singer. Improved boosting using confidence-rated predictions. J. of Machine Learning, 37(3), pp. 297–336, 1999.
[6] G. Grubb, A. Zelinsky, L. Nilsson, M. Rilbe. 3D Vision Sensing for Improved Pedestrian Safety. IVS, Parma, Italy, 2004.
[16] P. Viola and M. Jones. Rapid object detection using a boosted cascade of simple features. CVPR, Kauai, USA, 2001.
[7] M. Meinecke, M. A. Obojski, M. T¨ons and M. Dehesa. SAVE-U: First experiences with a pre-crash system for enhancing pedestrian safety. European Congress and Exhibition on Intelligent Transportation Systems and Services, Hanover, Germany, 2005.
[17] D. Ponsa, A. L´opez, F. Lumbreras, J. Serrat and T. Graf. 3D vehicle sensor based on monocular vision. ITS, Vienna, Austria, 2005.
[8] M. Oren, C. Papageorgiou, E. Osuna and T. Poggio, Pedestrian detection using wavelet templates. CVPR, Puerto Rico, 1997.
[18] A.D. Sappa, D. Ger´onimo, F. Dornaika and A. L´opez. Real time vehicle pose using on-board stereo-vision system. ICIAR, P´ovoa de Varzim, Portugal, 2006.
405