Performance Evaluation and Prediction for Legacy Information Systems Yan Jin1, Antony Tang1, Jun Han1, and Yan Liu2 1 Faculty of ICT, Swinburne University of Technology, Hawthorn, VIC 3122, Australia { yjin, atang, jhan}@ict.swin.edu.au 2 National ICT Australia (NICTA), NSW 1430, Australia
[email protected] Abstract Database-centric information systems are critical to the operations of large organisations. In particular, they often process a large amount of data with stringent performance requirements. Currently, however, there is a lack of systematic approaches to evaluating and predicting their performance when they are subject to an exorbitant growth of workload. In this paper, we introduce such a systematic approach that combines benchmarking, production system monitoring, and performance modelling (BMM) to address this issue. The approach helps the performance analyst to understand the system’s operating environment and quantify its performance characteristics under varying load conditions via monitoring and benchmarking. Based on such realistic measurements, modelling techniques are used to predict the system performance. Our experience of applying BMM to a real-world system demonstrates the capability of BMM in predicting the performance of existing and enhanced software architectures in planning for its capacity growth.
1. Introduction Large organisations often have database-centric legacy information systems that are core to the organisational information infrastructure. With ever changing business requirements, these systems need to evolve in order to remain useful. For example, a new legislation may require a utility company to collect and process the customers’ utilisation information more frequently, e.g., hourly instead of quarterly, and to keep the data online for an extended period of time e.g. 12 months instead of 3 months. Such requirement changes were often unanticipated in the original system design. Accommodating the new requirements often has a significant impact on system performance. On the other hand, developing a brand new system to deal with such changes could be risky and costly. Therefore, a way to
29th International Conference on Software Engineering (ICSE'07) 0-7695-2828-7/07 $20.00 © 2007
predict the performance of existing legacy systems and identify their potential bottlenecks would be most useful. One of the major difficulties in performance prediction for such a system is that in the future scenarios, the system may be overloaded in different ways, e.g., concerning the number of users, the amount of data to be processed, and/or the amount of data stored in the database. Such load changes will affect software performance adversely. A full-scale performance testing for the targeted load growth is often not possible due to factors such as hardware availability (e.g. disk space), software limitations (e.g. DBMS capacity), human resources, etc. Where the load growth is limited in magnitude, one may resort to limited benchmarking or stress testing of key applications for performance prediction. However, where the growth is exorbitant, it would be very difficult to test and estimate the performance of an existing application. A common practice is to extrapolate the performance behaviour based on observations of the benchmarking and production systems. This method, however, heavily relies on unverifiable assumptions, human experience and intuition. The accuracy of extrapolation is doubtful and thus the resulting capacity planning may be far from being realistic. An alternative to extrapolation is performance modelling that creates a mathematical model of the system, e.g., using Markov chains or queuing networks, to predict the future system performance. There are many modelling methods, such as [5, 6, 10, 15, 18, 19]. They, however, are primarily developed to predict the performance of new systems at early stages of design. They are not adequate for enhancing systems that are already in production. To make use of them, one needs to understand and quantify the system’s actual performance characteristics and operating environment. One also needs to ensure that model assumptions are valid in the real system (e.g., the exponential distribu-
tion of service time), and quantify model parameters that may vary as the system evolves (e.g., disk service demand as in increased database size). All these have not been adequately addressed previously. In this paper, we introduce an approach to performance evaluation and prediction for legacy information systems when they are subject to dramatic increases in workload and database loading. The approach combines the use of benchmarking, production system monitoring, and performance modelling (thus named BMM). The first two tasks characterise the system and the operating environment, and provide realistic inputs to the modelling. An example input is the relationship between application activities and the hardware resource consumption at different workload levels. The modelling task builds on the statistical analysis of the measurements, and makes use of the existing performance modelling methods to construct analytical or simulation models of the system to carry out performance prediction. We have applied this approach to a real-world system, the workload of which is subject to increase by as much as around 4000 times over the next seven years. It has allowed us to determine when the existing system would be out of processing capacity, and to predict the expected loading.
2. Background In this section, we first highlight the problems in performance prediction for legacy information systems that face an exorbitant load growth. We then evaluate the two major prediction approaches, and point out the need for a new methodology that integrates them.
2.1. The problem Information systems may sometimes encounter a dramatic increase of processing volume, which can significantly affect their performance. In our case, an electricity distribution company has faced such a problem when new government regulations dictate that it has to process 4320 data points instead of one data point each quarter for most of its electricity meters. As the transaction volume grows, the management is concerned about (1) to what extent the current production system can cope with the load increase without severe performance degradation, and (2) assuming certain load growth rates, by when system enhancements have to be made, including major hardware upgrades or software enhancements. In such cases, a number of issues hinder the prediction of system performance: • The production system cannot be used for stress testing as such tests might disrupt normal operation.
29th International Conference on Software Engineering (ICSE'07) 0-7695-2828-7/07 $20.00 © 2007
• It is often not possible for a benchmarking system to reproduce the load in the production system. • There is often insufficient hardware equipment to benchmark an application system with the dramatically increased workload. • It is difficult to model the internal workings of third-party COTS such as DBMS for performance analysis. As a result, the lack of accurate estimates for the performance and scalability of an application system makes it most difficult to ascertain the service level performance, capacity planning and budgeting.
2.2. Performance testing It is a common practice in the industry to use stress testing to measure the end-to-end performance and scalability characteristics of an application. This requires the availability of key application programs, target system loads and necessary hardware. This approach has many successful cases, e.g. those in [2, 8], and commercial tool support, such as in Mercury LoadRunner and Segue SilkPerformer. However, it has a number of disadvantages: • Large-scale benchmarking requires expertise support which can be expensive and difficult to get. • The setting-up of the benchmarking environment as well as repeatedly executing test cases can run for an extended period of time, and consume a large amount of computing and human resources. This can be expensive and time-consuming. • The test results in the benchmarking environment may not directly reflect the performance of the production environment because the former is often smaller in scale than the latter. In cases where stress testing cannot fully simulate the production environment, extrapolation based on the testing results is often used to estimate the system performance. The extrapolation assumes that the performance of an application and its resource utilisation is a projection of the obtained measurements. This is a very simplistic model and thus can be inaccurate. In reality resources utilisation often depends on a multitude of factors that behave differently as the mix of workload changes. As such, a simple extrapolation model would be insufficient in predicting system performance.
2.3. Performance modelling and simulation For performance evaluation and prediction of computer systems, researchers have proposed many methods based on well established modelling theories, e.g., Markov chains and queueing networks. These methods have been integrated with the software development
process [11]. The majority of such research efforts have been dedicated to supporting performance engineering practice early in the development process, especially at the architecture design level [17]. The aim is to equip software engineers with mathematicallyproven performance analysis techniques in evaluating alternative architecture designs and making rationalised architecture decisions. Research along this line is referred to as Software Performance Engineering (SPE) by Smith and Williams [14, 16]. Example work includes [5, 6, 10, 15, 18, 19]. When applied to legacy systems, however, the existing SPE methods face challenges that need to be effectively addressed: • How to obtain realistic inputs to the model and validate assumptions when the system already operates in production. Measuring model parameters in the existing system is essential to achieve accurate predictions. Experience-based estimates of parameter values as assumed in existing SPE methods cannot meet this requirement. • How to characterise the real system load in a resource-sharing production environment. For instance, the target system performance can be adversely affected by the database sharing and hardware usage of applications that are outside the targeted scope of performance analysis. • How to cater for variations of model parameters due to changes of load conditions. For example, as the database increases in size, the service demands for hardware resources such as CPU and DB devices will likely increase due to the larger volume of data to be retrieved. Methods have been proposed to evaluate the performance of legacy systems. da Silva et al. devised in [4] a simulation model that uses synthetic workload to evaluate the performance impact of migrating a legacy system. This method requires more detailed information about how and where transactions are generated, processed and completed than SPE methods. Such information may be difficult to obtain through documentation or reverse engineering, especially for systems comprising third-party components. In the two methods investigated by [9], subjective estimates are used for performance prediction of legacy systems. The estimates are provided by experts based on their experience and knowledge of earlier versions of the system. Accurate model-based prediction for a legacy system requires realistic information about the system and its operation environment. This information can be obtained from the production environment and benchmarking. The need for complementary use of perform-
29th International Conference on Software Engineering (ICSE'07) 0-7695-2828-7/07 $20.00 © 2007
ance modelling and testing/benchmarking has been recognised by [3], which combined these two approaches in performance diagnosis and tuning of a large e-commerce application. To the best of our knowledge, there exists no systematic approach to performance evaluation and prediction of legacy systems that are subject to exorbitant load growth.
3. The BMM approach In this section, we introduce a performance evaluation and prediction approach called BMM that combines benchmarking, production system monitoring, and performance modelling.
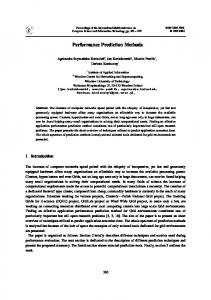
Figure 1. Overview of BMM
In Figure 1, we present an overview of the BMM method, highlighting the key tasks and the information flow between them. Scoping and planning defines the scope of performance study. Production system monitoring evaluates and analyses the behaviour of the system in the production environment. Benchmarking tests the system at various load conditions. The monitoring and benchmarking activities not only gather realistic measurements but also help gain insights into the system performance characteristics. Data analysis and correlation collates data gathered from the monitoring and benchmarking activities for modelling purposes. It validates production and benchmarking measurements to remove and normalise any data peculiarity. The iteration between baseline validation and modelling helps refine the performance model towards more accurate prediction. In the following sections, we describe each task in detail, including its purpose, its interfaces to others, and its roles for achieving the overall objectives of performance evaluation and prediction.
3.1. Scoping and planning To define the scope of system performance prediction, we first need to identify the performance metrics of concern (e.g., response time and transaction throughput), and quantify existing and future workload and database loading (e.g., growth rates). Based on the system architecture design, we then identify the appli-
cation or business processes that are sensitive to the load growth, and clarify their interfaces with the rest of the system. We also need to identify the factors that will affect the applications’ performance, e.g., database size, database configurations, application-specific database access pattern. These factors will be used for benchmarking design. In planning for the performance prediction, we need to select an appropriate performance evaluation method (e.g., analytic model or simulation based). The selection is a trade-off between a number of factors such as complexity and costs (in terms of time and money), modelling capabilities, prediction accuracy, model solving complexity, and complexity of acquiring input data. The planning is done up-front because special data may need to be collected in the production monitoring/benchmarking stages to testify and validate model assumptions in particular evaluation methods. The elementary work-units to model have to be planned early to determine what to measure in the production and benchmarking activities.
3.2. Production system monitoring This task helps characterise the current system performance, and understand its activities and their relationship with the system resources utilisation. Monitoring focuses on gathering information from two sources: application activities and resources consumption of the system. First, we monitor the application processes that are sensitive to the load growth continuously over a period of time. Three areas of their activities are recorded: transaction volume and throughput, database activities, such as the number of inserts into a particular table per second, and CPU seconds consumed by the processes. In addition, we monitor the system resources consumption to obtain a pattern of resource utilisation against the activities performed by the applications. Five types of information need to be gathered: disk I/O activities, CPU utilisation, memory utilisation, network activities, and process activities. By monitoring the applications, we can identify the data arrival pattern and the workload pattern of the applications, including the processing flow and the throughput of each step of the application. A relationship can be established between the application activities such as transaction throughput and the system resources consumption such as disk utilisation. This will provide some insights into how system resources are related to application workload. The limitation is that it only provides a partial explanation of the resources consumption because resources are shared by multiple processes, and the resource consumption patterns of individual processes cannot be isolated.
29th International Conference on Software Engineering (ICSE'07) 0-7695-2828-7/07 $20.00 © 2007
3.3. Benchmarking Application-specific benchmarking is very important for they provide useful information that characterises the underlying system [13]. The objective is to test the application in a controlled environment to collect measurements for various load and configuration settings. Benchmarking involves six major activities. (1) We select, for benchmarking, the application processes which are affected by the anticipated load growth. (2) We decide on different load levels to benchmark in order to measure resource utilisation in relation to workload increases. (3) We select the platforms to use in benchmarking. This is to have a platform and processing capacity that closely resemble the target system if possible. (4) If it is expected that the current software architecture is not able to handle the increased workload, an enhanced software architecture should be proposed for benchmarking as well. This is important because adding more hardware resources without any software architecture enhancements may not be able to solve the performance scalability problem, especially when the load growth is extremely high. (5) The average processing time to complete a transaction and its sub-operations such as inserts and updates should be measured. (6) If application processes run in parallel, benchmark individual processes in isolation and in parallel to measure the effect of multi-processing. During benchmarking, resources consumption such as CPU time and disk I/O of individual scenarios are measured. Thus, changes in the workload and its effect on transaction throughputs and resources consumption can be estimated. The behaviour and potential bottlenecks of the application system may also be better understood through benchmarking.
3.4. Data analysis and correlation In this task, we collate the collected data to understand the performance characteristics of the system in both the production and benchmarking environments. We also prepare the input data for modelling, baseline validation, and prediction. The activities of data analysis and correlation centre around three areas: production measurements analysis, benchmarking measurements analysis, and data correlation. The first area involves three major activities. First, we analyse the operations of key applications and quantify the workload relationship between applications, such as workload ratios. Second, we quantify the performance metrics of the key applications and also their hardware resource consumption when possible. Third, we quantify the interference from the other applications or systems in the production environment,
in terms of hardware resource consumption and software resource competition via, e.g., semaphore, database locks and caches. Benchmarking data analysis involves two key activities. We quantify the resource demands (e.g., for CPU, disk, network, database, etc) and performance metrics of applications for the benchmarked scenarios of different load levels and system settings. If external interference exists in certain resource consumption during benchmarking, e.g., a database device, such interference has to be compensated for. Based on the above, we work out the trend or function of hardware resource consumption with respect to workload, database loading, application concurrency, etc. Data correlation involves three major activities. First, we validate/correlate application performance characteristics between production system monitoring and benchmarking measurements, e.g., application resource consumption and performance metrics. This is important to identify peculiar data collected from production monitoring and benchmarking. For instance, a spike in disk I/O that cannot be related to workload increase or otherwise explained cannot be used as a valid observation. Second, in correlating the data, we determine the strategies to assign resources demands of elementary work-units in the model under different scenarios with respect to load, system configurations, interference from the rest of the system, etc. This serves as a basis to populate/calibrate the model built in the modelling task. Third, we use the measurements to empirically validate the model assumptions of the chosen modelling method, e.g., the exponential distribution of service time.
3.5. Modelling We can now build a model that represents the system at a sufficient level of abstraction for performance study. This task involves seven major activities. (1) We revisit the performance issues to be studied, and define precisely the performance requirements. This is guided by the insight into system performance characteristics obtained through the earlier tasks. (2) We identify, apart from the architecture, the system characteristics that must be faithfully represented in the model, e.g., task scheduling and the communication paradigm. (3) We determine the system/application characteristics that are not affected by the load increase, and build them in the model. Examples are the system architecture, the inter-application workload ratios, etc. (4) We determine the characteristics that change significantly with the exorbitant load growth. Examples may be workload intensity, database size, resource demands, transaction throughput, etc. We then quantify these characteristics, and identify variables that are
29th International Conference on Software Engineering (ICSE'07) 0-7695-2828-7/07 $20.00 © 2007
direct inputs to the model, e.g., service demand on disk I/O, and variables that are not direct inputs but have impact on the input variables, e.g., database size. (5) With this information, we model the internal workings of key applications whose performance degrades significantly, and the inter-application interactions (including the synchronous/asynchronous communication paradigm and interaction pattern). The modelling of the rest of the system can be done in a more coarsegrained manner (e.g., using a black-box view), to avoid unnecessary model complexity. (6) We define scenario specifications for both baseline validation and prediction. Each scenario specifies the values of the input variables. A benchmarked scenario also includes the measured performance metrics. (7) We clarify the model-specific parameters, e.g., cache hit ratio and external interference, for sensitivity analysis that is carried out in model validation and prediction.
3.6. Baseline validation To establish a level of confidence that the model predicts accurately, we validate it against production and benchmarking measurements for the observed load scenarios. Basically, for each scenario, we populate the model with the parameters determined in the modelling task about workload, resource service demand, etc. We then evaluate the model by model solving or discreteevent simulation, and validate the predicted performance metrics against the previously obtained performance metrics. If the error margin is unacceptable, we refine the model to align with the real-world observations. In addition, we conduct sensitivity analysis to find out how sensitive the prediction is with respect to certain modelling choices. If it is considered too sensitive to a factor, e.g., cache hit ratio, we improve its accuracy by re-analysis or re-measuring. Or we treat this as a limitation when interpreting model predictions.
3.7. Prediction When sufficient confidence about the model is achieved, we can now use it to predict the system performance for future load scenarios that are beyond the reach of the currently available hardware resources. For each such scenario, we populate the model using the previously determined values for model parameters such as workload and service demand. We then obtain predictions through model solving or simulation, depending on the chosen modelling technique. We also conduct sensitivity analysis against certain factors built into the model, to see if the predictions are still sensitive to their values. If so, we clearly state the dependency as an assumption for the prediction.
Furthermore, we conduct what-if analysis by building into the model system enhancement options or different system settings, e.g., additional CPUs, and evaluating the impact on system performance. To avoid such predictions being misinterpreted, we explicitly state the assumptions for model changes.
3.8. Implementing BMM Performance prediction for legacy information systems is a complex task, which requires the collaboration of different roles. The key personnel to implement BMM should include (1) application experts, who know the legacy system and its internal workings, (2) system experts, who know measurement techniques for operating systems and database management systems, and (3) performance analysts, who understand data analysis, modelling and simulation techniques. In terms of project scheduling, model construction can be carried out in parallel with production monitoring and benchmarking, which generally take more time and require collaboration of a larger variety of people. Model evaluation or simulation however cannot begin until inputs from the other two tasks are available.
4. Using BMM in an Industrial Case The project where we applied BMM concerns the performance of the Meter Data System (MDS) of Powercor Australia and CitiPower, the largest electricity distributors in Victoria, Australia. The MDS imports, validates, and aggregates electricity meter readings that are periodically collected for about 1 million commercial and residential customers. The current production system is capable of processing the volume of meter reading influx in 2005. However, due to a recent change in regulations, the data volume to be processed daily is to increase up to 4320 times per quarter over the coming 7 years for most of the electricity meters owned by the companies. For auditing purposes, it is also required that the meter data stay alive in the database for at least two years. As a result, it was anticipated that the system would not be able to finish the daily processing within the given time frame. In order to perform informed capacity planning, the management wanted to find out by when the current production system is unable to cope with the increased processing demand and examine possible system enhancements to cope with such increase.
4.1. System characteristics MDS runs on a SUN Solaris server with 16 processors and uses Oracle 10g database to manage meter data and a Storage Area Network (SAN) to provide disk space for the database. The current database con-
29th International Conference on Software Engineering (ICSE'07) 0-7695-2828-7/07 $20.00 © 2007
tains about 1.5 terabytes of data. The production system allows the performance monitoring based on available UNIX or oracle tools. Due to policy restrictions, however, it does not allow any instrumentation to the code of application software. Fortunately, the same hardware and software configurations as the production environment are available for benchmarking. The benchmarking is constrained by the available disk space, which only allows testing against the database size with one year growth (i.e., 4 times the size of 2005). The performance prediction task is further complicated by the fact that interference from other applications exists in both production and benchmarking environments, through CPU and database sharing.
4.2. Applying BMM To apply BMM, we teamed up with four application experts, one Solaris/Oracle administrator, and three performance analysts. We built a MySQL relational database to store production monitoring and benchmarking data as well as data analysis results. 4.2.1. Scoping and planning Apart from the growth of the workload, we expect the database grows by 17 times. We identified 13 MDS database applications that are sensitive to such load increase. The workflow between the applications is implemented by asynchronous Oracle messaging. For the 13 applications, the major concern is whether the system is able to process at least 74% of the daily data influx during nightly processing window. So the transaction throughput of the system during those hours was the major concern. The factors affecting the throughput include database size, concurrent database access, and cache hit ratio. We used two criteria in selecting a modelling method. First, owing to schedule constraints, we selected an existing proven method that requires less effort to set up. Second, the method must be capable of modelling both hardware and software contentions as well as the database-based inter-application workflow, so that we may obtain more detailed performance information over methods such as extrapolation. We chose Layered Queueing Networks (LQN) [19, 7, 12], and specify each MDS application as an elementary work-unit (or LQN task). They in turn use hardware resources and trigger other software tasks. The available LQN tools, such as lqns and lqsim [1] can make model evaluation easier and quicker. 4.2.2. Production system monitoring As stated, a key objective of this task was to understand the application workload in relation to the system resource consumption in the existing production envi-
ronment. We monitored the identified 13 applications for 14 days. We logged data arrival time and volume. We measured Oracle database activities using SQL trace. For each application, we have the transaction throughput and a dissection of its database activities.
Figure 2. Typical Daily CPU consumption
We monitored the resource consumptions at one minute interval using UNIX commands ps, iostat, mpstat and sar. The results enable us to accurately plot the resource consumption patterns of the system. This consumption pattern is then related to application activities. An example of the systems CPU consumption of a typical day is shown in Figure 2. Such relationship shows that the system uses a maximum around 800 CPU seconds (upper line in graph) per minute and the MDS applications in aggregate consume a significant portion of the CPU resources (lower line). The aggregate was obtained by summing the CPU seconds clocked by individual processes. The graph also indicates the hours when the system is fully utilised. When the CPU consumption pattern is mapped to the application workload, an approximate relationship between them is established. Disk I/O activities and memory utilization were also monitored but they could not be mapped to individual processes. This is because a disk device and the system memory are shared by all processes. Still they provide useful information because at the aggregate level, the application workload can be related to the resource consumption of the system. There are other types of activities on the MDS system. They include user interface activities, miscellaneous applications and maintenance tasks, etc. They contributed to the resources consumption, although they are independent of the workload increase. 4.2.3. Benchmarking The MDS benchmarking was designed to single out each application and test their behaviour under different load situation. In the case study, we used a benchmarking environment which was compatible in performance with the production system to support a consistent interpretation of measurements. A number of benchmarking scenarios are set-up to measure (a) single application process with current workload and with four times the current workload; (b)
29th International Conference on Software Engineering (ICSE'07) 0-7695-2828-7/07 $20.00 © 2007
single application process of an enhanced software architecture model with current workload and four times the current workload; (c) multi-application processes with current workload and with four times the current workload. The six scenarios enable us to measure the throughputs and their resource consumptions, and relate the performance behaviour between them. With this information, the workload increase of MDS applications and its effect on resources consumption can be measured and the effect of enhanced software architecture on performance can also be tested. For instance, Figure 3 shows the CPU utilisation of five concurrent application processes with existing workload for a benchmarking run. Each of the 5 processes is consuming as much as 60 CPU seconds per minute, indicating that they are CPU intensive and will make use of most of the CPU available. From this information, we understand that the throughput of the application process depends on the speed and availability of CPU resources on the system.
Figure 3. CPU utilisation for an example benchmark
The measurements of the transaction throughputs and the resources consumption are logged in the BMM database for analysis. The analysis related application process to resource utilisation under different load scenarios. Additionally, we logged Oracle activities and process timing in the BMM database to measure subtransaction throughput. This information allows us to understand the performance behaviour of the transaction activities in the multi-processing environment. 4.2.4. Data analysis and correlation Production data analysis. Using the BMM database, we analysed the total CPU, disk and memory resource utilizations with respect to all the running processes, including the 13 application processes and the other background processes. For CPU utilisation, we obtained details of CPU consumption of individual process in the system. For disk I/O, it is not possible to attribute its utilization to an application process. However, we can attribute their typical performance behaviour by using graphs and linear regression models. The obtained information includes: (1) The hours when the applications peak and slack; (2) The duration of the processing; (3) the CPU consumption of MDS applications. For instance, we observed that key application
processes are CPU bound and would consume as much available CPU seconds as they could get. Collectively, the entire application system, including Oracle shadow processes, on average would consume about 57% of the total CPU cycles; (4) Application process dependency. For instance, we observed through CPU usage the processing patterns of interrelated applications through their workflow. This information is collated for modelling; (5) The CPU consumption by all the other applications other than the 13 that we studied, for instance, use up to 83% of CPU cycles daily. Benchmarking data analysis. Using the benchmarking measurements, we established a number of metrics which were used for modelling. Firstly, we identified the transaction throughput and the resources consumption of an application when it was run singly and together with other applications. It allows us to isolate the performance interference when there are other concurrent applications running. With that, we were able to determine that key applications were CPU bound and as such an enhanced architecture model which supports concurrent processing could overcome this issue. We subsequently benchmarked the enhanced model to prove it. Secondly, we were able to identify the most resource-consuming applications at the current transaction level and four times the current transaction level. We observed that in a symmetric multiprocessing environment, the application can scale. There will be a constraint on the disk I/O bandwidth. It is at 35% utilisation when it is running four times the current workload and thus will require reorganisation as it scales. Finally, we found that only 5 of the 13 applications consume significantly more resources and their performance degrades much more rapidly with the workload increase. Data correlation. We correlated the resource demands of applications between production and benchmarking environments, if the production measurements are available. For this case study, we were able to compare the CPU demand of each application per meter read. We found most of the applications consume more CPU time in production. This may be due to the fact that more processes run in the production environment, about twice as many as in the benchmarking. This causes more frequent context switching of processes, which contributes to the higher CPU usage. For database devices that are shared with external systems, the demand to them in production is not quantifiable for individual applications. Therefore, only the aggregated device usage is compared between production and benchmarking environments. Not surprisingly, the device usage in production is much higher than in benchmarking due to the higher demand of database access by other applications in production. In validat-
29th International Conference on Software Engineering (ICSE'07) 0-7695-2828-7/07 $20.00 © 2007
ing LQN model assumptions, we found it is reasonable to use exponential distribution for both the application and disk service time, and geometric distribution for the number of disk I/O calls issued by the applications. 4.2.5. Modelling We modelled the MDS system as closed LQNs with customer population being the daily volume of meter reads influx. The final LQN model contains 21 processors, 105 tasks, and 185 task entries. For illustration purposes, Figure 4 shows a much simplified version of the LQN model with only 3 MDS applications and 1 disk device, omitting the controls for process scheduling, database locking, etc. eBgCPU [10] Z=[65,0]
mv90User [0,1e-005]
tBgCPU {100} (0 805000)
mv90User
eMV90 [3.12,1e-005]
UserP
tImport_mv90 (0 1.03) eCP [2.37,1e-005] tConvert_prn (0 1) eVI [11.02,1e-005] tVal_interval
(0.14 0)
(0.033 0)
(0.04 0)
CPU {16} e01vi [3.27]
e01cp [1.83]
e01mv90 [1.16]
td01 disk01
Figure 4. Simplified LQN model
Each of the 13 applications, e.g., convert_prn, is modelled as a LQN task (denoted by a parallelogram) that runs on a multi-server of 16 identical CPUs (denoted by a dotted box). Each task is associated with one or more named service/entry points (numbered with service time), e.g., eCP, for other tasks to invoke or pass on input data. The usage of 4 database SAN devices is represented by synchronous calls (drawn as directed arcs) to the LQN tasks representing the devices, e.g., td01. The number of device calls to process a meter data input is written on the arc. The effect of increased MDS database loading is captured by increasing service demands of the corresponding entry points on each device task according to benchmarking data analysis. Further, the asynchronous inter-applications workflow is implemented using the LQN send-no-reply mechanism and quantified with the inter-application workload ratios determined in production data analysis. For example, to import a meter data, eMV90 consumes 3.12ms CPU time and generates 0.04 synchronous calls to disk01 (via e01mv90). After the import, it
passes on asynchronously 1.03 work units to the convert_prn task. In addition, we used a number of software tasks to approximate the effects of database locks between different database processes and interference between applications (omitted in Figure 4). For the sake of simplicity, the other applications (beyond the13 MDS) are modelled as a number of identical background tasks (i.e., tBgCPU), which collectively consume 83% CPU and a certain percentage of database devices. 4.2.6. Baseline validation We validated the model in two ways. First, we used the measurements for the six benchmarking scenarios, which include 3 for sequential meter data processing and 3 for concurrent processing. We evaluated the model for each scenario using the LQN solver [1, 7]. After fine-tuning the model, a close approximation between the model predictions (e.g., transaction throughput, CPU and devices utilisation) and the actual system measurements was attained. For example, the deviation of throughput predictions from the benchmarking is within 8% for the 5 applications that have expected performance degradation. In addition, we performed validation against the production data. The predictions fall into the ranges of observed throughput. 4.2.7. Prediction We evaluated the model for the production environment under the expected load scenarios at each year between 2006 and 2012. Table 1 lists the predicted transaction throughput (i.e. transactions per second or tps) between 2006 and 2008 for the 5 key MDS applications (the other applications and years are not reported for the sake of brevity). Table 1. Predicted throughput for the current design convert_prn
2006
2007
2008
258
208
161
import_mv90
218
184
151
pop_intf
200
181
158
settle_interval
77
73
70
val_interval
71
71
75
The application for meter data validation, val_interval, is most time-consuming. Its throughput does not improve over the years (i.e., 71 tps), the increased data volume will therefore lengthen processing time and exceed the set processing window, and similarly for the settle_interval process. The throughputs for the other processes have reduced when transaction volume increases, but the time required to process them do not have an impact on the processing window
29th International Conference on Software Engineering (ICSE'07) 0-7695-2828-7/07 $20.00 © 2007
by 2008. To evaluate the possible improvements to the software architecture, we have changed the meter processing model from sequential to concurrent processing. This means that multiple process instances are started up for each of the 5 applications to process a shared pool of meter reads fed in from the external or the upstream applications. Table 2 shows the predicted throughput for this design. Compared to the existing 1 design, this design requires /5 of the processing time for meter data validation in 2007, and 1/4 of the time in 2008. This is nevertheless at the cost of delaying the other background applications running in the production environment. The delay is 10% of their running time in 2006, 18% in 2007, 32% in 2008, 59% in 2009, and 92% in 2010. The predictions led to a conclusion that, without major hardware upgrades to the production system, this design improvement may only work for a year or two. Table 2. Predicted throughput for the improved design 2006
2007
2008
2009
2010
convert_prn
614
441
300
204
158
import_mv90
589
459
359
408
396
pop_intf
780
555
389
273
214
settle_interval
305
249
198
153
132
val_interval
443
359
285
217
188
4.3. Summary and evaluation In the case study, we have verified the model against the benchmarking and production results. The results indicate that the prediction using this methodology is accurate within the measurable range. The eventual proof is to compare the performance prediction with the target workload running on the planned system platform, which was unattainable. Using BMM, we were able to identify key areas where performance of the system will bear the most impact. The information we collected from monitoring and benchmarking supported the analysis of resources consumption for modelling. The prediction results showed that the enhanced software architecture was more scalable than the existing architecture, and that it would be able to accommodate the load increase up till early 2008 on the current platform. After that the hardware will have to be upgraded and the application system be reconfigured to cope with further workload increases. The results of applying BMM helps the company to plan its IT expenditure without having to over capitalise on hardware purchase yet provide a satisfactory service level to its users.
5. Discussion and Conclusion Accurate performance evaluation and prediction for legacy information systems is critical to capacity planning when there is an exorbitant load growth to the system. This problem is difficult to resolve because neither benchmarking nor modelling techniques alone can provide a total solution. In this paper, we have presented the BMM approach, which combines mathematically based models with realistic performance measurements. Specifically, production monitoring and benchmarking help characterise the existing system and the operating environment empirically. It provides reliable data for model simulation and model assumptions validation. It models application resource consumption to provide a better foundation for prediction. This is an improvement over extrapolation methods because the relationship between resource consumptions and transaction volume are explicitly modelled. The BMM approach can guide performance prediction. However, its implementation relies on the expertise in application analysis, modelling and validation. An example is the identification and collection of the relevant application data. In this case, much time have been spent on identifying the relevant application processes and SQL statements to monitor and model. Furthermore, what can be measured and used in BMM can be subject to organisation policies, platform variations and tools availability. The verification of model predictions continues to be a challenge. We validated our predictions with the benchmarking results. Beyond the limits of available hardware, validation depends on what seems to be reasonable given the resources consumption, the transaction volume and the hardware configurations of the system. Although BMM worked well for this case study, it can be further enhanced with general criteria and guidelines for selecting specific performance evaluation techniques (e.g., LQN). Additional empirical study and experimentation with BMM would help in serving such a purpose.
References 1. LQN documentation. http://www.sce.carleton.ca/rads/lqn/ 2. A. Avritzer, J. Kondek, D. Liu, E.J. Weyuker. Software performance testing based on workload characterization. In Proc. Workshop on Software and Performance (WOSP), pp. 17-24, 2002. 3. A. Avritzer, E.J. Weyuker. The Role of Modeling in the Performance Testing of E-Commerce Applications. IEEE Trans. Software Eng. 30(12), pp. 1072-1083, 2004. 4. P.P. da Silva, A.H. Laender, P.B. Golgher. A Simulation Model for the Performance Evaluation when Migrating
29th International Conference on Software Engineering (ICSE'07) 0-7695-2828-7/07 $20.00 © 2007
5. 6. 7.
8. 9. 10. 11. 12. 13. 14. 15. 16.
17. 18. 19.
Legacy Systems. In Proc. European Conf. Software Maintenance and Reengineering (CSMR), pp. 210-215, 2001. A. D'Ambrogio. A model transformation framework for the automated building of performance models from UML models. In WOSP 2005, pp. 75-86. G. Denaro, A. Polini, W. Emmerich. Early performance testing of distributed software applications. In WOSP 2004, pp. 94-103. G. Franks, C.M. Woodside. Multiclass Multiservers with Deferred Operations in Layered Queueing Networks, with Software System Applications. In Proc. Workshop on Modeling, Analysis, and Simulation of Computer and Telecommunication Systems, pp. 239-248, 2004. E.M. Friedman. Measuring Performance in the Lab and Validating it in Production. In Proc. Int. Computer Measurement Group Conf. (CMG), pp. 129-148, 2005. M. Höst, E. Johansson. Performance Prediction Based on Knowledge of Prior Product Versions. In CSMR 2005, pp. 12-20. D.A. Menascé, V.A.F. Almeida, L.W. Dowdy. Performance by Design: Computer Capacity Planning by Example, Prentice Hall, 2004. R. Pooley. Software engineering and performance: a roadmap. In Proc. Int. Conf. Software Engineering (ICSE) - Future of SE Track, pp. 183-199, 2000. J.A. Rolia, K.C. Sevcik. The method of layers. IEEE Trans. Software Eng. 21(8):689–700, 1995. M. Seltzer, D. Krinsky, K. Smith, X. Zhang, The Case for Application-Specific Benchmarking. In Workshop on Hot Topics in Operating Systems, pp. 102-107, 1999. C.U. Smith, L.G. Williams. Best Practices for Software Performance Engineering. In CMG 2003, pp. 83-92. C.U. Smith, L.G. Williams. Performance Solutions: A Practical Guide to Creating Responsive, Scalable Software, Addison-Wesley, 2002. C.U. Smith, M. Woodside. Performance Validation at Early Stages of Software Development. In System Performance Evaluation: Methodologies and Applications, CRC Press, 1999. P. Utton, B. Hill. Performance Prediction: an Industry Perspective. In Proc. Int. Conf. Modelling Techniques and Tools, LNCS 1245, pp. 1-5, 1997. C.M. Woodside, D.C. Petriu, D.B. Petriu, H. Shen, T. Israr, J. Merseguer: Performance by Unified Model Analysis (PUMA). In WOSP 2005, pp. 1-12. C.M. Woodside, J.E. Neilson, D.C. Petriu, S. Majumdar: The Stochastic Rendezvous Network Model for Performance of Synchronous Client-Server-like Distributed Software. IEEE Trans. Computers 44(1): 20-34, 1995.