CONCURRENCY AND COMPUTATION: PRACTICE AND EXPERIENCE Concurrency Computat.: Pract. Exper. 2013; 25:918–931 Published online 14 June 2012 in Wiley Online Library (wileyonlinelibrary.com). DOI: 10.1002/cpe.2871
Performance metrics and auditing framework using application kernels for high-performance computer systems Thomas R. Furlani 1, * ,† , Matthew D. Jones 1 , Steven M. Gallo 1 , Andrew E. Bruno 1 , Charng-Da Lu 1 , Amin Ghadersohi 1 , Ryan J. Gentner 1 , Abani Patra 1 , Robert L. DeLeon 1 , Gregor von Laszewski 2 , Fugang Wang 2 and Ann Zimmerman 3 1 Center
for Computational Research, University at Buffalo, State University of New York, 701 Ellicott Street, Buffalo, NY 14203, USA 2 Pervasive Technology Institute, Indiana University, 2719 East 10th Street, Bloomington, IN 47408, USA 3 School of Information, University of Michigan, 105 S. State Street, Ann Arbor, MI 48109, USA
SUMMARY This paper describes XSEDE Metrics on Demand, a comprehensive auditing framework for use by highperformance computing centers, which provides metrics regarding resource utilization, resource performance, and impact on scholarship and research. This role-based framework is designed to meet the following objectives: (1) provide the user community with a tool to manage their allocations and optimize their resource utilization; (2) provide operational staff with the ability to monitor and tune resource performance; (3) provide management with a tool to monitor utilization, user base, and performance of resources; and (4) provide metrics to help measure scientific impact. Although initially focused on the XSEDE program, XSEDE Metrics on Demand can be adapted to any high-performance computing environment. The framework includes a computationally lightweight application kernel auditing system that utilizes performance kernels to measure overall system performance. This allows continuous resource auditing to measure all aspects of system performance including filesystem performance, processor and memory performance, and network latency and bandwidth. Metrics that focus on scientific impact, such as publications, citations and external funding, will be included to help quantify the important role high-performance computing centers play in advancing research and scholarship. Copyright © 2012 John Wiley & Sons, Ltd. Received 23 September 2011; Revised 11 May 2012; Accepted 11 May 2012 KEY WORDS:
HPC Metrics; application kernels; XSEDE; UBMoD; XDMoD; HPCMoD
1. INTRODUCTION Historically, many separate and diverse monitoring tools have been used within supercomputing centers to address the diverse needs of end-users, system administrators, and center directors. This includes Nagios [1], a monitoring solution for hosts, services, and networks; Ganglia [2], a scalable distributed monitoring system for high-performance computing systems, such as clusters and Grids; Cacti [3] for network graphing solutions; and Inca [4] for user-level Grid monitoring with periodic, automated user-level testing of the software and services required to support Grid operation. Furthermore, Grid-related tools including Globus and Condor include explicit modifications to incorporate auditing and monitoring features. Condor provides, through Hawkeye [5], a mechanism for collecting, storing, and using information about computers. Globus provided the first notable user level auditing tool, initially developed by von Laszewski [6] to augment the GridFTP service. Most recently the Globus project has significantly enhanced this work while explicitly integrating an *Correspondence to: Thomas R. Furlani, Center for Computational Research, University at Buffalo, State University of New York, 701 Ellicott Street, Buffalo, NY 14203, USA. † E-mail:
[email protected] Copyright © 2012 John Wiley & Sons, Ltd.
XDMOD PERFORMANCE METRICS AND AUDITING FRAMEWORK
919
auditing component into GRAM [7] that can interface with the local accounting system of a resource provider. In addition, efforts in accounting and auditing have been conducted as part of the TeraGrid [8–21]. Hardware performance monitoring is accomplished using kernel-based access to hardware counters or at a higher level of abstraction through PAPI Services [22]. The Open Science Grid has developed the Gratia accounting system that utilizes a number of probes and a central collector and graphical display capability [23]. Department of Energy (DOE) and Department of Defense (DOD) programs have contributed system management and monitoring tools, including the Department of Defense high-performance computing (HPC) modernization program’s sustained systems performance monitoring tools [24, 25], the National Energy Research Scientific Computing Center performance monitoring tools [26] and Department of Energy ‘operational assessment’ metrics for various HPC sites [27]. At the academic high-performance computing center level, the open-source tool UB Metrics on Demand (UBMoD) [28], presents resource utilization (CPU cycles consumed, total jobs, average wait time, etc.) for individual users, research groups, departments, and decanal units. A role-based authentication scheme is used to display data in the format best suited to the end-user (for example, student, research group leader, department chair, dean, etc.). A web-based user interface provides a dashboard for displaying resource consumption along with fine-grained control over the time period and resources displayed. The data warehouse back-end is populated with data from resource managers commonly found in high-performance computing environments (TORQUE [29], OpenPBS [30], and SGE [31] are currently supported), and can be customized to support new resource managers. The most recent release of UBMoD adds the ability to apply custom tags to users and jobs and to then filter all reports using those tags. This provides complete flexibility for organizing users into departments, projects, and groups. For example, users can be tagged as members of one or more projects and reports can be dynamically generated for those projects. Although numerous and diverse, the monitoring tools described above are largely passive and local in nature, reporting on data such as total number of jobs run, CPU cycles delivered, average wait time, etc. Existing user-oriented tools such as Inca provide notification in response to specific triggers but do not provide global metrics. Unfortunately, this type of monitoring is not well suited to identify hardware and software weaknesses or deficiencies in the computing infrastructure. For example users frequently encounter problems when running on compromised or faulty hardware that cause their calculation to either fail outright (through no fault of their own) or run so slowly that it runs into the time limit. It is often very difficult for system support personnel to preemptively catch all such potential problems, with the result that the end-users are the ‘canaries’ that report damaged or underperforming resources, often after investigations that are very expensive both in terms of computational resources and personnel time. Today’s monitoring tools for HPC are further limited in that they fail to consider important metrics such as impact on science, publications, citations and external funding supported by access to HPC infrastructure. Although typically much more difficult to collect and certainly more subjective in nature, these metrics are nonetheless important to the long-term sustainability of academic HPC centers. Despite the clear and crucial role that campus-based HPC centers play in supporting research and scholarship at a modern research university [32], it is safe to say that all too often, given today’s financial pressures, administrative support for such centers is difficult to garner and budgetary pressure is constantly applied. This is partly due to the lack of quantitative metrics that clearly demonstrate the utility, service, competitive advantage, and return on investment that these centers provide. Because resources are limited, it is incumbent on HPC centers to provide quantitative evidence to justify the university’s continued investment, and accordingly these metrics should be an integral part of a holistic approach to monitoring. The auditing framework presented here, XSEDE Metrics on Demand (XDMoD), seeks to remedy some of the above-mentioned deficiencies. It rests on a foundation of traditional system monitoring and response. However, the framework is also designed to preemptively identify potential bottlenecks from user applications by deploying customized, computationally lightweight ‘application kernels’ that continuously monitor system performance and reliability from the application users’ point of view. We use the term ‘application kernel’ in this case to represent micro and standard benchmarks that represent key performance features of modern scientific and engineering Copyright © 2012 John Wiley & Sons, Ltd.
Concurrency Computat.: Pract. Exper. 2013; 25:918–931 DOI: 10.1002/cpe
920
T. R. FURLANI ET AL.
applications, and small but representative calculations carried out with popular open-source highperformance scientific and engineering software packages. The term ‘computationally-lightweight’ is used to indicate that the application kernel runs for a short period (typically less than 10 min) on a small number of processors (less that 128 cores) and therefore requires relatively modest resources for a given run frequency (say once or twice per week). Accordingly, through XDMoD, system managers have the ability to proactively monitor system performance as opposed to having to rely on users to report failures or underperforming hardware and software. In addition, through this framework, new users can determine which of the available systems are best suited to address their computational needs. We begin with a description of the XDMoD architecture.
2. XSEDE METRICS ON DEMAND ARCHITECTURE The system is comprised of three major components: the XDMoD Data Warehouse, which ingests data daily from the XSEDE (XD) central database, the XDMoD RESTful API, which provides services to external applications, and the XDMoD Portal, which utilizes the RESTful API and provides an interface to the world; each of these is described in detail below. Figure 1 provides a high-level schematic of the XDMoD framework architecture. 2.1. XDMoD Data Warehouse The XDMoD Data Warehouse is the local repository for data obtained from multiple sources such as the XSEDE central database (XDCDB) and Inca, and is responsible for importing and aggregating this data. The XSEDE central database is an extensive, unified database containing job statistics such as number of jobs, job size, CPU hours consumed, job wait times, etc., for all jobs run on XSEDE resources. It also stores allocation and user information. Inca serves as the deployment engine for all of the XDMoD application kernels. Through a process called ingestion, data from these sources are retrieved, parsed, aggregated across multiple dimensions for faster access, and
Figure 1. XDMoD architecture schematic. Copyright © 2012 John Wiley & Sons, Ltd.
Concurrency Computat.: Pract. Exper. 2013; 25:918–931 DOI: 10.1002/cpe
XDMOD PERFORMANCE METRICS AND AUDITING FRAMEWORK
921
subsequently stored in the XDMoD data warehouse. As is typical of many large data warehouses, the data have been selectively denormalized to improve performance by reducing the need for join operations as opposed to being represented in 3rd Normal Form [33]. To facilitate the ingestion of XSEDE job data, we maintain a local mirror of the XDCDB that is updated daily from the primary database. In terms of scale, the daily ingestion process for the XSEDE central database imports, aggregates, and summarizes an average of 30K records from more than 20 active resources with a total of approximately 1500 active users. During this process, relationships between the various datasets are established so that information can be easily compared with the XDCDB. An ingestion API has been developed to simplify the development of ingesters for new data sources and also provide access to the information stored in the data warehouse. The current implementation of the API supports time series queries, which aggregate data over time based on a user specified aggregation unit (day, month, quarter, year), and simple aggregation queries that sum or average over a user defined period of time. By ‘time series’ we simply mean a sequence of data points measured at successive time instants. Query results may be limited or restricted to certain dimensions and statistics in the data warehouse depending on the users’ role. The API also provides functionality for visualizing the results as charts or datasets (i.e., spreadsheets). As described in Section 3, time series based datasets can be plotted as area, line, or bar charts, while aggregate datasets can be plotted as bar, line, or pie charts. Moreover, the API provides multiple export formats: PNG, EPS, CSV, XML, and JavaScript Object Notation. It is important to note that while XDMoD is currently tailored to work with the data stored in the XDCDB, future releases will allow for custom databases containing similar data collected by individual HPC centers through the use of custom ingesters. In the meantime, the open source package UBMoD is available to provide useful utilization metrics for academic HPC centers [28]. The XDMoD data warehouse employs a dimensional starflake model for storage of the ingested data. Most data warehouse designs use dimensional models, such as Star-Schema, Snow-Flake, and Star-Flake [34, 35]. A star-schema is a dimensional model with fully denormalized hierarchies, whereas a snowflake schema is a dimensional model with hierarchies represented in the 3rd Normal Form [36]. A starflake schema, a combination of a star schema and a snow-flake schema, provides the best solution because it allows for a balance between two extremes. For example, while some of the dimensions having a very long list of attributes that may be used in a query perform better by being ‘snowflaked’, other dimensions perform better by using the star schema where the dimension is denormalized [38]. Therefore, the decision whether or not to normalize a dimension is based on the properties of the dimension. Upon ingestion, the transactional data of various data sources (e.g., XDCDB) are partitioned into ‘facts’ or ‘dimensions’. Dimensions are the reference information that give context to facts. For example an XD job transaction can be partitioned into facts such as the job_id and total CPU time consumed, and into dimensions such as resource provider, field of science, funding allocation, and the principal investigator of the project. Although a careful review of our star-flake schema design decreased query times by an average of 10 times and up to 30 times over the initial snowflake design, the data warehouse still needed to address performance of aggregating data over dynamic timeframes. For this purpose, the data warehouse fact tables are aggregated (i.e., pivoted) one more time over units of time as a new dimension. In this phase, we aggregate data over its complete duration by day, month, quarter and year. Keeping multiple resolutions of aggregated data allows for faster queries and is especially important for large data sets covering long periods of time. The data from the fact table is summarized into aggregates and stored physically in a different table than the fact table. Aggregates can significantly increase the performance of the query because the query will read fewer data from the aggregates than from the fact table. Because the time to read data from physical disk is the largest bottleneck in query execution time, reducing the number of rows that need to be accessed greatly improves the query performance of the data warehouse. 2.2. RESTful API To better abstract the underlying implementation and data organization and insulate both external and internal components from any necessary changes to XDMoD internals we have implemented Copyright © 2012 John Wiley & Sons, Ltd.
Concurrency Computat.: Pract. Exper. 2013; 25:918–931 DOI: 10.1002/cpe
922
T. R. FURLANI ET AL.
a RESTful API (that is conforming to representational state transfer as defined by Roy Fielding [37]) that provides access to all supported functionality. To assist third party developers (and internal developers needing to interface with XDMoD components), we have implemented a selfdocumenting feature to make this task easier. The XDMoD RESTful API Catalog provides a mechanism for API developers to include documentation within the API implementation that is automatically formatted into a description document and presented to third party developers to assist them in utilizing the API. 2.3. XSEDE Metrics on Demand portal The XDMoD portal is a web-based application developed using open source tools including the LAMP (Linux, Apache, MySQL, PHP) software stack and the ExtJS [38] user interface toolkit. XDMoD is developed using the Model-View-Controller [39, 40] software design pattern with the View being implemented entirely using the ExtJS user interface toolkit to provide the lookand-feel and advanced features of a desktop application within a web browser. The Controller serves as a router where service requests are received and sent to the appropriate Model (e.g., charting, report building, application kernels, etc.) for handling. Multiple Controllers can be created to handle specific types of requests such as the generation of charts, creation of customized reports, and queries for information such as available resources to feed the user interface. We have chosen to use authenticated RESTful services as the interface to all backend data services (Controllers and Models) and to completely decouple the user interface (View) from the backend services. This decoupling allows us to immediately achieve the goal of providing a service API that can be utilized by third-party data ingestion or display tools such as Google gadgets or other portal infrastructures. ExtJS is an advanced cross-browser JavaScript user interface toolkit that provides a rich set of functionality that one would typically expect to find in a desktop application including drag-and-drop functionality, event handling, callbacks, and customizable widgets. This provides XDMoD developers with a wide variety of features to build into the portal such as: tree views for organizing hierarchical data, tabbed display panels for organizing and displaying different types of information, a mechanism for easily utilizing RESTful services, and components for automatically parsing data returned from those services. Because the XDMoD Portal service has to meet the needs of diverse classes of users, the interface includes an on-going user needs analysis. Additionally, we have adopted a role-based scheme, which presents a customized view for each category of user. 3. XSEDE METRICS ON DEMAND FUNCTIONALITY XSEDE Metrics on Demand provides a role-based web portal for mining HPC metrics data and performing statistical analysis. In the present implementation of XDMoD, data are ingested daily and queries are tuned to provide results within a few seconds. Currently XDMoD is designed to function within the XSEDE framework, although future versions will support activities at academic and industrial HPC centers. The XDMoD portal (https://xdmod.ccr.buffalo.edu) provides a rich set of features accessible through an intuitive graphical interface, which is tailored to the role of the user. Currently, five roles are supported: Public, User, Principal Investigator, Center Director and Program Officer. Although XDMoD will continue to evolve over time, it is useful to describe some of its current functionality. As shown in Figure 2, which is a screen capture of the XDMoD interface for the Program Officer role, the interface is organized by tabs. Different functional tabs are displayed for different XDMoD roles. For illustrative purposes, we will focus on the Program Officer role. The Summary tab shown in Figure 2 displays a snapshot overview of XSEDE, with several small summary charts visible. Clicking on the XSEDE button (in the row underneath the tab row) brings up a drop down menu that allows one to narrow the scope of the metrics displayed to a particular service provider. The default is to show utilization over the previous month, but the user may select from a range of preset date ranges (week, month, quarter, year to date, etc.) or choose a custom date range. The Usage tab Copyright © 2012 John Wiley & Sons, Ltd.
Concurrency Computat.: Pract. Exper. 2013; 25:918–931 DOI: 10.1002/cpe
XDMOD PERFORMANCE METRICS AND AUDITING FRAMEWORK
923
Figure 2. XDMoD Portal Interface. Shown are four charts summarizing XD performance. Key features of the interface include the ability to export the data and chart, select custom date ranges, display the chart in several formats (column, pie, line, and area), and generate a custom report containing any number of desired charts.
presently provides access to a set of 22 XSEDE-wide metrics that are accessible through the treestructure on the left-hand side of the portal window. If logged in under the User role as opposed to the Program Officer role, then the usage tab provides details specific to your utilization as opposed to all of XSEDE. The Usage Explorer tab, which also provides access to all of the metrics available through the Usage tab, facilitates comparison among the various metrics by allowing multi-axis plots, as shown in Figure 3. The App Kernels tab provides information on the application kernel performance on XSEDE resources. The data generated by the application kernels is substantial, making the exploration of the data challenging. However, the App Kernel Explorer tab provides an interface that facilitates exploration of the application kernel performance metrics. Here the user can easily select a specific application kernel or suite of application kernels, a specific resource, and a range of job sizes for which to view performance. The Search Usage tab allows the Program Officer to view the utilization data for any XSEDE user. The Report Generator tab gives the user access to the Custom Report Builder that allows a user to create and save custom reports. For example, a user may wish to have specific plots and data summarized in a concise report that they can download for offline viewing. The user can also choose to have custom reports generated at a user specified interval (daily, weekly, quarterly, etc.) and automatically send to them via email at the specified time interval, without the need to subsequently log into the portal. Accessing XDMoD through the Public role (https://xdmod.ccr.buffalo.edu) requires no password, and although not all the functionality listed above is available in this view, it does allow users to explore utilization metrics of XSEDE resources over an adjustable timeframe. Metrics provided by XDMoD include: number of jobs, service units charged, normalized units provided, CPUs used, wait time, wall time, minimum, maximum and average job size, average service units charged, average normalized units provided, average CPU used, average wall time, average wait time and user expansion factor. These metrics can be broken down by: field of science, gateway, institution, job size, job wall time, National Science Foundation (NSF) directorate, NSF user status, parent science, person, Principal Investigator, and by resource. Please note that in this paper a metric is defined to be an analytical measurement intended to quantify the state of a system. A context-sensitive drill-down capability has been added to many charts allowing users to access additional related information simply by clicking inside a plot and then selecting the desired metric. For example, in Figure 3, which is a plot of total CPU hours by job size for all XSEDE resources, Copyright © 2012 John Wiley & Sons, Ltd.
Concurrency Computat.: Pract. Exper. 2013; 25:918–931 DOI: 10.1002/cpe
924
T. R. FURLANI ET AL.
Figure 3. XDMoD portal interface showing Usage Explorer tab and a plot of total CPU hours and user expansion factor by job size. The tree structure on the left-hand side shows the wide range of metrics and groupings available through the Usage Explorer tab.
one can select any column in the plot and obtain additional information (such as field of science) specific to the range of data represented by the column. A ‘breadcrumb trail’ has also been implemented to provide users with feedback as to how they arrived at a particular chart and provide a mechanism for moving back and forth within that hierarchy. Additional functional features include: the ‘Export’ button that allows data to be output in a variety of formats (CSV, XML, PNG), EPS), the ‘Filter’ button, which allows the user to select which data to display and which to hide in a given plot, and the ‘Help’ button, which allows the user access to the XDMoD user guide. The ‘Display’ button allows the user to customize the type and appearance of the chart and to toggle between the display of a given chart or the data set used in its generation and also to display time series (that is data plotted as a function of time).
4. APPLICATION KERNEL AUDIT SERVICE Most modern, multipurpose HPC centers mainly rely upon system related diagnostics, such as network bandwidth, processing loads, number of jobs run, and local usage statistics to characterize their workloads and audit the performance of their infrastructure. However, this is quite different from having the means to determine how well the computing infrastructure is operating with respect to the actual scientific and engineering applications for which these HPC platforms are designed and operated. Some of this is discernable by running benchmarks; however, in practice benchmarks are so intrusive that they are not run very often (see, for example, Ref. [25] in which the application performance suite is run on a quarterly basis), and in many cases only when the HPC platform is initially deployed. Today’s HPC infrastructure is a complex combination of resources and environments that are continuously evolving, so it is difficult at any one time to know if optimal performance of the infrastructure is being realized. The key to a successful and robust science and engineeringbased HPC technology audit capability lies in the development of a diverse set of computationally lightweight application kernels that will run frequently on HPC resources to monitor and measure system performance, including critical components such as the global filesystem performance, local processor-memory bandwidth, processing speed, and network latency and bandwidth. The Copyright © 2012 John Wiley & Sons, Ltd.
Concurrency Computat.: Pract. Exper. 2013; 25:918–931 DOI: 10.1002/cpe
925
XDMOD PERFORMANCE METRICS AND AUDITING FRAMEWORK
application kernels are designed to address this deficiency, and to do so from the perspective of the end-user applications. As noted in the introduction, we use the term ‘application kernel’ to represent micro and standard benchmarks that represent key performance features of modern scientific and engineering applications, and small but representative calculations carried out with popular open-source high-performance scientific and engineering software packages. The initial set of application kernels were drawn from community open-source scientific and engineering codes like NWChem [41, 42], GAMESS [43–45], NAMD [46, 47], WRF [48], and CESM [49], and established low-level and microbenchmark tools [50, 51], MPI benchmarks [52], high-performance LINPACK [53], and GRAPH500 [54]. Categorizing the current set of kernels has been accomplished by application area, but as the kernel population grows we anticipate also using a more functional approach similar to the Berkeley ‘dwarfs’ [55]. A recent Department of Energy study for Exascale computing needs [56] exemplifies this overlap between application areas and the kernel ‘dwarf’ classification of the computationally intensive algorithms involved. Table I shows our current sampling of the dwarfs by application kernels (in terms of the original seven dwarfs and the application areas we have sampled thus far). Our initial set of application kernels largely fall into the application areas of molecular physics, computational chemistry, weather/climate modeling, and nanoscale science, plus we have lower level microbenchmarks and benchmarks specifically for input/output (I/O). The GRAPH500 benchmark samples a different, expanded view of the dwarf classification [57] in data-intensive graphoriented combinatorial kernels. The list of application kernels will continually be expanded to ensure a thoroughly representative sampling of application areas, even as new applications are developed. We have distilled ‘lightweight’ benchmarking kernels from these that are designed to run quickly with an initially targeted wall-clock time of less than 10 min. However, we also anticipate a need for more demanding kernels to stress larger computing systems subject to the needs of HPC resource providers to conduct more extensive testing. The goal is to touch all major performance issues to be found in typical HPC compute and data environments, including (1) local scratch, (2) global filesystems for file staging and parallel I/O, (3) local processor-memory bandwidth, (4) processing speed, and (5) network latency and bandwidth. For some aspects of performance it will become necessary to develop customized kernels, but we are initially leveraging existing applications as much as possible, provided that they can be kept lightweight and therefore low-impact. This preliminary list of application kernels was not meant to be exhaustive — indeed we intend to use an open-source framework that will easily allow for end-users to donate their own application kernels to the service. Application kernels will be preferred that satisfy the following profiling and usability criteria: (1) the application needs to provide reliable low-level performance data that can be used for measuring the metric of choice: for example, NWChem provides I/O statistics on scratch space used to store temporary files that can be used to identify underperforming and nonperforming disk space, while STREAM can similarly be used for processor-memory bandwidth. (2) Essential pieces of the system (processor, memory, and input/output) can all be tested from the application’s point of view. While a single application kernel will not simultaneously test all of these aspects of machine performance, the full suite of kernels will stress all of the important performance-limiting attributes. It is important to note, however, that the application kernels will run at regular intervals from the user’s perspective, in that a regular user account is employed to run the kernels at both planned Table I. Correspondence between currently deployed application kernels and the Berkeley dwarfs (the original seven dwarfs have been considered thus far of the extended list of 13).
Kernel class Biomolecular Computational Chemistry Fluid Dynamics Climate/Weather Modeling
Structured grids p p
Copyright © 2012 John Wiley & Sons, Ltd.
Unstructured grids
Fast Fourier Transform p p
Dense linear algebra p p
Sparse linear algebra p p
Nbody p p
Monte Carlo p
p
Concurrency Computat.: Pract. Exper. 2013; 25:918–931 DOI: 10.1002/cpe
926
T. R. FURLANI ET AL.
and requested intervals on XSEDE resources (even if the application kernels are light enough that they require only a few minutes each, it is likely that there will be enough of them that only a subset is run at any given time). The resulting performance data (including overall run time, run time of various subsystems and other data characteristic of the various application kernels) will be archived within the XDMoD framework and used to provide immediate and long-term feedback on the performance profile of the HPC resources. An automated schedule can also be put in place for running the kernels, initially corresponding to system maintenance times to minimize the impact on normal operations and accommodate the occasional need for performing runs at large scale. These intervals can easily be adjusted, and we further anticipate implementing a responsive unit in which system support personnel at various HPC resources can place requests for custom scheduling of the application kernel test suites, and quantitative measures of the application kernel coverage of given resources. Notifications of diagnostic failures can be sent to support personnel automatically, while performance issues will be flagged for lower priority notification and further testing. Existing software infrastructure has been leveraged for running the application test kernels — currently Inca is being used [4]. Thus, as shown in Figure 1, data from the application kernels are readily ingested into the XDMoD Data Warehouse for subsequent analysis and access to users. Crucial to the success of the application testing strategy, however, is the inclusion of historical test data within the XDMoD data warehouse and data management system. Site administrators can easily monitor application kernel run failures for troubleshooting performance issues at their site. As an example, consider Figure 4, which shows the unanticipated results brought to light by a periodically running application kernel based on the popular NAMD molecular dynamics package [46]. The application kernel detected a roughly 25% degradation in the NAMD baseline performance that was the unanticipated result of a routine system-wide upgrade of the application version. Possible strategies for restoring the pre-upgrade performance include the use of more aggressive compiler options, but care will need to be exercised to ensure the desired level of accuracy is maintained. Without application kernels periodically surveying this space, the loss in performance would have gone unnoticed. Application users will also be able to examine a performance profile for an application kernel of their choice (or even one that they themselves submitted and had incorporated into the application
Figure 4. Plot of execution time of NAMD-based application kernel on 8, 16, 32, and 64 cores over a 1 month time period. Jump indicates when NAMD application underwent routine system-wide upgrade in the application version, which resulted in as much as a 25% degradation in performance (note automatic change indicator symbols indicate when application was upgraded). Copyright © 2012 John Wiley & Sons, Ltd.
Concurrency Computat.: Pract. Exper. 2013; 25:918–931 DOI: 10.1002/cpe
XDMOD PERFORMANCE METRICS AND AUDITING FRAMEWORK
927
kernel testing distribution) to better predict their job’s execution time and selectively target betterperforming resources. We anticipate creating a user-selectable application role within XDMoD to better allow end-users to preferentially view application kernel statistics that overlap their area of interest. There is also great utility in cross-site performance data, because resource providers and planners can use the data (including the queue wait times and overall job statistics for the kernels themselves) to better allocate and design new HPC resources. A further important component of application kernel based auditing will be the development of an Application Kernel Toolkit that will facilitate the development of novel application kernels by other groups interested in devising metrics to help evaluate their computing infrastructure. The toolkit also will allow other HPC centers and providers to access the application kernels developed under XDMoD and install and run them on their own clusters to improve performance and the delivery of resources. The toolkit will initially consist of documentation and examples on existing application kernels, together with scripts needed for integration with the monitoring framework. As the application kernels evolve, a custodial process will be developed in which user-developed and supplied kernels can be adopted into the mainstream collection. We anticipate that growth in the pool of application kernels will necessitate an organized collection, into application areas focused around the Berkeley ‘dwarfs’ that characterize the computation and communication demands of scientific and engineering applications [55, 57].
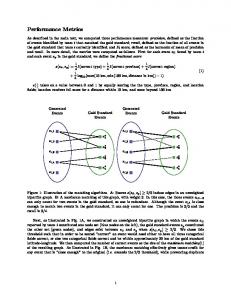
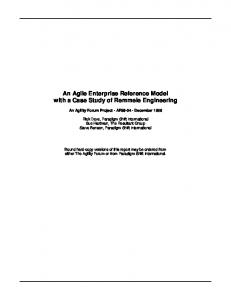
5. FUTURE WORK We have laid a solid foundation for XDMoD from which to build upon. For example, we are working on a function called ‘User Like Me’, which has the capability of allowing users to rank XD computational resources based upon the type of calculation that they are performing and help set expectation levels for application performance. Thus, a user will be better able to judge if the performance and scaling of their application on a given resource is reasonable by comparing their results to similar applications. We are also working on ingesting grant and publication information into the XDMoD database to provide quantitative metrics regarding scientific impact. Initially the application kernels were run solely on Center for Computational Research computational resources but the deployment has now been extended to run on the FutureGrid systems (futuregrid.org) and on select XSEDE resources. Ultimately we will extend this throughout XSEDE, FutureGrid, and to other HPC systems putting together an application kernel data warehouse that can be accessed using XDMoD. An application kernel toolkit to facilitate application kernel development and deployment is also being developed. Perhaps most noteworthy is the development of an open-source version of XDMoD (HPCMoD) that can be utilized by academic and industrial HPC centers to have a more far-reaching impact. HPCMoD will represent a substantial upgrade of UBMoD both in terms of capabilities and ease of use. The information utilized by XDMoD to describe the XSEDE structure, resources, and operation is very similar in nature to the information that describes resources available at a typical HPC center. In fact, a typical HPC center can be treated conceptually as XSEDE with a single resource provider. Figure 5 displays how the relationships between various XSEDE entities such as HPC resources organization, user hierarchy, and scientific hierarchy can readily be mapped to similar entities in an academic or commercial organization. Both XSEDE and HPC centers employ the concept of users, jobs, help desk tickets, publications, and one or more resources (e.g., compute cluster, storage pool, etc.). Users also fall into a similar hierarchical organizational structure differing only in the terms used to describe nodes in the hierarchy. On XSEDE, users are associated with a particular NSF directorate and field of science based on their allocation; an academic HPC center may group users by decanal unit and department (as is carried out in UBMoD); an industrial HPC center may group users by project and department. Similarly, the job level information collected can include a job name, wall clock time, start and end dates, memory utilization, and so on. In addition, user access roles bear a strong resemblance between XSEDE and a typical HPC center. Where XDMoD utilizes roles for a Program Officer, Center Director, Principal Investigator, Campus Champion, User, and Public, a university-based HPC center might require similar roles for Copyright © 2012 John Wiley & Sons, Ltd.
Concurrency Computat.: Pract. Exper. 2013; 25:918–931 DOI: 10.1002/cpe
928
T. R. FURLANI ET AL.
Figure 5. Data associations between XDMoD and a typical HPC center.
Figure 6. Role associations between XDMoD and a typical HPC Center.
a President/Provost, Dean, Department Head, Center Director, System Administrator, PI, and User as shown in Figure 6. HPCMoD will provide a facility for adjusting the access of these roles so that they are appropriate for a particular installation. While the open source HPCMoD will utilize the same data warehouse, analysis back-end, and visualization user interface as XDMoD, deployment in a non-XSEDE HPC environment will require some level of development and information gathering efforts. For example, XSEDE collects their organization, resource, user, and job information in the XDCDB. XDMoD utilizes tools called ‘ingesters’ (see Figure 1) to consume this information and format it for inclusion into the local XDMoD data warehouse. For an individual HPC center with job data stored in resource manager (e.g., PBS, LSF) log files, a custom ingester will be needed to parse these log files and provide Copyright © 2012 John Wiley & Sons, Ltd.
Concurrency Computat.: Pract. Exper. 2013; 25:918–931 DOI: 10.1002/cpe
XDMOD PERFORMANCE METRICS AND AUDITING FRAMEWORK
929
the extracted information to the HPCMoD data warehouse. Although we intend to develop custom ingesters for some of the common resource managers, we expect that other HPC centers will contribute their custom ingesters for inclusion in future releases. Information describing users, projects and hierarchical structure of an organization will also be needed but this process will be facilitated by interfaces and the API provided by HPCMoD. It should be noted that the display and analysis of application kernel data will remain largely unchanged between XDMoD and the open source HPCMoD. This is due to the fact that the application kernel data are generally specific to the applications themselves rather than the individual resources.
6. CONCLUSIONS XSEDE Metrics on Demand has become a useful tool for rapid, high-level monitoring of the XSEDE infrastructure that is currently utilized by XSEDE leadership, service providers, and NSF program officers to monitor performance and guide policy decisions [58]. For example, XDMoD tools can readily audit the XD system to compile weekly, monthly, quarterly, or annual reports breaking down the services delivered by investigator, institution, scientific discipline or resource as desired for high-level program officers. Indeed, it is now utilized to generate utilization reports for all service providers for inclusion in the XSEDE quarterly reports. Furthermore, the initial application kernel deployment has shown itself to be useful even in early testing. For example, during the process of running application kernels and testing them for scalability on our local HPC resources we discovered that one of our production level molecular dynamics applications was incorrectly compiled causing a substantial performance degradation for parallel jobs that were larger than eight processors. Without the application kernels, this likely would have gone undetected for some time, resulting in longer execution times for our users and wasteful utilization of already oversubscribed resources. The application kernels also uncovered a subtle bug [58] in a vendor-supplied low-level IO routine for our parallel file system that resulted in sporadic severe performance degradation for NWChem, a heavily utilized quantum chemistry software package. Once informed, the vendor provided a software patch to correct the problem. Again, without the application kernels, this likely would have gone unnoticed given its sporadic nature. Users would simply have had to deal with failed jobs, resubmitting them and hoping for successful completion. Furthermore, once fully running on all XSEDE resources, the application kernels will provide end-users with a way to compare application performance across service providers, and therefore help determine which of the XSEDE resources is best suited to their application. We anticipate that the full value of the XDMoD system for XSEDE will be realized when it is fully operational and used by program managers and end-users to optimize their utilization of XSEDE resources in all areas — from allocation requests to reporting results to determining which systems are best suited for their application. Furthermore, XSEDE resource providers will be able to use the system to conduct analyses to set and adjust policies that maximize system usability and importantly proactively troubleshoot their HPC environment to ensure it is operating optimally. We also anticipate XDMoD usage cases where the instantaneous access to metrics will aide resource providers in making infrastructure decisions. Importantly, the open source version of XDMoD will have an impact beyond XSEDE — providing university and industrial HPC centers with a tool to optimize the delivery of high-performance computing resources to their local user community. Although functionality continues to be added to XDMoD, the features summarized in this paper have already proven quite useful and provide a solid foundation for future development.
ACKNOWLEDGEMENTS
This work was sponsored by NSF under grant number OCI 1025159 for the development of technology audit services for XSEDE. We would like to thank Lizhe Wang for his contributions on the report generator. Copyright © 2012 John Wiley & Sons, Ltd.
Concurrency Computat.: Pract. Exper. 2013; 25:918–931 DOI: 10.1002/cpe
930
T. R. FURLANI ET AL.
REFERENCES 1. Nagios: The Industry Standard. IT Infrastructure Monitoring: (Available from: http://www.nagios.org/ [August 19, 2011]). 2. Matthew L, Massie B, Chun N, Culler DE. The ganglia distributed monitoring system: design, implementation, and experience. Parallel Computing 2004; 30(8):817–840. 3. Cacti: The Complete RRDTool-based Graphing Solution. (Available from: http://www.cacti.net/ [August 19, 2011]). 4. Smallen S, Olschanowsky C, Ericson K, Beckman P, Schopf J. The Inca test harness and reporting framework. Proceedings of Supercomputing, Pittsburg PA, 2004; 55–64. See also: Inca. http://inca.sdsc.edu [September 1, 2011]. 5. Hawkeye: A Monitoring and Management Tool for Distributed Systems. (Available from: http://www.cs.wisc.edu/ condor/hawkeye/ [August 19, 2011]). 6. Laszewski V. Grid Usage Sensor Service. (Available from: http://128.150.4.107/awardsearch/showAward.do? AwardNumber=0414407 [August 19, 2011]). 7. Martin S, Lane P, Foster I, Christie M. TeraGrid’s GRAM Auditing & Accounting, & Its Integration with the LEAD Science Gateway, TeraGrid Workshop, 2007. (Available from: http://www.globus.org/alliance/publications/papers/ TG_GRAM_auditing_and_LEAD_Gateway_final_2.pdf [August 19, 2011]). 8. GPIR. (Available from: http://www.tacc.utexas.edu/projects/gpir.php [September 8, 2011]). 9. TeraGrid Knowledge Base: How can I check my TeraGrid account balance? (Available from: [October 28, 2008]). 10. TeraGrid Knowledge Base: How can I tell if a TeraGrid resource is available? (Available from: [May 16, 2008]). 11. TeraGrid Traffic Map. (Available from: https://network.teragrid.org/trafmap/ [August 19, 2011]). 12. TeraGrid Information Services. (Available from: [September 8, 2011]). 13. TeraGrid Knowledge Base: On the TeraGrid, how do I convert service units on one platform to the equivalent amount on another platform? (Available from: [October 28, 2008]). 14. TeraGrid Knowledge Base: What is Inca? (Available from: [May 22, 2008]). 15. TeraGrid Knowledge Base: How does Inca work? (Available from: [July 21, 2008]). 16. Reporters and Reporter Repositories. (Available from: [August 19, 2011]). 17. (Available from: http://inca.sdsc.edu/repository/latest/cgi-bin/list_reporters.cgi [September 8, 2011]). 18. TeraGrid Knowledge Base: What is pfmon, and can I run it on the TeraGrid? (Available from: [September 18, 2008]). 19. Katz DS, Hart D, Jordon C, Majumdar A, Navarro JP, Smith W, Towns J, Welch V, Wilkins-Diehr N. Cyberinfrastructure usage modalities on the TeraGrid. IEEE International Parallell & Distributed Processing Symposium, Anchorage AK, 2011; 932, DOI: 10.1109/1PDPS.2011.239. 20. Hart DL. Measuring TeraGrid: workload characterization for an HPC federation. IJHPCA 2011; 25(4):451–465. DOI: 10.1177/1094342010394382. Advance online publication, Feb. 10, 2011. 21. Hart DL. Deep and wide metrics for HPC resource capability and project usage, SC11 state of the practice reports (Seattle, WA), 2011. DOI: 10.1145/2063348.2063350. 22. TeraGrid Knowledge Base: What is PAPI, and where is it installed on the TeraGrid? (Available from: [October 17, 2008]). 23. Canal P, Green C. GRATIA, a resource accounting system for OSG. CHEP, Victoria, B.C., 2007. 24. DOD HPC modernization program metrics. (Available from: http://www.hpcmo.hpc.mil/Htdocs/HPCMETRIC/ index.html [December 16, 2011]). 25. Bennett PM. Sustained systems performance monitoring at the U. S. Department of Defense high performance computing modernization program. In State of the Practice Reports (SC ’11), Article 3. ACM: New York, NY, USA, 2011; 11 pages, DOI: 10.1145/2063348.2063352. http://doi.acm.org/10.1145/2063348.2063352. 26. NERSC performance monitoring tools. (Available from: https://www.nersc.gov/research-and-development/ performance-and-monitoring-tools/ [December 16, 2011]). 27. DOE “operational assessment” metrics for various HPC sites, for example ORNL. (Available from: http://info.ornl. gov/sites/publications/files/Pub32006.pdf [December 16, 2011]). 28. University at Buffalo Metrics on Demand (UBMoD): Open source data warehouse and web portal for mining statistical data from resource managers in high-performance computing environments. Developed at the Center for Computational Research at the University at Buffalo, SUNY. Freely available under an open source license at SourceForge at http://ubmod.sourceforge.net/ [May 1, 2012]. 29. TORQUE Resource Manager. (Available from http://en.wikipedia.org/wiki/TORQUE_Resource_Manager, a fork of OpenPBS that is maintained by Adaptive Computing Enterprises, Inc. (http://www.adaptivecomputing.com/)). 30. OpenPBS. (Available from http://www.mcs.anl.gov/research/projects/openpbs/, http://en.wikipedia.org/wiki/ Portable_Batch_System,andhttp://www.pbsworks.com/). 31. SGE (Sun Grid Engine), now known as Oracle Grid Engine. (Available from http://en.wikipedia.org/wiki/Oracle_ Grid_Engine, http://gridscheduler.sourceforge.net/).
Copyright © 2012 John Wiley & Sons, Ltd.
Concurrency Computat.: Pract. Exper. 2013; 25:918–931 DOI: 10.1002/cpe
XDMOD PERFORMANCE METRICS AND AUDITING FRAMEWORK
931
32. Apon A, Ahalt S, Dantuluri V, Gurdgiew C, Limayem M, Ngo L, Stealey M. High performance computing instrumentation and research productivity in U.S. universities. Journal of Information Technology Impact 2010; 10(2):87–98. 33. Elmasri R, Navathe SB. Fundamentals of Database Systems. Pearson Education: New York, 2004. Print. 34. Levene M, Loizou G. Why is the snowflake schema a good data warehouse design? Information Systems 2003; 28(3):225–240. DOI: 10.1016/S0306-4379(02)00021-2. http://dx.doi.org/10.1016/S0306-4379(02)00021-2. 35. Moody DL, Kortink MAR. From: ER models to dimensional models: bridging the gap between OLTP and OLAP design. Journal of Business Intelligence Summer(2003); 8:3. 36. Lin B (Betsy), Hong Y, Lee Z-H. Data warehouse performance. In Encyclopedia of Data Warehousing and Mining, Wang John (ed.), 2nd edn. IGI Global: Hershey, PA, 2009; 318–322. 37. Fielding R. Architectural styles and the design of network-based software architectures retrieved from http://www. ics.uci.edu/~fielding/pubs/dissertation/top.htm, 2000. 38. ExtJS Website. (Available from: http://www.sencha.com/products/extjs/ [May 25, 2012]). 39. Krasner GE, Pope ST. A cookbook for using the model-view controller user interface paradigm in smalltalk-80. J. Object Oriented Programming 1988; 1(3):26–49. 40. Buschmann F, Meunier R, Rohnert H, Sommerlad P, Stal M. Pattern-Oriented Software Architecture, A System of Patterns. John Wiley & Sons: New York, 1996. 41. Valiev M, Bylaska EJ, Govind N, Kowalski K, Straatsma TP, van Dam HJJ, Wang D, Nieplocha J, Apra E, Windus TL, de Jong WA. NWChem: a comprehensive and scalable open-source solution for large scale molecular simulations. Computer Physics Communications 2010; 181:1477. 42. (Available from: http://www.nwchem-sw.org [December 16, 2011]). 43. Schmidt MW, Baldridge KK, Boatz JA, Elbert TS, Gordon MS, Jensen JH, Koseki S, Matsunaga N, Nguyen KA, Su S, Windus TL, Dupuis M, Montgomery JA. General atomic and molecular electronic structure system. Journal of Computational Chemistry 1993; 14:1347–1363. 44. Gordon MS, Schmidt MW. Advances in electronic structure theory: GAMESS a decade later. In Theory and Applications of Computational Chemistry: the First Forty Years, Dykstra CE, Frenking G, Kim KS, G.E.Scuseria GE (eds). Elsevier: Amsterdam, 2005; 1167–1189. 45. (Available from: http://www.msg.ameslab.gov/gamess [December 16, 2011]). 46. Phillips JC, Braun R, Wang W, Gumbart J, Tajkhorshid E, Villa E, Chipot C, Skeel RD, Kale L, Schulten K. Scalable molecular dynamics with NAMD. Journal of Computational Chemistry 2005; 26:1781–1802. DOI: 10.1002/jcc.20289. 47. (Available from: http://www.ks.uiuc.edu/Research/namd [December 16, 2011]). 48. Skamarock WC, Klemp JB, Dudhia J, Gill DO, Barker M, Duda KG, Huang XY, Wang W, Powers JG. A description of the advanced research WRF version 3. Technical Report, National Center for Atmospheric Research, NCAR/TN–475+STR, 2008. (Available from: http://www.wrf-model.org). 49. (Available from: http://www.cesm.ucar.edu [May 25, 2012]). 50. McCalpin JD. Memory bandwidth and machine balance in current high performance computers. IEEE Computer Society Technical Committee on Computer Architecture (TCCA) Newsletter, December 1995. 51. (Available from: http://www.cs.virginia.edu/stream/ref.html [May 25,2012]). 52. OSU Micro Benchmarks 3.3. (Available from: http://mvapich.cse.ohio-state.edu/benchmarks/ [September 1, 2011]). See also: Intel MPI Benchmarks 3.2.2. (Available from: http://software.intel.com/en-us/articles/ intel-mpi-benchmarks [September 1, 2011]). 53. Petitet A, Whaley RC, Dongarra J, Cleary A. HPL - a portable implementation of the high-performance linpack Benchmark for distributed-memory computers. (Available from: http://netlib.org/benchmark/hpl [September 1, 2011]). 54. Murphy RC, Wheeler KB, Barrett BW, Ang JA. Introducing the Graph 500. Cray User’s Group (CUG), May 5, 2010. (Available from: http://www.graph500.org/ [May 25, 2012]). 55. Asanovic K, Bodik R, Catanzaro B, Gebis J, Husbands P, Keutzer K, Patterson D, Plishker W, Shalf J, Williams S, Yelik K. The landscape of parallel computing research: a view from Berkeley. Technical Report UCB/EECS-2006-183, EECS Department, University of California at Berkeley, December 2006. 56. Ahern SD, Alam SR, Fahey MR, Hartman-Baker RJ, Barrett RF, Kendall RA, Kothe DB, Messer OEB, Mills RT, Sankaran R, Tharrington AN, White JB, III. Scientific application requirements for leadership computing at the exascale. Proceedings of the 2008 Cray User Group Meeting, Helsinki, Finland, May 5–8, 2008. Also available as ORNL/TM-2007/238. 57. Dwarf Mine. (Available from: http://view.eecs.berkeley.edu/wiki/Dwarf_Mine [September 1, 2011]). 58. Furlani TR, Schneider BI, Jones MD, Towns J, Hart DL, Patra AK, DeLeon RL, Gallo SM, Lu C, Ghadersohi A, Gentner RJ, Bruno AE, Boisseau JR, Wang F, von Laszewski G. Data analytics driven cyberinfrastructure operations, planning and analysis using XDMoD. submitted SC12 Conference, Salt Lake City, Utah, November 2012.
Copyright © 2012 John Wiley & Sons, Ltd.
Concurrency Computat.: Pract. Exper. 2013; 25:918–931 DOI: 10.1002/cpe