developing a performance model for the simulation stage by a semiâempirical approach ... Checking every spike event for its relevance for the. VP (part of spike ...
Performance Model for Large–Scale Neural Simulations with NEST Wolfram Schenck, Yury V. Zaytsev, Abigail Morrison
Andrew V. Adinetz, Dirk Pleiter
SimLab Neuroscience — Bernstein Facility for Simulation and Database Technology J¨ulich Supercomputing Centre (JSC) Institute for Advanced Simulation, J¨ulich Aachen Research Alliance Forschungszentrum J¨ulich Forschungszentrum J¨ulich, 52425 J¨ulich, Germany 52425 J¨ulich, Germany Email: {w.schenck,zaytsev,morrison}@fz-juelich.de Email: {a.adinets,d.pleiter}@fz-juelich.de I.
I NTRODUCTION
NEST is a simulator for large networks of spiking point neurons for neuroscience research [1]. It runs well both on single–core machines as well as on supercomputers with several hundred thousands of cores. A typical NEST simulation consists of two stages: first the network is wired up and connections (synapses) between neurons are established (“build stage”), and second the dynamics of the whole network is simulated (“simulation stage”). Our work aims at developing a performance model for the simulation stage by a semi–empirical approach [2]. We collected measurements of the runtime performance of NEST under varying parameter settings, and subsequently fitted a theoretical model to this data. This model is intended to explain the computation time tSIM required by the simulation stage of NEST. Performance modeling has two main advantages: first it allows predictions for any simulation size without the need for new profiling runs, second it helps to identify spots in the code requiring algorithmic improvements and to predict the impacts of optimizations. II.
T HEORETICAL M ODEL
NEST runs in a distributed way over M MPI processes and within each process over T OpenMP threads. Each unique thread in the simulation is called a “virtual process” (VP). Neurons are distributed evenly over VPs. For what follows we assume that NEST simulates a random balanced network which contains N neurons and both static and adaptive synapses (STDP) [3]. Random external input is provided to the network by Poisson generators within each process; the simulated network quickly converges to an asynchronous irregular state with a mean per–neuron spike firing rate F . The NEST simulation stage consists of the following three steps which are repeated in a loop for each communication interval: (1) Process-internal routing of spike events to their target neurons (incl. synapse update); (2) updating of neuronal states (incl. spike generation); (3) exchange of spike events between MPI processes. In the source code of these three steps, the following complexities and simulation time components were identified: • • •
Update of the neuron and synapse states: tupdate ∈ O( MNT ) Main loop of spike routing within each VP: tdeliver main ∈ O(M T ) Checking every spike event for its relevance for the VP (part of spike routing): tall spikes ∈ O(F N )
•
• •
Processing relevant spikes within each VP (also part of spike routing) (K is the connection fan-in of each neuron; see also [4]):� � � trelevant spikes ∈ O 1 − exp − MKT F N Generating random external input (spikes) to neural N ) network: tpoisson ∈ O( M MPI communication (S is the size of the per–process send buffer): tCOM ∈ O(SM )
The complete model defines the estimated overall simulation time b tSIM as b tall spikes tSIM = b tupdate + b tdeliver main + b b b + trelevant spikes + tpoisson + tCOM (1) N = p0 + p1 M T + p2 F N M �� �T � K N + p3 1 − exp − F N + p4 + p5 SM MT M with p = (p0 , . . . , p4 ) being the vector of free parameters for model fitting. p5 is set to a fixed value based on NEST MPI communication benchmarks to limit the number of free parameters. III.
E XPERIMENTAL D ESIGN
We carried out a series of simulation runs on the JUQUEEN supercomputer1 at Forschungszentrum J¨ulich to obtain simulation times tSIM depending on M, T, and N (each compute node of JUQUEEN hosted exactly one MPI process). The “10kcollaps” branch of NEST was used in these runs to simulate random balanced networks as described in Sect. II with a constant fan–in of K = 11250 synapses per neuron. The simulated biological time was set to 500 ms, the average spike frequency F per neuron amounted to values around 7 Hz for this period (regardless of the network size). For the time measurements the results of 10 MPI processes per run were recorded and later averaged. The following parameter settings were used: • •
M ∈ {32, 128, 512, 2048, 4096, 8192, 16384} T ∈ {4, 8, 16, 32, 64}
Furthermore, the number of neurons per process was varied with two different settings: Close to maximum memory filling 1 Each compute node of JUQUEEN is equipped with a 16-core PowerPCA2 CPU and 4-fold SMT (64 hardware threads) and 16 GB of RAM. The max. number of usable compute nodes amounts to 28,672.
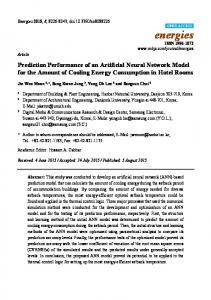
(a) Comparison between estimated and measured simulation times Fig. 1.
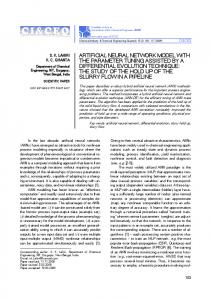
(b) Estimated contributions to the simulation time
Results of model fitting on the training data (only shown for T ∈ {8, 16, 64}) and on the validation runs.
on each node (max–fill), and close to half of this value (half– fill). This is reflected by the parameter NM which denotes the number of neurons per process (the overall number of neurons is computed as N = NM · M ). M , T , and NM were varied in a (nearly) full factorial design, thus the “training set” has a size of ntrain = 69 examples. The theoretical model for b tSIM (M, T, NM ) was fitted to the empirical data tSIM (M, T, NM ) by non–linear least–squares optimization with the Levenberg–Marquardt algorithm. Furthermore, we carried out a model validation on an independent set of data collected some months before with various values for M , T , and NM . These validation runs include data for the full usage of JUQUEEN (M = 28672), thus we are in the extrapolation area of our model. The size of this test set is ntest = 13. IV.
V.
The theoretical performance model was successfully fitted to the training data. The main complexities derived from the NEST source code can explain the runtime behavior for the most part. As future work we will refine the performance model to incorporate more simulation parameters and carry out fine–grained profiling of the internal processes within NEST for detailed model validation. For further NEST development, we can derive two main conclusions: (1) For small simulations (e.g., on workstations or small compute servers), simulation times may be further reduced by optimizing the update steps in NEST (e.g., through vectorization or the usage of GPUs); (2) for large simulations on supercomputers, the bottleneck is the process-internal spike routing; to achieve an improvement in this area, considerable algorithmic changes may be necessary. ACKNOWLEDGMENTS
R ESULTS
After fitting the theoretical perf. model in (1) to the data of the training set, the coefficient of determination amounts to 2 2 Rtrain = 0.996 on the training data and to Rtest = 0.984 on the validation runs. A detailed comparison is shown in Fig. 1a. The model estimates the measured values very precisely, only for very large networks a slight deviation is visible. This is also noticable in the validation runs, where the max. prediction error amounts to ca. 10% (relative to the measured values).
This work was funded by the Helmholtz Association through the Portfolio Theme ”Supercomputing and Modeling for the Human Brain” and supported by the VSR computation time grant JINB33 on the supercomputer JUQUEEN at the J¨ulich Supercomputing Centre. We warmly thank M. Diesmann (INM-6, FZ J¨ulich) for his support and M. Schmidt (INM-6, FZ J¨ulich) for the validation data.
R EFERENCES [1]
Figure 1b illustrates the estimated contribution of each component within the NEST simulation stage to the overall simulation time. The update component is only relevant for small simulations (small M ) with a small number of threads T whereas the components related to VP-internal spike routing completely dominate in large simulations where they lead to less–than–ideal weak scaling behavior. This is also clearly visible in the validation runs 11–13 which used the whole JUQUEEN supercomputer (M = 28672).
C ONCLUSION AND O UTLOOK
M. O. Gewaltig and M. Diesmann, “NEST (Neural Simulation Tool),” Scholarpedia, vol. 2, no. 4, p. 1430, 2007. [2] T. Hoefler, W. Gropp, W. Kramer, and M. Snir, “Performance modeling for systematic performance tuning,” in State of the Practice Reports, ser. SC ’11. New York, NY, USA: ACM, 2011, pp. 6:1–6:12. [3] A. Morrison, A. Aertsen, and M. Diesmann, “Spike–timing dependent plasticity in balanced random networks,” Neural Computation, vol. 19, no. 6, pp. 1437–1467, 2007. [4] S. Kunkel, T. C. Potjans, J. M. Eppler, H. E. Plesser, A. Morrison, and M. Diesmann, “Meeting the memory challenges of brain–scale network simulation,” Frontiers in Neuroinformatics, vol. 5, 2012, article 35.