Aug 30, 2005 - To rectify this situation, the UPC group at the University of Florida has ..... of 0x69000000 for a 32-bit integer cache miss and 0x69000001 for a ...
Proposal: Performance Tool Interface for Unified Parallel C (v1.1) Adam Leko, Hung-Hsun Su, Bryan Golden, Hans Sherburne, Alan D. George {leko, su, golden, sherburne, george}@hcs.ufl.edu UPC Group, HCS Lab University of Florida August 30, 2005 Abstract Due to the wide range of compilers and the lack of a standardized performance tool interface, writers of performance tools face many challenges when incorporating support for Unified Parallel C (UPC) programs. This document presents a preliminary specification for a standard performance tool interface that attempts to be flexible enough to be adapted into current UPC compiler and runtime infrastructures with little effort, while allowing performance analysis tools to gather much information about the performance of UPC programs. We hope that the interface outlined in this document will be considered for inclusion into the UPC language specification.
1
Introduction
The Unified Parallel C (UPC) [1] language offers parallel programmers several advantages over other parallel languages that require programmers to manually handle communication between nodes. The global address space presented to UPC programmers provides them with a convenient environment similar to threaded programming on serial machines, but comes at a cost of increased complexity in UPC compilers and runtime systems. This gives parallel programmers a much-needed increase in productivity; however, since UPC compilers handle much of the low-level communication and work distribution details of UPC programs, it can be difficult or impossible for UPC programmers to determine how a given UPC program will perform at runtime. Recent research has indicated that performance tuning for current generations of UPC compilers is critical in order to achieve comparable performance to MPI code, especially on cluster architectures [2]. Although recent work has produced several techniques to improve the performance of UPC compilers by taking advantage of specific architectures [3], employing TLB-like lookup tables for remote pointers [4], and applying optimizations like message aggregation [5], the UPC programmer’s ability to exploit locality remains the most influential factor on overall UPC program performance. The importance of performance analysis for UPC programs has also been aggravated by the lack of performance analysis tools supporting UPC. The relative newness of the UPC language compared with other programming libraries such as MPI is partly responsible for the lack of tool support, but tool developers face a major roadblock even if they wish to add UPC support in their tools: the UPC specification currently does not define a standard performance tool interface that can be used to portably gather performance information from UPC programs at runtime. The extensive and almost exclusive use of the MPI profiling interface [6] by MPI performance tools illustrates the usefulness of a common performance tool interface. To rectify this situation, the UPC group at the University of Florida has developed a preliminary performance tool interface to accompany the UPC specification. In a nutshell, we are trying to help users answer the question “Why does my UPC program have bad performance?” by providing tool developers with a consistent interface so that their performance tools can help users identify and fix performance bottlenecks. We have examined several existing UPC implementations and have attempted to devise an interface that will have a minimum impact on existing compilers that target both shared-memory and distributed architectures. Since UPC is somewhat similar in spirit to OpenMP, we have tried to incorporate many ideas used for the OpenMP profiling interface [7] in our proposal. Note: In order to keep the language of this document concise, we have adopted the following terminology. “UPC” refers to the Unified Parallel C language as defined by the current language specification (v1.2 at the time of writing).
1
int MPI_Send(void *buf, int count, MPI_Datatype datatype, int dest, int tag, MPI_Comm comm) { int val; Record_message(comm, dest, count, buf); Timer_start("MPI_Send"); val = PMPI_Send(buf, count, datatype, dest, tag, comm); Timer_end("MPI_Send"); return val; }
Figure 1: Example wrapper function “Users” refers to individuals using a parallel language such as UPC. “Developers” refers to individuals who write parallel software infrastructure such as UPC compilers. “Tools” refers to performance analysis tools such as Vampir, TAU, or KOJAK, and “tool developers” refers to individuals who develop performance analysis tools.
2
Current challenges for UPC tool developers
MPI and other library-based parallel language extensions generally use a technique called interposition, which make developing “wrapper” libraries very straightforward. In the interposition technique, all library functions are available under two different names, usually by using weak bindings. When a tool developer wants to gather information about how much time is spent in a particular library call, they create their own version of the library that invokes the original function by using its alternate name and record how much time is taken for that function call. For example, Figure 1 illustrates a typical wrapper that can be used to record information about calls to MPI_Send for MPI programs. MPI tool developers can rely on the existence of a PMPI_Send binding in every MPI implementation which has the same functionality as the original MPI_Send function. Tool developers may place any code they wish in their wrapper library, which allows them to support both tracing and profiling. In addition, users of MPI tools need only to relink against a profiled MPI library in order to collect information about the behavior of MPI functions in their code. UPC tool developers are not as fortunate. Since UPC is not merely comprised of library functions, the wrapper approach mentioned above does not present a tractable or even valid strategy for recording the behavior of UPC programs. Even for UPC implementations that encapsulate much behavior in library functions (such as Berkeley UPC [8] with GASNET [9]), no weak binding or interposition support is currently available in these libraries that could be used to write wrappers. In addition, different UPC compilers use vastly different techniques to translate UPC code into executables, ranging from source-to-source transformations to more direct compilation techniques. Therefore, tool developers are left with two options for collecting information about a UPC program: binary instrumentation and source instrumentation. At first glance, binary instrumentation seems like a feasible instrumentation strategy. Libraries like DynInst [10] make it relatively easy to instrument a user’s program at runtime; since the user’s source code needs no modification this reduces the overhead imposed upon users. However, in order to insert instrumentation code, binary instrumentation requires tool developers to explicitly state exactly where they wish to insert their code in an executable. Since existing UPC compilers use both source-to-source transformations and direct compilation to translate UPC code into an executable, binary instrumentation for UPC programs will have to be added on a compiler-by-compiler basis after an extensive analysis of how that particular compiler translates every UPC construct into executable code. This presents a severe maintenance problem for tool developers: what happens when developers change their implementation internals between versions? In short, tool developers adopting a binary instrumentation strategy will have to spend a large portion of their time keeping up with the internal workings of each UPC compiler they wish to support. In addition, binary instrumentation makes it very difficult to relate performance information back to actual lines in source code in a platform-independent way. Another drawback to binary instrumentation is the possibility that choosing instrumentation points in UPC binaries may be impossible without proprietary information from developers of commercial UPC compilers. Finally, while DynInst provides great functionality for tool developers wishing to use binary instrumentation, there are no plans
2
#include "upc.h" shared int c = 44; shared int f = 2; int main() { f = ((2*c + 3) - (c + 2) == c) ? 4 : (c = 0); return 0; }
Figure 2: UPC code with a complicated expression to port it to Cray architectures that are not based on Linux, such as the Cray X1. The X1 and X1E provide excellent vehicles for running UPC code [3], so excluding tool support for these architectures would be disappointing to say the least. Source instrumentation affords the most flexibility to the tool developer. With source instrumentation, a tool developer can record any data they wish, provided that the information can be extrapolated from a user’s code. However, with the increasing complexity of UPC runtime systems and the use of techniques such as remote reference caching, using source instrumentation alone limits a tool developer’s ability to find out when certain events actually occur instead of when the tool developer thinks they might occur. UPC’s relaxed memory model further blurs the distinction between the sequence of actions specified in the UPC source code and what actually happens at runtime. Source instrumentation also places a higher technical burden on the tool writer. Since UPC allows users to treat remote pointers in the exact manner as built-in C pointers, source code instrumentation systems must be able to perform a full parse of a user’s UPC source code so that remote variable accesses can be differentiated from local variable accesses. Several complications arise when doing a full parse of a C program, including variable name shadowing (which implies that the parser must fully implement scoping rules), complicated user macros, and semantic analysis of complicated expressions involving both local and shared variables. In fact, even parsing straight ANSI C, a subset of the current C language specification, becomes difficult due to a few grammatical ambiguities, such as the “declaration/expression” problem [11]. In addition, most “real-world” code also uses compiler-specific extensions, such as those used by GCC and Microsoft’s compilers. Creating a parser that supports these extensions has been found to be very time-consuming and error-prone [12]. To give a concrete example of the possible difficulties in parsing a complicated expression, consider the code in Figure 2. Depending on the algorithms used to translate the UPC code into machine code, several different sequences of remote read and write operations are possible. In addition, compilers which can do complicated strength reductions may be able to reduce the first line of main to f = 0; c = 0;, which drastically reduces the number of remote memory references. Neither source nor binary instrumentation represents an optimal path for tool developers wishing to add UPC support to their tools. The availability of a standard performance tool interface for UPC compiler and runtime systems would make tool developer’s jobs much easier and would allow them to easily add support for any compiler that implements the interface. We describe our ideas for such an interface in the next section.
3
Proposed performance tool interface
In order for a performance tool interface to be effective, it must meet several criteria and strike a balance between functionality for tool developers and ease of implementation for compiler developers. This section outlines a performance tool interface for UPC programs that tries to follow these design guidelines: • Flexibility – For the interface to be useful, it must be flexible enough to support several different performance analysis methods. For example, some tools rely on capturing full traces of a program’s behavior, while others calculate statistical information at runtime and display it immediately after a program finishes executing. Our performance tool interface should support these two main modes of operation, and should not overly restrict the tool developer’s analysis options.
3
UPC application code
UPC compiler and runtime systems
User events
System events
UPC performance tool interface
Event notifications
Performance tool
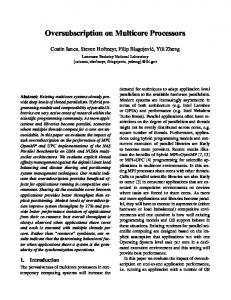
Figure 3: UPC performance tool interface interactions • Ease of implementation – It is imperative to have the full support of UPC compiler developers for the performance tool interface. There are many existing UPC compilers that translate UPC code into executables using a wide variety of methods. We do not wish to alienate compiler writers by making our performance tool interface difficult to implement for a small group of unlucky compilers. In addition, many UPC compilers are proprietary, which limits the amount of help we can give in implementing the performance tool interface. Therefore, our interface should be as implementation-neutral as possible. • Low overhead – Our performance tool interface should not drastically affect overall runtime of profiled UPC programs. Performance data collected for programs that do not exhibit similar behavior as their unprofiled counterparts is not very useful to users. Due to the fine-grained nature of most UPC programs, we do expect some perturbation of overall execution time for profiled programs. However, at every opportunity we wish to engineer solutions that minimize the effect instrumentation has on a user’s program. • Usefulness – Performance tools need enough information to analyze so that they can present the user with potential problem areas in their application codes. Specifically, we feel it is absolutely necessary to incorporate source code correlation for data reported to the user down to the source line level. The overall workflow for using the performance tool interface proceeds as follows. First, the user compiles their code using special compilation flags that instruct the compiler to instrument their code for use with a UPC performance tool, then links their code against a library provided by tool developers. When the user runs their program, the user’s program and UPC runtime system interact with the performance tool through the UPC performance tool interface, and the performance tool records appropriate performance data. The UPC performance tool interface must define a way for UPC application code, UPC compiler and runtime systems, and performance tools to interact with each other. To accomplish this, the interface uses an event-based model to capture the behavior of a user’s UPC application. As a program executes, the performance tool receives event notifications that tell it what action the program is currently performing. These events can come from UPC application code directly (user-level events), or from the UPC compiler and runtime systems (system-level events). User-level events allow the user to pass application-specific information to the performance tool, such as which phase of computation their program is currently in. System-level events allow the UPC compiler and runtime system to inform the performance tool about events related to the UPC language, such as when communication takes place and the duration spent in upc_forall loops. Given this, the purpose of the UPC performance tool interface is therefore 4
... shared int a;
pupc_event_notify(...)
a = 4; ... Tool developer code UPC program
Figure 4: Logical structure of event notifications to define a standard way for a performance tool to receive events from UPC application code and UPC compiler and runtime systems, as shown in Figure 3. In the UPC performance tool interface, the interaction between these entities is accomplished by using a function callback, similar to function callbacks commonly used in graphical applications. A single function residing in the performance tool code, pupc_event_notify, is called each time a user or a system event occurs. In this manner, the callback function serves as the method for event notifications. However, unlike a traditional callback, the function that is called cannot be chosen at runtime; instead, for simplicity and efficiency, it must be chosen at link time. The term “callback” still is appropriate because it conveys the notion that the performance tool code is invoked during runtime by an outside entity (in this case, a UPC program or a UPC runtime system). More details about the structure of the event notifications are discussed in Section 3.1, and the specifics of each system-level event are discussed in Section 3.2. Section 3.3 discusses a method for passing user-level events to performance tools. Mechanisms for controlling instrumentation and data collection are discussed in Section 3.4. Finally, since performance tools generally require an accurate measure of global time, the interface includes functions that can be used to measure the time taken between events. These functions are discussed in Section 3.5.
3.1
Event notification structure
The UPC performance tool interface uses a callback model to notify a performance tool when events happen during runtime. This affords a very flexible interface to both tool developers and compiler developers, even in the face of aggressive optimizations and differing implementations. The event-based model avoids the problems of the need for intimate details of every UPC compiler and runtime system as discussed before with strict binary instrumentation by defining a standard, flexible way of notifying a performance tool when actions occur at runtime. Very accurate sourcelevel information can be preserved throughout aggressive statement reorderings, as long as an optimizing compiler keeps a map of original source code locations. The logical structure of the event notifications is shown in Figure 4 for a simple UPC program that performs one write to a single shared variable. In the diagram, time increases as you travel downwards. The simple program shown declares a shared variable and assigns a value to it. At runtime, two events are generated by the UPC runtime system and sent to the pupc_event_notify function contained in the performance tool (in the library code that the user links against). These two events are represented by the arrows in the figure, and correspond to the start and finish of the shared variable assignment. The pupc_event_notify function will be called before and after assignment takes place. It does not matter which entity (UPC program code, UPC runtime system) performs the call; the only requirement is that the pupc_event_notify function gets called before and after the assignment takes place. In most real systems, the callbacks would occur from instrumentation code inserted into the user’s original program. The arguments to the pupc_event_notify function also include source-level information and a unique identifier that allows tool developers to distinguish between different types of events. It is important to note that only a single function is invoked during the callback, and this function has the predetermined name pupc_event_notify. This callback model allows for tool developers to discard events they are not interested in, and also allows the same tool code to be used even after features are added to the UPC language. When new features are added, older versions of tool code will still continue to work as long as unknown event identifiers are ignored. The singular function callback does not restrict the performance tool interface as long as the C vararg
5
mechanism is used, which to our knowledge does not limit portability in any significant way.1 The only drawback to this approach is that it requires extra CPU cycles to process the callback (the additional case statement and vararg processing), but the overhead should be minimal. The full signature for the pupc_event_notify function is shown below: void pupc_event_notify(unsigned int event_id, pupc_location* loc, ...); It should be assumed that the event_id variable be at least 32 bits long. This definition should reside in a file called pupc.h which should be in the default include path of the UPC compiler. The pupc.h file should also contain definitions for the pupc_location struct, and macros that map the symbolic names of events to their appropriate values (see Section 3.2 for the names and values). The format of the pupc_location struct is shown below: struct pupc_location { const char* source_file; unsigned int start_line; unsigned int start_col; void* util; }; The function of this struct is to uniquely identify the original source code location that was responsible for the event that caused a callback. If a compiler has reordered or restructured the original source for better performance, this should reflect the original source code line responsible for this callback as accurately as possible. The struct also contains a void* location that may be used by tool developers to store a pointer to a timer or other data structure. The structs should be statically allocated such that their memory locations could be used as a unique identifier for use with a dictionary-like data structure. To ease development for tool developers, the pupc_event_notify function should be allowed to contain any valid UPC code. However, this function and any related support functions must be compiled with the same compiler that will be used to compile a user’s UPC code, without using any special compilation flags defined in Section 3.4. Since a few existing UPC compilers are multithreaded, all code in the pupc_event_notify function and related support functions must be thread-safe, and only the thread that is activated during the callback may execute code that uses the UPC runtime system. In order to support extension of the UPC performance tool interface by users and compiler developers, ranges for valid event identifiers should be established so that no conflicts arise from user- or compiler-specific event identifiers. All valid system-level events resulting from actions defined in the UPC specification should be in the range of 0x00000000 to 0x5FFFFFFF. The range 0x60000000 to 0xBFFFFFFF should be reserved for events specific to a UPC compiler/runtime system. For example, some UPC systems support caching of remote shared variable accesses; such systems may assign an identifier of 0x69000000 for a 32-bit integer cache miss and 0x69000001 for a 32-bit integer cache hit. Lastly, the event identifier range from 0xC0000000 to 0xFFFFFFFF should be reserved for user-level events. A more formal method of acquiring user-level event identifiers and associating symbolic names with them in a performance tool is described in Section 3.3.
3.2
System-level events
In the following subsections, a standard set of events are presented that every UPC compiler and runtime system should support. Each event shown is assigned an identifier, and the details of the rest of the arguments from the vararg ... in the pupc_event_notify function are detailed. Event identifiers are assigned to each event type using the following convention: the first two hex digits are used to group similar events together, the next four hex digits are used to group events related to a single action together, and the final two hex digits are used to distinguish between different events resulting from a single action (e.g., start and event events). 3.2.1
Initialization and completion events
Table 1 shows events defined by the UPC performance tool interface related to the beginning and end of a UPC program’s execution. 1 Please
let us know if not!
6
Symbolic name
Event identifier
vararg arguments
int* argc, char*** argv PUPC_GLOBAL_EXIT 0x00000100 int status Table 1: Execution start and stop events PUPC_INIT
0x00000000
The PUPC_INIT event should occur just after the UPC runtime library has been initialized so that tool developers may execute any initialization code they require. This event always has a NULL for the pupc_location* callback argument. The extra arguments for this event are pointers to the argc and argv arguments from the main function, which allows performance tool code to process command-line arguments. Additionally, the PUPC_GLOBAL_EXIT event should occur at the end of program execution, even if the user makes no calls to upc_global_exit (in which case the pupc_location* pointer will be NULL). This enables tool developers to ensure that any cleanup code their tools require will always be called just before a UPC program finishes execution. 3.2.2
Synchronization events
Table 2 shows events defined by the UPC performance tool interface related to synchronization constructs in the UPC language specification. Symbolic name Event identifier vararg arguments PUPC_NOTIFY_START 0x01000000 int named, int PUPC_NOTIFY_END 0x01000001 int named, int PUPC_WAIT_START 0x01000100 int named, int PUPC_WAIT_END 0x01000101 int named, int PUPC_BARRIER_START 0x01000200 int named, int PUPC_BARRIER_END 0x01000201 int named, int PUPC_FENCE_START 0x01000300 (none) PUPC_FENCE_END 0x01000301 (none) Table 2: Synchronization events
expr expr expr expr expr expr
These events occur before and after execution of the notify, wait, barrier, and fence synchronization statements. The first extra argument to the notify, wait, and barrier start and stop events should be true (nonzero) if the user has provided an integer expression for the corresponding notify, wait, and barrier statements. In this case, the expr variable should be set to the result of evaluating that integer expression. If the user has not provided an integer expression for the corresponding notify, wait, or barrier statements, the named argument should be false (zero) and the value of expr should be undefined. 3.2.3
Work-sharing events
Table 3 shows events defined by the UPC performance tool interface related to work-sharing constructs defined in the UPC language specification. Symbolic name Event identifier vararg arguments PUPC_FORALL_START 0x02000000 (none) PUPC_FORALL_END 0x02000001 (none) Table 3: Work-sharing events
7
These events occur before and after upc_forall constructs are executed. The timing of these events can help users determine if the affinity expression in the upc_forall construct is resulting in an even work distribution among different threads. 3.2.4
Library-related events
Table 4 shows events defined by the UPC performance tool interface related to the library functions defined in the UPC language specification. Symbolic name PUPC_LOCK_START PUPC_LOCK_END PUPC_UNLOCK_START PUPC_UNLOCK_END PUPC_LOCK_ATTEMPT_START PUPC_LOCK_ATTEMPT_END PUPC_LOCK_INIT_START PUPC_LOCK_INIT_END PUPC_ALL_LOCK_ALLOC_START PUPC_ALL_LOCK_ALLOC_END PUPC_GLOBAL_LOCK_ALLOC_START PUPC_GLOBAL_LOCK_ALLOC_END PUPC_LOCK_FREE_START PUPC_LOCK_FREE_END PUPC_MEMCPY_START
PUPC_MEMCPY_END
PUPC_MEMGET_START
PUPC_MEMGET_END
PUPC_MEMPUT_START
PUPC_MEMPUT_END
PUPC_MEMSET_START
PUPC_MEMSET_END
Event identifier 0x03000000 0x03000001 0x03000100 0x03000101 0x03000200 0x03000201 0x03000300 0x03000301 0x03000400 0x03000401 0x03000500 0x03000501 0x03000600 0x03000601
vararg arguments upc_lock_t* lck upc_lock_t* lck upc_lock_t* lck upc_lock_t* lck upc_lock_t* lck upc_lock_t* lck upc_lock_t* lck upc_lock_t* lck (none) (none) (none) (none) upc_lock_t* lck upc_lock_t* lck shared void* dst, shared const void* 0x03000700 size_t n shared void* dst, shared const void* 0x03000701 size_t n void* dst, shared const void* 0x03000800 size_t n void* dst, shared const void* 0x03000801 size_t n shared void* dst, const void* src, 0x03000900 size_t n shared void* dst, const void* src, 0x03000901 size_t n shared void* dst, int c, 0x03000A00 size_t n shared void* dst, int c, 0x03000A01 size_t n Table 4: Library-related events
src,
src,
src,
src,
These events stem directly from the UPC library functions defined in the UPC specification. The vararg arguments for each event callback mirror those defined in the UPC language specification. 8
3.2.5
Direct shared variable access events
Table 5 shows events defined by the UPC performance tool interface related to direct shared variable accesses. Symbolic name
Event identifier
vararg arguments
void* dst, shared const void* src, PUPC_STRICT_GET_START 0x04000000 size_t n, const char* c_type, const char* c_name void* dst, shared const void* src, size_t n, int relaxed, PUPC_STRICT_GET_END 0x04000001 const char* c_type, const char* c_name void* dst, shared const void* src, size_t n, PUPC_RELAXED_GET_START 0x04000002 const char* c_type, const char* c_name void* dst, shared const void* src, size_t n, int relaxed, PUPC_RELAXED_GET_END 0x04000003 const char* c_type, const char* c_name shared const void* dst, void* src, size_t n, PUPC_STRICT_PUT_START 0x04000100 const char* c_type, const char* c_name shared const void* dst, void* src, size_t n, PUPC_STRICT_PUT_END 0x04000101 const char* c_type, const char* c_name shared const void* dst, void* src, size_t n, PUPC_RELAXED_PUT_START 0x04000102 const char* c_type, const char* c_name shared const void* dst, void* src, size_t n, PUPC_RELAXED_PUT_END 0x04000103 const char* c_type, const char* c_name Table 5: Direct shared variable access events
These events occur whenever shared variables are assigned to or read from using the direct syntax (not using the upc.h library functions). The arguments to these events mimic those of the upc_memget and upc_memput event callback arguments, but differ from the ones presented in the previous section because they only arise from accessing shared variables directly (e.g., the code shown in Figure 4). If the memory access occurs under the strict memory model, the PUPC_STRICT events are sent; otherwise the PUPC_RELAXED events are sent. The final two arguments,
9
c_type and c_name, are the character string representations of the shared variable’s name and type that caused the event. Encoding the variable’s type into the callback allows the use of only eight events for all shared variable accesses, instead of requiring four events for each different type of variable. 3.2.6
Function events
Table 6 shows events defined by the UPC performance tool interface related to user functions. Symbolic name PUPC_USERFN_START PUPC_USERFN_END
Event identifier vararg arguments 0x05000000 const char* funcname 0x05000001 const char* funcname Table 6: Function events
These events occur when a user function starts and finishes executing. The funcname argument specifies the character string representing which function is executing. While these events could be considered user-level events, they are included as system-level events because the occur from constructs provided by the UPC language specification (namely, function definitions). Note that this instrumentation will become very expensive when a user’s program contains a lot of “lightweight” functions that are called repeatedly. In this case, the user should use the mechanisms described in Section 3.4 to prevent instrumentation of their lightweight functions.
3.3
User-level events
While instrumenting all UPC constructs in UPC code can shed light on a program’s performance, there are undoubtedly groups of code that can be logically grouped together in application-specific ways. For instance, a program may be split into several phases, including an initialization phase and several computation phases. The performance tool interface includes a set of functions that allow users to track this time separately and associate user-friendly names with the recorded events. The signatures for these functions are shown below: unsigned int pupc_create_event(const char* name); void pupc_event_start(unsigned int evntid, ...); void pupc_event_end(unsigned int evntid, ...); The pupc_create_event function generates a unique event identifier (in the range of valid user events) and returns it in the form of an unsigned integer that is at least 32 bits long. This function also takes an argument that gives a user-friendly name to the event, which should be used by a performance tool when displaying performance information about this event start and end pair. The pupc_start and pupc_end functions are placed before and after the section of code the user is interested in, and are translated into pupc_event_notify calls with appropriate pupc_location* instances during compilation by the UPC compiler. The rest of the arguments to the start and end calls (the vararg arguments) are reserved for tool-specific purposes. The pupc_create_event function prototype should reside in a file named pupc.h, but this function should only be defined in the tool developer library and not the UPC system libraries. In summary, users place pupc_create_event, pupc_start, and pupc_end calls in their code. Tool developers provide a definition for pupc_create_event, and UPC compilers translate the pupc_start and pupc_end function calls into corresponding pupc_event_notify calls.
3.4
Instrumentation and measurement control
This section presents methods that allow users to reduce the overhead of running instrumented versions of their UPC programs. Any performance tool interface will undoubtedly introduce runtime overhead for any given UPC program, especially for fine-grained programs that use a large number of remote accesses. By incorporating standard methods for controlling instrumentation of a UPC program, users are not forced to endure additional overhead on productionlevel code. This effectively allows users to “compile out” unwanted instrumentation perturbations. Additionally, providing methods for turning data collection on and off in a performance tool allows users to optimize the amount of data collected at runtime by a performance tool.
10
3.4.1
Instrumentation control
Compilers should provide a --profile flag (or a -profile flag if using traditional flag styles) that controls whether a user’s program will be instrumented. When a user passes the --profile flag to the compiler, the compiler should instrument all constructs defined in Section 3.2. Additionally, compilers should also provide a mechanism that allows users to specify an inclusive list which events they wish to instrument, instead of instrumenting everything by default. This should be controlled by a --profile-partial flag that takes a single argument, which is a file containing a list of events that should be instrumented by the compiler (all other events should not be instrumented). This file should have a list of symbolic names that the user wishes the compiler to instrument their code for, excluding the START and END prefixes. As an example, a file with the following contents: PUPC_FORALL PUPC_MEMCPY instructs the compiler that only the upc_forall and upc_memcpy instructions should be instrumented. The compiler should always insert instrumentation code for the PUPC_INIT and PUPC_GLOBAL_EXIT events if one of the --profile or --profile-partial flags is used. Note that the --profile and --profile-partial flags are mutually exclusive. Similar to the --profile-partial flag, a --exclude-functions flag should also be available from the compiler. This flag should also take a single argument that is a file containing a list of functions that should not be instrumented with function entry/exit points when the --profile flag is also used. For example, a file with the following contents: lightweight_function1 lightweight_function2 instructs the compiler to not instrument lightweight_function1 and lightweight_function2 with PUPC_USERFN_START and PUPC_USERFN_END event callbacks. Any other UPC constructs in those functions will be instrumented, subject to the other rules outlined in this section. Finally, the compiler should provide directives that allow a user to specify regions of code that should not be instrumented. These directives should take precedence over any command-line arguments. The #pragma pupc off directive instructs the compiler not to insert any instrumentation code in a user’s program until it reaches a #pragma pupc on directive. This mechanism should be handled entirely by the UPC compiler during the compilation process. If the compiler reaches a #pragma pupc off directive while in the middle of instrumenting a prior construct, it should finish instrumenting the construct and not instrument any other constructs from that point on. 3.4.2
Measurement control
At certain points during runtime users may wish to turn off recording data to minimize the data collected during runtime. The UPC performance tool interface defines the following function that enables the user to instruct a performance tool to start and stop collecting data: void pupc_control(int on); This function should have a prototype in pupc.h, but should only be defined in the tool developer’s library. The on argument should be true (nonzero) when a user wishes a performance tool to record runtime events that the compiler has instrumented. This argument should be set to false (zero) when a user wishes a performance tool to discard all performance data. This mechanism should be handled entirely by the performance tool library, and should be ignored by the UPC compiler. This function call does not control instrumentation at all; rather, it controls when performance data should be recorded by a performance tool at runtime. By default, a performance tool should record all performance data unless it receives a pupc_control(0) call. Note that calling pupc_control while there are still pending END events (for example, inserting it inside a upc_forall loop) will cause a performance tool to have undefined behavior.
3.5
Timing functions
Access to global time information is vital for tool developers so that they may analyze the time differentials between events consistently across all UPC application threads. By including a few simple functions in the performance tool 11
interface, we allow tool developers to exploit any high-resolution global timers available on each platform without having to worry about portability. Indeed, even normal UPC programs could benefit from an easy-to-use global time function when using printfs to troubleshoot slow UPC code. The function signatures for these timing functions are shown below2 : pupc_tick_t pupc_ticks_now(); unsigned int pupc_ticks_to_us(pupc_tick_t ticks); unsigned int pupc_tick_granularityus(); The pupc_tick_t can be any type, but this type should be defined in pupc.h and should allow adding and subtracting pupc_tick_t as though it were a numeric type. The function prototypes above should also appear in the pupc.h file. The pupc_ticks_now function returns the current timer as represented by an instance of a pupc_tick_t variable. The pupc_ticks_to_us function converts a difference in pupc_tick_t variables to microseconds of wallclock time, and the pupc_tick_granularityus function returns the granularity of the wallclock in microseconds. All timing functions should be implemented by the UPC compiler or runtime system, and the UPC compiler should take care of linking appropriate platform-specific timing routines to the pupc_tick functions listed above during the compilation process. This should require no special compilation flags.
4
Examples
To provide a concrete example of how the UPC performance tool interface would work on actual programs, this section presents examples of how a compiler might translate a few simple UPC programs by adding appropriate calls to the profiling functions. We assume that the program will be compiled and run under the strict memory model, and that a source-to-source transformation will be used to insert instrumentation code following the same instrumentation rules under the --profile compiler flag discussed in section 3.4.1.
4.1
Example 1
Consider the simple UPC program main1.c listed below, with line numbers included for reference. 1 2 3 4 5 6 7 8
#include "upc_strict.h" shared int a; int main() { a = 33 / 3; return 1 + 1; } Based on the interface defined in the previous section, the instrumented source code containing hooks into the UPC performance tool interface will look like the following UPC code.
1 2 3 4 5 6 7 8 9 10 11 12
#include "upc_strict.h" #include "pupc.h" shared int a; struct pupc_location loc1; int main() { loc1.source_file = "main1.c"; loc1.start_line = 6; loc1.start_col = 3; pupc_event_notify(PUPC_INIT, NULL, NULL, NULL); 2 These
are heavily based on the Berkeley UPC high-resolution timing functions
12
13 14 15 16 17 18 19 20 21 22 23 24 25 26 27 }
int _tmp1 = 33 / 3; pupc_event_notify(PUPC_STRICT_PUT_START, &loc1, &a, &_tmp1, sizeof(int), "shared int", "a"); a = _tmp1; pupc_event_notify(PUPC_STRICT_PUT_END, &loc1, &a, &_tmp1, sizeof(int), "shared int", "a"); int _tmp2 = 1 + 1; pupc_event_notify(PUPC_GLOBAL_EXIT, NULL, _tmp2); return _tmp2;
The instrumented version starts off by sending a PUPC_INIT event to the pupc_event_notify callback function on line 12. Since this main function does not take in command-line arguments, we pass in NULL for the two extra arguments to the PUPC_INIT argument. We also see the assignment on line 19 has been instrumented, and that a PUPC_GLOBAL_EXIT event is inserted before the final return statement of the program. This example brings up an interesting issue: what happens when a “direct” shared variable access (a system-level event defined in Section 3.2.5) contains a nontrivial expression (line 19)? In this example, temporary variables are used to store the result of evaluating the expression so that the time taken for evaluating that expression is kept separate from the time needed to write to that shared variable. A temporary variable is also used in the return statement to avoid evaluating the return expression more than once, which may have unintended side effects.
4.2
Example 2
Consider the simple UPC program main2.c listed below, with line numbers included for reference. 1 2 3 4 5 6 7 8 9 10 11 12 13 14 15 16 17 18 19 20 21 22 23 24 25
#include "upc_strict.h" #include "pupc.h" shared int a[5*THREADS]; shared int b = 0; int c = 0; void myfn() { c++; } int main(int argc, char** argv) { int i; int evid = pupc_create_event("Custom event"); upc_fence; sleep(1); upc_forall(i = 0; i < 5*THREADS; i++; &a[i]) { a[i] = 44; if (MYTHREAD == 1) { b = i; } pupc_event_start(evid, NULL);
13
26 27 28 29 30 31 32 33 34 35 36 37 }
c--; pupc_event_stop(evid, NULL); } #pragma pupc off if (MYTHREAD == 1) { a[0]++; } #pragma pupc on return 0;
Based on the interface defined in the previous section, the instrumented source code containing hooks into the UPC performance tool interface will look like the following UPC code. 1 2 3 4 5 6 7 8 9 10 11 12 13 14 15 16 17 18 19 20 21 22 23 24 25 26 27 28 29 30 31 32 33 34 35 36 37 38 39
#include "upc.h" #include "pupc.h" shared int a[5*THREADS]; shared int b = 0; int c = 0; struct pupc_location loc1, loc2, loc3, loc4, loc5, loc6; void myfn() { pupc_event_notify(PUPC_USERFN_START, &loc6, "void myfn()"); c++; pupc_event_notify(PUPC_USERFN_END, &loc6, "void myfn()"); } int main(int argc, char** argv) { int i; loc1.source_file = loc2.source_file = loc3.source_file = loc4.source_file = loc5.source_file = loc6.source_file = "main2.c"; loc1.start_line loc2.start_line loc3.start_line loc4.start_line loc5.start_line loc6.start_line
= = = = = =
16; loc1.start_col = 3; 20; loc2.start_col = 3; 23; loc3.start_col = 7; 25; loc4.start_col = 5; 27; loc5.start_col = 5; 8; loc6.start_col = 1;
pupc_event_notify(PUPC_INIT, NULL, &argc, &argv); pupc_event_notify(PUPC_FENCE_START, &loc1); upc_fence; pupc_event_notify(PUPC_FENCE_END, &loc1); sleep(1); pupc_event_notify(PUPC_FORALL_START, &loc2); upc_forall(i = 0; i < 5*THREADS; i++; &a[i]) {
14
40 41 42 43 44 45 46 47 48 49 50 51 52 53 54 55 56 57 58 59 60 61 62 63 }
a[i] = 44; if (MYTHREAD == 1) { pupc_event_notify(PUPC_STRICT_PUT_START, &loc3, &b, &i, sizeof(int), "shared int", "b"); b = i; pupc_event_notify(PUPC_STRICT_PUT_END, &loc3, &b, &i, sizeof(int), "shared int", "b"); } pupc_event_notify(evid, &loc4, NULL); c--; pupc_event_notify(evid, &loc5, NULL); } pupc_event_notify(PUPC_FORALL_END, &loc2); if (MYTHREAD == 1) { a[0]++; } int _tmp1 = 0; pupc_event_notify(PUPC_GLOBAL_EXIT, NULL, _tmp1); return _tmp1;
Comparing the instrumented version to the uninstrumented version, we see that the myfn function has been instrumented (line 10 of the translated version). We also see the pupc_location structs initialized at the beginning of main (lines 19-28), and a PUPC_INIT event sent to the performance tool (line 30). The upc_fence on line 33 has also been instrumented, but since the PUPC_FENCE events do not require any additional vararg arguments, only the event identifier and the source location are passed as arguments. In a very similar manner, the entire upc_forall loop has been instrumented (lines 38-54). In this example, we assume that the assignment on line 40 (a[i] = 44;) was recognized by the instrumentor to be a local assignment and was not instrumented. Since the assignment on line 45 is always a remote assignment (by default, shared scalars are allocated on the first thread), that assignment has been instrumented (lines 42-46). The statement on line 51 is also instrumented; even though there is no UPC-related code here, the user has created a custom event and has inserted pupc_event_start and pupc_event_stop calls in the original source code. We see on lines 50 and 52 these calls have been translated to appropriate pupc_event_notify calls. Notice that both translated calls have the same event identifier. Performance tool code can distinguish user start and stop events by examining their differing pupc_location structs. We see that the code on lines 56-58 has not been instrumented at all. As discussed in Section 3.4.1, since the #pragma upc takes precedence over all other instrumentation controls, the remote increment on line 57 is not instrumented. Finally, we see on line 61 that the PUPC_GLOBAL_EXIT event is passed to the performance tool code. As before, we store the expression handed to the return statement so we do not inadvertently evaluate that expression more than once.
5
Open issues
One possible limitation of our interface is that it does not support time-based sampling. Time-based sampling of various aspects of a program’s execution can successfully be used to give a rough picture of a program’s runtime behavior. For example, sampling a program’s callstack and performing a statistical analysis of those callstack samples can identify program counter addresses (and thus lines of source code) that make a significant contribution to a program’s overall runtime. In a similar manner, sampling hardware counter values such as cache miss data can indicate portions of a program that have poor locality. While sampling can provide some valuable information about a program’s execution characteristics with relatively low overhead, many types of performance problems cannot be adequately captured 15
by sampled data. Communication bottlenecks, for instance, can be extremely difficult to fix when only sampled data is available because that data represents only a rough approximation of what actually happens during runtime. Additionally, fine-grained applications can require a high sampling frequency in order to accurately capture runtime behavior, which introduces large runtime overhead, thus making the sampled data inaccurate. This is not to say sampling represents a poor design choice when creating a performance tool. Several very popular sequential profiling tools including gprof have used a sample-based approach with much success. However, in the context of a performance tool interface, a sample-only approach is too restrictive to support the several different types of existing performance tools. For example, KOJAK relies on having a complete trace of a program’s execution available; an interface that only supports time-based sampling would prevent the KOJAK developers from adding UPC support. We are open to adding a standard sampling method to this performance tool interface proposal. Our current thoughts are that adding such a standard sampling interface might be difficult to accomplish, given the wide nature of existing UPC systems. Any ideas here are much appreciated! The example in Section 4.1 brings up the issue of how to handle instrumenting complicated expressions, especially ones that may contain several remote reads and writes. Ideally, the performance tool code should receive 2n events for every expression, where n is the number of remote accesses involved (2n for the start and stop pairs). However, for source-to-source compilers, this might pose a large technical hurdle, as complicated expressions might have to be simplified down into a series of simple expressions instead of being left as one complicated expression (as is usually the case from the source-to-source systems we have examined). For example, how should the code in Figure 2 be instrumented inside a source-to-source translation system? The example in Section 4.2 brings up an instrumentation choice related to user function calls (events from Section 3.2.6) – should a user’s function always be instrumented, or should all callsites to that function be instrumented instead? Finally, instead of using a single callback function, a pair of callback functions (say pupc_event_start and pupc_event_end) may be used instead. While this would not require much change to the specification other than reducing every start and end event to a single event identifier, it might be slightly more efficient at runtime because the vararg function arguments would only have to be passed in to the pupc_event_start function only. However, not all possible events come in pairs, so mapping events such as remote reference cache misses might be awkward.
6
Conclusions
We have presented a performance tool interface for UPC codes that should enable tool developers to easily add support for UPC programs in their tools. The interface is flexible enough to support both profiling and tracing UPC programs, and should impose only a slight overhead on compiler developers. We welcome (and encourage!) any constructive criticism of this proposal, especially from compiler writers. We have made some assumptions in this document, and if they are incorrect please let us know! We would like to work as closely as possible with UPC compiler developers to ensure that the UPC performance tool interface becomes incorporated into the UPC language specification.
Acknowledgements We would like to thank the many helpful comments we have received so far on the UPC developer and UPC library mailing lists.
References [1] T. A. El-Ghazawi, W. W. Carlson, and J. M. Draper, “UPC language specification (v 1.2),” June 2005. [2] C. Coarfa, Y. Dotsenko, J. Mellor-Crummey, F. Cantonnet, T. El-Ghazawi, A. Mohanti, Y. Yao, and D. ChavarrˇaMiranda, “An evaluation of global address space languages: Co-Array Fortran and Unified Parallel C,” in PPoPP ’05: Proceedings of the tenth ACM SIGPLAN symposium on Principles and practice of parallel programming, (New York, NY, USA), pp. 36–47, ACM Press, 2005.
16
[3] C. Bell, W.-Y. Chen, D. Bonachea, and K. Yelick, “Evaluating support for global address space languages on the Cray X1,” in ICS ’04: Proceedings of the 18th annual international conference on Supercomputing, (New York, NY, USA), pp. 184–195, ACM Press, 2004. [4] F. Cantonnet, T. A. El-Ghazawi, P. Lorenz, and J. Gaber, “Fast address translation techniques for distributed shared memory compilers.,” in IPDPS, IEEE Computer Society, 2005. [5] W.-Y. Chen, “Building a Source-to-Source UPC-to-C Translator,” Master’s thesis, University of California at Berkeley, 2005. [6] M. P. I. Forum, “MPI: A message-passing interface standard,” tech. rep., University of Tennessee, Knoxville, TN, USA, 1994. [7] B. Mohr, A. D. Malony, S. Shende, and F. Wolf, “Design and prototype of a performance tool interface for OpenMP,” J. Supercomput., vol. 23, no. 1, pp. 105–128, 2002. [8] P. Husbands, C. Iancu, and K. Yelick, “A performance analysis of the Berkeley UPC compiler,” in ICS ’03: Proceedings of the 17th annual international conference on Supercomputing, (New York, NY, USA), pp. 63–73, ACM Press, 2003. [9] D. Bonachea, “GASNet specification, v1.1,” tech. rep., University of California at Berkeley, Berkeley, CA, USA, 2002. [10] B. Buck and J. K. Hollingsworth, “An API for runtime code patching,” The International Journal of High Performance Computing Applications, vol. 14, pp. 317–329, Winter 2000. [11] B. A. Malloy and J. F. Power, “Program annotation in XML: a parser-based approach,” in WCRE 2002, Working Conference on Reverse Engineering, pp. 190–198, October 28 - November 1 2002. [12] G. C. Necula, S. McPeak, S. Rahul, and W. Weimer, “CIL: intermediate language and tools for analysis and transformation of C programs,” in Conference on Compiler Construction, 2002.
17