13th International Symposium on Nondestructive Characterization of Materials (NDCM-XIII) , 20-24 May 2013, Le Mans, France www.ndt.net/?id=15508
Phased Array Transducer for Non-Destructive Testing of Sandwich Honeycomb: C-scan Imaging, Skin Thickness Measurement and Detection of Delamination Elhadji Barra NDIAYE*, Naïm SAMET, Pierre MARECHAL, Hugues DUFLO** LOMC, UMR 6294 CNRS, Université du Havre, Le Havre, France Phone: +33 235217265; e-mail: (*)
[email protected], (**)
[email protected] Abstract Composites are nowadays increasingly used in industries such as aerospace, shipbuilding, automotive ... They are lightweight and have a very high specific stiffness, but defects such as delamination, inclusions may occur during their life cycle. Samples of sandwich honeycomb are tested using a 10 MHz central frequency phased array transducer constituted of 128 elements. Different defects are localized at the interface composite/honeycomb. These defects are due to the joint bond. Teflon inclusions are voluntary introduced in composite plate to evaluate the effectiveness of the experiment. The experiments illustrate that laminate defects are easily localized through a signal processing of all A-scans given by the phased array transducer. The concatenation of these A-scans processing gives a C-scan image where defects are clearly visible. In this work, we show the efficiency of phased array transducer for delamination detecting, thickness measurement and Cscan imaging of sandwich honeycomb composites. Keywords: bond strength evaluation, composite material properties, health monitoring, ultrasound, imaging.
1. Introduction The ultrasonic inspection of composite materials allows its acoustic characterization [1, 2]. Both bulk acoustic waves (BAW) or surface acoustic waves (SAW) can be used to inspect multilayer structures such a dense composite materials or sandwich honeycomb composite materials. Phased array technologies allow to extend the ultrasonic inspection of assembled materials [3]. In this paper, a 10 MHz center frequency phased array transducer is used to inspect the studied multilayer structure [4]. This phased array transducer is used to qualify the bonding of a honeycomb composite material. It is constituted of a dense carbon composite plate, a glue film and an aluminum honeycomb. Between the dense carbon composite plate and the honeycomb, a thin glue layer or air is ensuring the bonding of the structure. In order to fit the experiments, the electro-acoustic response is simulated using the convolution of the global reflection coefficient by the bandwidth of the transducer. This simulation permits us to identify the unknown parameters of the sandwich composite. In our case, a BAW diagnostic of the bond quality is performed at the interface composite-honeycomb. In this view, visualization of type A, B or C-scan are used to localize defects. Finally, guided Lamb wave (SAW) inspection is performed to evaluate attenuation within the composite plate during the propagation [5, 6]. Also, periodicity of the A0 mode decaying amplitude [7] and cells position are highlighted after applying some signal processing [8, 9].
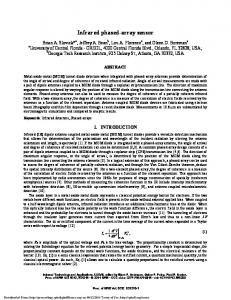
2. Experimental configuration 2.1 Setup A phased array transducer (PA) with center frequency fc = 10 MHz is used for the experiment. It includes 128 elements of length 7 mm and width 0.25 mm each. The distance between each element (pitch) is 0.5 mm. Each focal law consists of 32 elements that focus at the same time with a translation of one element. Therefore the Nfl = 97 focal laws result in a field inspection of Xfl = 48 mm length [4]. The measurement was performed using a Rexolite wedge and coupling gel. As illustrated by Figure 1, the sandwich material (i.e. upper skin of the
composite cell and the honeycomb aluminum) is inspected. Indeed the elementary honeycomb cells are observed. A film of adhesive ensures the junction between the composite skin and the honeycomb. s1r(t)
s2r(t)
s2r(t)
Rexolite
dR
Composite
dC d3
Honeycomb
Adhesive (a)
(b)
Figure 1: (a) Scheme of the honeycomb composite material and (b) experimental setup for the characterization.
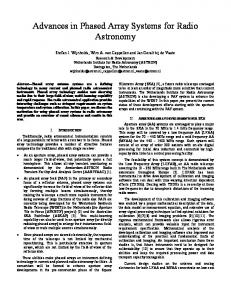
2.2 Material characterization Useful signals for the characterization of the composite plate are u1(t) and u2(t), corresponding to the first and second round trip in the thickness of the composite layer, respectively.
u2(t)
u1(t)
100 u1(t)
Rexolite
dR
A (%)
50
u2(t) 0
-50
Composite
dC
-100 16
17
18
19
20
21
t (µs)
(a)
(b)
Figure 2: (a) Configuration for the characterization of the composite material and (b) useful signals u1(t) et u2(t).
The spectra U1(f) and U2(f) corresponding to u1(t) and u2(t) echoes are respectively: U 1 ( f ) = A0 e − j ( k R 2 d R + k C 2 dC )TR / C RC / ATC / R (1) − j ( k 2d + k 4d ) U 2 ( f ) = A0 e R R C C TR / C RC / A RC / R RC / ATC / R where A0 is the reference amplitude, kR and kC are the complex wave numbers, dR and dC are the thicknesses of the Rexolite and composite layers, respectively. The Ti/j and Ri/j are the transmission and reflection coefficients respectively. The indexes {i/j} correspond to the interfaces {R/C}, {C/A}, {C/R} between the constitutive layers, i.e. Rexolite (R), composite (C), air (A). The transfer function W is a function of the complex wavenumber in the composite skin kC = ω/cC − jαC: U (f) (2) = e − j k C 2 dC RC / R RC / A W( f ) = 2 U 1( f )
where RC/R and RC/A are the reflection coefficients at the interfaces Rexolite/composite and composite/air, respectively. The composite skin properties cC and αC are the longitudinal acoustic wave velocity and attenuation in the composite, respectively. Their expressions can be extracted as follows: 2d C ω c ( f ) = C W Arg RC / R RC / A (3) α C ( f ) = 1 log RC / R W 2d C As a result, the acoustic properties of the composite skin are deduced (Figure 3) in the bandwidth of the transducer. The backscattered spectrum characteristics obtained with the fc = 10 MHz center frequency phased array are shifted from f = 2 MHz to 10 MHz. In a similar way, the acoustic properties of the Rexolite layers are measured (Table 1). 3300
800
3200 600 α C (Np/m)
cC (m/s)
3100 3000 2900
α
C,exp
α
C,fit
(f)
(f)
400
200 2800 2700 2
4
6 f (MHz)
8
0 2
10
4
6 f (MHz)
(a)
8
10
(b)
Figure 3 : Longitudinal (a) wave velocity cC (m/s) and (b) attenuation αC (Np/m) in the material composite skin in the bandwidth of the transducer, from f = 2 MHz to 10 MHz.
These longitudinal c(f) and α(f) properties are depending on the frequency. At the first order, the longitudinal wave velocity is not constant and c(f0) = c0, and the longitudinal attenuation can be considered linear with the frequency in the bandwidth of the transducer α(f) = α0.f/f0, where f0 is the reference frequency. The acoustic impedance is defined as Z = ρc, where ρ is the density and c is the longitudinal wave velocity. Table 1: Acoustic properties of the material constituting the bilayer structure at f0 = 5 MHz.
Material
ρ (kg/m3)
c0 (m/s)
α0 (Np/(m.MHz))
Z (MRay)
Rexolite
1050
2380
5.3
2.5
Composite
1400
3070
65
4.3
ρ: density; c0: longitudinal wave velocity at f0 = 5 MHz; α0: linear frequency dependence of the longitudinal attenuation at f0 = 5 MHz; Z: acoustic impedance.
Thus, the reflection coefficient at the interface between the Rexolite and the composite is: Z − ZR RR / C = C ≈ 0.265 (4) ZC + Z R
3. Results 3.1 BAW characterization 3.1.1 Signal processing Each round-trip echo constitutes an A-scan. More precisely, the first round-trip echoes are s1(t) and s2(t). They correspond to the Rexolite wedge only, and to the bilayer constituted of the Rexolite wedge and composite skin, respectively. Their spectra S1(f) and S2(f) are written as follow: S 1 ( f ) = A0 e − j ( k R 2 d R ) RR / C (5) − j ( k R 2 d R + k C 2 dC ) S ( f ) = A e T R T 0 R / C C /3 C / R 2 where R3/C is the unknown complex reflection coefficient at the last interface. The resulting transfer function is: S R T = 2 = TR / CTC / R C /3 e− j k C 2 dC (6) S1 RR / C The Ti/j and Ri/j transmission and reflection coefficients at the interfaces are: 2ZC 2Z R and (7) TR /C = TC / R = ZC + Z R ZC + Z R Z − ZC Z − ZR and (8) R C /3 = 3 RR / C = C Z 3 + ZC ZC + Z R As a result: 4ZC Z R R (9) TR / C TC / R C /3 = R C /3 RR / C ( Z C 2 − Z R 2 ) By combination of equation (6) and (9) we obtain: ZC 2 − Z R 2 ) ( − j k C 2 dC R C /3e = T (10) 4ZC Z R This result is then used for a practical characterization of the composite skin, through the weighted complex transfer function T compensated by the previously evaluated attenuation in the composite skin (equation (3)): ω − j 2 dC Z C 2 − Z R 2 ) −α 2 d ( cC C C RC = Te = R C /3e (11) 4Z C Z R As it is highlighted in Figure 4 (a), the real part reflection coefficient of the composite skin ℜe(RC) varies as a function of the frequency f. It appears to be periodic, and the period is mainly related to the composite skin phase θC = (ω/cC).2dC. The periodicity is evaluated such as (∆ω/cC).2dC = 2π i.e. ∆f = cC / (2dC) = 0.975 MHz. This results in an effective longitudinal wave velocity cC ≈ 3120 m/s in the composite skin. Moreover, the variations of the real part reflection coefficient of the composite skin ℜe(RC) as a function of the focal law position are related to the variations of the complex reflection coefficient RC/3 (equation (8)). As illustrated by the two curves in Figure 4 (a) obtained at two chosen focal law positions, the real part reflection coefficients of the composite skin ℜe(RC) are also varying as a function of the focal law positions xfl. In one hand, the solid red curve corresponds to a relatively small reflection coefficient related to a transmission in solid layers i.e. glue and aluminum. In the other hand, the dashed blue curve corresponds to an important reflection coefficient related to a mismatch impedance between the composite layer and the air between the cells of the honeycomb. These honeycomb cells are clearly visible in Figure 4 (b), where the 2D spectrum
of the real part reflection coefficients of the composite skin ℜe(RC) is displayed as a function (f, xfl). A spatial periodicity can be identified along the focal law positions xfl. As expected, this periodicity is related to the cells pitch length estimated here around Xc,R ≈ 9 mm. 2 nfl=87 nfl=40
ℜ e(RC )
1
0
-1
-2 2
4
6 f (MHz)
8
10
(a)
(b)
Figure 4 : Real part of the reflection coefficient of the composite skin ℜe(RC) (a) {C/3} for nfl = 87 and {C/A} for nfl = 40 and (b) for nfl = 1 to Nfl = 97, i.e. xfl = 0 to 48 mm.
3.1.2 B-scan imaging Another approach for the characterization of the honeycomb composite structure consists in a B-scan imaging (Figure 6). The experimental result (Figure 6 (a)) is compared to the simulated electroacoustic response (Figure 6 (b)) of the phased array inspection of the honeycomb composite structure. The electro-acoustic response in pulse-echo mode s(t) is simulated using the convolution of the global reflection coefficient of the multilayer structure r(t) by the bandwidth of the transducer bw(t): (12) s (t ) = r (t ) * bw(t ) = FT −1{R( f ).BW ( f )} In this view, the Debye series decomposition method [10, 11] delivers the global reflection coefficient at normal incidence R(f). In this approach, the Fresnel reflection and transmission coefficients are developed at each interface between the constitutive layers. The Gaussian bandwidth BW(f) of the backscattered spectrum with a half height bandwidth ∆f6 [12] is defined as follows : BW ( f ) = e
1 f − f0 − 2 σ f
2
and
σf =
∆f 6
(13) 2 2 log 2 On the basis of the experimental configuration, the backscattered spectrum characteristics are f0 = 7 MHz and ∆f6 = 5.5 MHz. By taking into account the properties of the multilayer structure the elementary electroacoustic response s(t) is obtained (equation (12)), constituting an A-scan. Then, this elementary A-scan is calculated for each focal law positions xfl, resulting in a 2D signal sB(t, xfl), i.e. a B-scan of the honeycomb composite structure. As illustrated by Figure 6, the first round-trip echo, located at 17.3 µs, is uniform along the focal law positions xfl, and corresponds to the Rexolite layer. The second one, around 18.2 µs, is strongly damped and corresponds to the composite skin layer. The third echo appears periodically along the focal law positions xfl. In a first approach, the cells pitch length can be estimated around Xc,B-scan ≈ 9 mm. Thus, the bonding is qualified as adequate when the impedance mismatch between the composite skin and the glue layer is low (Figure 5 (a)). In this case, at the positions xfl = 6, 15, 24, 33, 42 mm, there is nearly no reflection at the interface, around t = 18.3 µs.
(a)
(b)
Figure 5 : B-scan of the honeycomb composite multilayer: (a) experiment and (b) simulation
The simulation given by Figure 5 (b) permits in one hand to determine precisely unknown geometric parameters such as the thickness and the profile of the glue. In an other hand, to find the real acoustic parameters of the multilayer structure. 3.1.3 C-scan imaging In the following, a mechanical scan of the composite skin along yacq direction is processed at a constant velocity vacq, resulting in yacq = vacq.tacq. Therefore, a 3D signal s(t, xfl, yacq) is obtained and processed as follows (Figure 6): sC ( x fl , yacq ) = max {s (t , x fl , yacq )}t