lar ZD array has many promising applications for underwater ... a number of underwater applications. ... The frequency response resulting from each stage of.
Phased Subarray Processing for Underwater 3D Acoustic Jmaging Jeremy A. Johnson'.', Mustafa Karniiian', B. T. KhuIi-Yakub' 'Ginzton Laboratory, Stanford University, Stanford. CA 94305-4088 'Image Guidance Laboratory, Stanford Uni\,ersity, Stanford, C A 94305 Absrraef-3D sonar imaging using a fully-populated rectangular ZD array has many promising applications for underwater iniaging. h primary limitation of such systems is the large
inuniber of parallel front-end hardware channels needed to process the signals in transmit and receive when using conrentional full phased array imaging. A subaperture beam acquisition and image formation process is presented that significantly reduces the number of front-end hardware channels while achieving image quality approaching that of full phased array imaging. Rather t h a n transmitting and rerei\,ing on all NXN transducer clemcuts lo form each beam, an MwM subset of elements-alled a subarray-is used for each tiring. The limited number of frost-end processing channels a r e used to acqnire data from each subarray. Switching hardware allorvs the subarray to be nlulliplexed across the full array. Due to the Nyquist sampling criteria in beamspace, the nuniber of beams acquired by each subarray can be significantly reduced compared io the number required for the full array. 'The phased subarray processing includes beam upsampling, lateral interpolation with a subarraydependent filter, and coherent weighting and sumnlation of all subarray images to form a high resolution image. The phased array method achieves an image qualit? nearing that of full phased array imaging with significantly fewer processing channels, slightly reduced SNR, and roughly three times the number of firings for reasonable configurations. 1. INTRODUCTION High-performance 3D sonar imaging could be applied to a number of underwater applications. Unmanned undersea vehicles (UUVs) could use 3D imaging for improved obstacle avoidance, mine detection and reconnaissance, and navigatioil. Divers could use a Iiaiidheld 3D soiiai iiriagiiig systeiti for navigation in low visibility conditions, such as in shallow waters, rivers, or ports. Forward-looking 2D acoustic transducer arrays are a promising technology for 3D underwater imaging. One of the primary constraints of 2 0 array imaging systems is the overwhelming number of front-end hardware channels that are necessary to process the transmitted and received signals in real time [I]. Another difficulty has been addressing all transducer channels individually. One active research topic aiming to address these problems by using a reduced number of transducers is the design of sparse arrays [2-41; current results show that these often suffer from high side lobes. Recent work has heen done to electrically address a fully-populated 2D rectangular array [ 5 ] . The method presented here uses such a fully-populated transducer array, but still uses a reduced number of front-end hardware channels. In this paper we present a method of reconstructing 3D acoustic images by acquiring signals from a small subset of
0-7803-7534-3/$10.0002002 IEEE
array elenients at any given time. By rcducing the number of parallel transinit and receive channels used during a single beam formation, the number of front-end processing channels can be significantly reduced. T h e purpose of this new imaging method is to sufficiently reduce the front-end complexity-and thus size. cost, and power consumption-such that real-time 3D sonar imaging can become a reality. In conventional full phased array (FPA) imaging, a11 transducer elements simnltaneously transmit properlydelayed piilscs to steei~and focus an acoiistic beam toward a desired locatioii. Likewise, all transducer elements simultaneously receive the reflected acoustic signal to forin a dynainically-focused receive beam. Each transmitireceive "firing eventi' is i~epeated.each time steering the beam to a new Iocatioii. The beams are then combined to form the resultiiiit image [6,71. The proposed phased subarray (PSA) imaging method described in this paper is based on other studies using synthetic subaperture imaging for 2D imaging [ E , 91. When applied to 3 D imaging, a fully-populated rectangular array is subdivided into a number of overlapping subasrays, each composed of a group of adjacent transducer elements. For each firing event, only a single subarray is used for transmit and receive heamforming. Due to the reduced transmit and receive aperture size; a smaller number of beams need be acquired as deteimined by the Nyquist sampling critei-ia without any loss of information. The unacquired beams can he reconstructed by upsampling and interpolation using a subarray-dependent set of filters. Each subarray acquires a different range of spatial frequency components. The spatial tiequency range of the combined set oisubarrays equals that of the full array. Therefore, by combining the reconstructed subarray images, the response of PSA imaging is equivalent to that of FPA imaging. The paper is organized as follows. Phased subanay acquisition is described in more detail in Section 1I.A. Section I1.B discusses the 3 0 frequency response of 2D rectangular arrays. The frequency response resulting from each stage of PSA image formation is presented in Section 1I.C. The perforinance of the method is compared to FPA imaging in Section 111, and closing remarks are made in Section IV. 11. METHODS A. Subarray Beam Acquisirion arid Processing
An NxN fully-populated two-dimensional transducer array with element pitch d is subdivided into K x K square suharrays, each with MxM elements. The subarrays overlap by half the subarray width (Mi2) in both directions, and thus the following equation relates N,K , and M
2145
. . . . . .
. '. . . . . sin(tlx)
Upsample by L along e,
Apply 2p Interpolation Filter along 0,-r
Upsample by along Qy
L
Apply 2')
Interpolation Filter along e -r
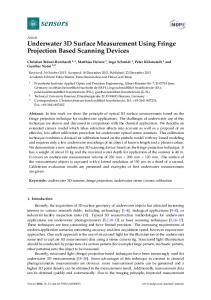
Figure I . Beam processing for PSA image rcconstruction. Each point represents a single beam that extends radially from the center of the array. A4
( K+ I)= 2N
filter is separable i n 8, and such that the reconstructioii (2.1) filtering can be perfot-iiied by applying tu'o different 2D fil-
The a m y lies centered on the .x-~vplane, and faces the positive z axis. Each subairay transiiiits and receives from all of its elements to form acoustic beams that sweep out a sector of size 0 x 0 . The beams all begin at tlie anay center and are directed outward with steering angles 0, and Or iiieasui-ed from the array normal toward the I- and >,-axes; respectively. The steering angles are evenly spaced in sin8, and sine, The received signals are sampled in time such that beams can be reconstsucted to a depth of R. The transmit and receive beamforming delays for each element are identical to those that would be used for FPA imaging. The received acoustic signals from all subairay elements are appropriately delayed and summed to form each beam. Prior to additional processing, a Hilbert transform filter is applied to form an analytic signal with only positive frequency components. The Nyquist sampling criteria requires that the following number of beams be acquired in each dimension: (2.2) where XmiS is the acoustic wavelength corresponding to the maximum frequency component, and QFpA is the number of beanis acquired for FPA imaging using an array with N elements in the beam sweep direction. For a single subasray using PSA imaging, the number of beams required per dimension is reduced to (2.3) Each subarray first acquires QpsRxQpsA beams, as illustrated in Fig. ](a). The object is to upsample the subasray images formed by these beams and reconstruct a fully-sampled 31) beams using a specially-designed filimage with QFpAxQFpA ter. The most straightforward method of reconstsuction would be upsampling the subassay images in both the 8, and 0, dimensions and convolving with a 3 0 FIR filter. The 3D
ters along tlie two dimensions sequentially. This process greatly reduces the number of computations requii-ed to apply the filter. Each subasray image is upsampled along 0, by a factos of L by inserting L - I zero-valued beams between the acquired beams (Fig. l(b)). The upsampling rate is determined by the ratio of the number of beams required for the full anay and each subarray: (2.4) where
r.~]is the ceiling function.
The sobarray-dependent
2D FIR filter h ~ [ 9is~applied ] to each 8,-r plane in order to interpolate the missing beams (Fig. 1 (c)). Ideally, this recoilstmcted image would bc equal to an image formed by directly acquiring beams. The same ul,san,pling/interpolation process is then applied in the 8,. direction (Fig. l(d-e)). A second 2D FIR filter h r [ q p ~is] applied in the 0, direction to reconstruct tliese missing beams. All subasray images are now equivalent to what they would have been had each directly acquired the full set of QFpAxQFpA beams. Given a sufficiently fast digital signal processor (DSP), the beam upsampling and interpolation of a single subanay image can be perfonned in less time than the pulse-echo propagation time of QpsAxQpsabeams. As a result, the time required to form complete QFpAxQFpA-beam images is significantly reduced, in turn increasing the frenie rate. The final step in forming the 3D image is to weight and sum all KxK subarray images. The weights are given by
where k, and kI are the subasray indices in the x and y directions, respectively, and range from 0 to K - I.This choice of weights is justified in Section I1.C.
2146
The resultant image is equivalent to that formed by acbeams from tlie full NxiV-element array quiring QF,J.,xQF,a., using FPA image formation. The advantage of using I'SA image formatior is that fewcr fi-on-end processing cliamiels are required-only MxM instead of Nxiv-and witli a tolerable decrease i n frame rate.
B. 3 0 F~eqiiencvDomain Array Rcspoiise The equivalence of PSA imaging to FPA imaging and tlie PSA filter design is more clearly illustrated in the 3D spatial frequeiicy domain. We first consider the 2D lateral frequency response. The far-field 2D two-way lateral point spread function (PSF) is directly related to the transmit and receive aperture f k t i o n s via tlie Fourier transform:
whel-c 6d] and d H [ ]81-e the 2D aperture functioiis. Coniparcd to the aimay-sampled discrete aperture function. n [ ]: with a fixed sampling period d, tlie aperture fiinction ti[ j samples the aperture with a frequency-dependent period 22. This difference will have tlie effect of scaling the width of all derivative Functions by 2 d h . Consequently, tlie lateral fi-equency domain responseor coarra!, [IO, I I]-is equal to tlie convolution o f the aperhire functions:
The coaii-ay corresponding in the full NxN array is therefore equal the convolution of two squares, resulting i n a pyramidlike function with a square base of width 2(2N- I)d/h. S i m larly, the centcr subarray will have a cosubor-ro); equal to a pyramid with base width 2(2M- 1)dlh. Since the other subarrays are shifted in either direction by multiples of Mi2, their cosubarrays are likewise shifted by inultiples of 2Mdlh_ or ha!f !he \\'i?t!? nf the cosubarray. A!! cnrubarrzys n\rt.r!ip by half their width in both directions; in this arrangement, the full coarray is a linear combination of all cosubarrays. In other words, simply weighting and summing the subarray response results in the full array response. So far, the discussion has been limited to a single frequency. In practice, the transmit pulse is a bandlimited signal with center frequency Jo and ranging from Jn1cn to .f,,,. The wavelength varies with frequency, x = c /f
,
(2.9)
and thus the 2D coarray at each frequency will be scaled and shifted linearly with increasing frequency. In addition, the cnarrays at each frequency will be weighted by the relative contribution of the corresponding frequency o f the excitation pulse. Let q r ] he the axial impulse response of the system corresponding to the excitation pulse with sampling frequencyf;. The axial frequency response is then given by
U[T]is an an;ilyiic signal. and thus ~ [ w , has ] only positive frequency components. The overall 3D frequency rcrponse of a single trmisiiiissioii froni one :!per-turc to another is ,,[in,
. V I , .ill,]=
( 6 ( [il, ,n,]
000,
[lit
,,,,I).
l,[l?i,].
(2. I 1)
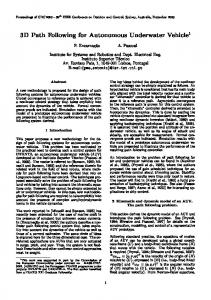
Recalling that tlie width o f the modified aperture functions increases linearly with frequency, the expression i n parentheses represents a 3D structure with a square lateral cross-section boundary (examples are shown in the left column of Fig. 2). Due to tlie linearly increasing width, tlie bounds of the structure define a square pyramid whose top is positioned at the origin and whose hasc extends toward the axial frequency axis, n i r . A bandlirnitcd axial frequency response causes tlie top and the base of the pyramidal boundary to be clipped, reducing the bounds to a square pyramidal fi-ustuni. Figure 2(e) shows the cross sections of tlie 3D response foi a full phased ai-ray system. For a subarray located at tlie center of tlic array, this frustum is aligned with the radial frequency axis. Shifting tlie subarray off axis has the effect of slanting tlie frostum away from the ni, axis. Figure 2(d) illustrates tlie effect of shifting tlie subarray towards tlie positive ]'axis, resulting i n a slant of the frustiiin towaids tlie positive in,, axis. Figures. I t is important to observe that because tlic subarrays overlap by half thcir width, the corresponding fiustums i n 3D frequency space will also overlap by half thcir lateral width; as a result; the frustum corresponding to tlie full-array (FPA) response is a linear combination of the suibanay responses. C. 3 0 Fi-eyireiic), Doniairi PSA Processing The frustum-hounded frequency-domain responses discussed thus far represent the subarray response when acquiring a full set of Q, beams i n each angular dimension S a n pling a reduced sct of Qps.4 beams results i n lateral cxpansion and circular wrapping of the response in the frequency domain. As a result, tlie lateral bounds of tlie frustum nearly extend to fill all o f the lateral frequency space. Figure2 shows three orthogonal cross sections through the center of 3D frequency space for each stage of PSA processing. The example shown gives tlie response of a single subarray located at the center of the full array in the x axis and at the edge of the array in the y axis (k, = 3, ky = 6). The response of the system when acquiring only QpsAxQpubeams with this subarray is shown in Fig. 2(a). Since the subarray is not centered along the y axis, the frustum is slanted in the m,-iii, plane. Properly choosing the beamsampling rate prevented the boundary of response from overlapping onto itself. Lateral upsampling by a factor of 1, along a single spatial dimension, Y.~, results in L periodic replicates of the frustuin to be formed in frequency space along the dimension m,, as shown in Fig. 2(b). The frustum response whose vertex is located at the origin is the desired response; all others are unwanted aliases. The pulpose of the frequency-domain reconstruction filter, HL[ni,,rn,]. is to eliminate the aliases. The frequency-domain response of the filter is therefore a rectangle centered over the desired frustum as indicated in Fig. 2(b). This process is repeated for all subarray images. As shown in Fig. 2(c), the aliases have been eliminated.
2147
Cross Seclions 01 3D Frequency
Cross Sections of 30 Frequency Responses in IW..~, Piane
Respanses inn,.^?, Plane
Crass Seclions 01 30 Frequency Responses in J~I,-IJJ, Plane 7
H,IW,.,",i Filler Passband
I ll,l,>#,.~"p,J
Filter Passband
........
~~
~
..........
~
.
........,
~
...
.........
~
r~ ..........
.. ....
~
..............
I",
. . I'
m1
'''V. ... .... ~...~
.
mr.
.~
~~
~
:In, .. ..
''
nl"
...........
,
Figure 2 . 3D frequency response at each stage of PSA processing. The light shaded regions represent the boundaries of the nonzero response region.
2148
The process is repeated foi~the otlicr lateral d i n ~ e n s i o ~ ~of , subarray beams acquired is still higher than tlie numbei- o f full array bcams. This increase can be exprcssed as q p Again. L periodic replicates are formed i n the freqocncy domain, this timc along the iiir :isis. a s SIIO\YII i n Fig. 2(c). The recoiislriictioti fillcr. l f k [ i i r , . i i i , ] , is applied to c1iiiiiii:itc tlie L - I aliases. After upsnmpling and reconstruction iiltcring i n both lateral directions, tlie combincd frcquency response for each The number of PSA firings is tlierefore always less tliaii subarray is equivalent to tlie response of a subarray that had 4 times the number of FPA firings; for a reasonable configudirectly acquired QFp,,xQFpA beams directly. The frequencyration with M = Nl4, the increase is approximately 3 times. domain response o f tlie example subarray is shown in For a general acoustic imaging system, the frame rate is Fig. 2(d). That responses of all KxK subarrays can be linelimited by the number beams acquired and the time required arly combined to form the FPA-equivalent response is made for the acoustic signals to travel to the maximum imaging clear when considering a single lateral cross section through the 3D frequency-domain response. As discussed i n tlie pre- depth, R, and back: vious subsection, the bounds of the lateral response define a square, and the magnitude is pyramidal witli a square base. Because the subarrays are spaced apart by half tlie snbanay size. tlie square pyramids i n the frequency domain corresponding to adjacent siibari~aysalso overlap by half tlie width of the pyimnid's base: this is true in both dimensions. As a i~esult,the magnitude of tlie fr-equency domain at any point is found via bilineai- interpolation of tlie four nearest pyramidal peaks. T o achieve an FPA-equivalent frequency responscyet another square pyramid whose base is equal to the coinposite of bases of the subarray pyramids-the subarray responses must he weighted such that the magnitude of their conesponding pyramids define the surface of the full FPA pyramid. The proper subarray weights that achieve the full array response are given in (2.5). Regardless of the frequency at which the cross section is observed, tlie principles of the 2D lateral subarray response still apply. Consequently. tlie linear combination of the SIIbarray frustums using the specified weights will result in the full array response frustum. I n oilier words, tlie combined PSA system frequency domain response is equivalent to that o f a n FPA imaging system.
(3.4) where c is tlie sound velocity i n the ~nedium.As an example, consider a system employing a 32x32-element a m y subdividcd into 7x1 subanays each with 8x8 elements. Furthcrmore. the eleiiieiits are spaced at d = ?+,,iJ2; the imaging sector angle is 6O0x6O"; the velocity of sound is 1480 rids; and the imaging depth is 1 in. Such a system would require 1,600 beams ( 4 0 ~ 4 0 resulting )~ i n one frame every two seconds. Signal-to-noise (SNR) performance of an anay imaging system is dependent upon the number of active transmit and receive channels. Assuming that the noise is additive and statistically independent on the receive channels, the SNR of an FPA system is given by S N R , , = 20log,,[N']+SNR,
(dB),
(3.5)
where SNRo is the pulse-echo SNR of a single channel, assuming that the SNR of tlie array cliannels are identical. For a 32x32-element full phased array system, the SNR is 90.3 dB above SNRo. For the proposed PSA system, the relative SNR is given by
111. RESULTS The proposed phased subarray 3D imaging method has been shown to have a theoretical response equivalent to that of full phased array imaging. The PSA imaging method achieves this result wliile significantly reducing the front-end hardware complexity. The required number of front-end hardware channels is reduced from N 2 for an FPA system to M2.
The total number of firings required for each iinaging method is equal to the total number of beams acquired:
Although the subarray beam-sampling rate is significantly less than the rate required for the full array, the total number
SNR,,sA = ZOIog,,,r-( 2 N - M ) M'1f SNR, (dB)
(3.6)
For the previous PSA example with a 32x32-element anay, the relative SNR is 88.0 dB above SNRo. Therefore, PSA imaging has an SNR 2.3 dB below the equivalent FPA system. Numerical simulations were performed to evaluate the point spread function. The array parameters were similar to those given in the example (N= 32, M = 8, K = 7). The element spacing was d = b12, where ho is the wavelength corresponding to the center frequency. The excitation pulse used was a modulated Gaussian with 50% bandwidth. A perfect point reflector was positioned directly in front of the array at a distance of 60.9 &. The fixed transmit focal point was fixed at the position of ihe point reiiector, and dynamic focusing was used on receive. Both FPA and PSA methods were simulated using the same array for comparison. For FPA imaging, 129x129 beams (QFpAxQrPa) were formed directly. For the PSA imaging simulations, only 33x33 beams (QpsAxQPsA)were formed. These were upsampled by 4 ( L ) in each lateral dimension prior to filtering sucli
2149
FPA
-1
sin(0J
1
-1
sin@,)
1 , .
Figure 3. Cross sections of the 3D point spread function for FPA and PSA imaging methods. linages displayed with 50 dB of logarithmic compression.
-..-,
.1.5
that tlie final number ofbeains was the sanie as for FPA. The interpolation filtcrs for each subarray were first calculated using the ideal filters as showii in Fig. 2. The inverse discrete Fourier transform \"as used t o determine the spatial domai, filters, which wcre subsequently truncated to 31 and 15 taps in the lateral and axial dimensions, respectively. A hamming window was also applied in both dimensions. Figure 3 shows cross sections through the raw beams centered at the location of the point reflector. The magnitude of the PSF has been plotted along the axial and lateral dimensions in Fig. 4. The axial response for the two methods is nearly identical, with 3-dB resolutions of 0.61 b and 0.63 b for FPA and PSA, respectively. The lateral PSFs are also nearly identical within the center 36" sector, with 3-dB resolutions of 2.22" and 2.48" for FPA and PSA, respectively. Beyond this range, however, this example of PSA suffers from wide side lobes.
-0.5 0 0.5 Radius (Wavelenglhr. l o )
I
1.5
Figure 1. Lateral and axial point spread fiinctions for FPA and E A imaging.
are not present in ID array simulations with 128 elements using similar rechniques [12]. The theory and examples provided in this paper all assumed a square 2D amay with tlie same number of elements in both directions. Although this simplified discussions here, rhe principles equaiiy apply 10non-square recranguiar arrays. V. REFERENCES
1'1
[2]
IV. DISCUSSION AND CONCLUSION
We have presented a phased array imaging method for 3D imaging that greatly reduces the front-end hardware while achieving near-FPA resolutions. The SNR is slightly reduced, and the franie rate is reduced by a factor of 3 for reasonable configurations. The simulations show that the PSA method suffers from high outer lobes in the lateral response. These may be due to the small number of elements used, as these
-1
[3]
[4]
2150
M. E. and p. A. Lewin2 "The influence Of front-end hardware on digital ultrasonic imaging," IEEE Transactions on Sonics and Ultrasonics, pp. 295-306, 1984. P. Gori, G . Cincotti, and M. Pappalardo, "Dense and sparse 2-D anay radiation patterns in lossy media," IEEE Transactions on Ultrasonics. Fen-oelectrics ond Frequency Control, vol. 47, pp. 940-8. 2000. A. Austeng and S. Holm, "Sparse arrays for real-time 3D imaging, simulated and experimental results," presented at 2000 IEEE Ultrasonics Symposium, San Juan, Puerto Rico, 2000. G. R. Lockwood, J . R. Talman, and S. S . Brunke. "Real-time 3-D ultrasound imaging using sparse synthetic aperture beamforming," IEEE Pansactions On
Ullr-(minic.sFer,-odecI,-ic.s A n d Freqitenc~.Co,rrr-ol, pp. 980-988; 1998. C. H . Clieng, E. bl. Chuw. X. Jin, S. Ergun, and B. 'r. [SI Kliuri Yakub, "An eflicient elcctricnl addi~essing method using through-wnfer vias for two-dimensional ~ Ulrr-~z.isoriultrasonic arrays," Proceedilirzgs ~ f l l l z cIEEE ics Sjwzposiiim, vol. 2. pp. 1 179-1 182. 2000. B. D.Steinberg, Pvinciples ofAper1ure and Array Qs[6] /em Design :Including Random and Adaplive Arruyv. New York: Wiley, 1976. T. A. Shoup and 1. Hart, "Ultrasonic imaging sys[7] tems," presented at IEEE 1988 Ultrasonics Syniposium, Chicago, IL, USA, 1988. M. Karaman, "Ultrasonic array imaging based on spa[XI tial interpolation," presented at 3rd IEEE International Conference on Image Processing, Lausanne, Switzerland, 1996. [9] M. Karainan and 0. U. M , "Subapcrture processing for ultrasonic imaging," IEEE T ~ O I I S O C0 1I 1~Ulrr-oson~US ics Ferroelecn-ics And Freqr,eiic,v Corrir-01, pp. 126135, 1998. [ I O ] R. T. Hoctor and S. A. Kassam, "The unifying role of the coarray in aperture synthesis for coherent and incoherent imaging," Pwceedings of ihe IEEE, vol. 7 8 , pp. 735-52. 1990. [ I I ] R. J. Kozick and S. A. Kassam, "Synthetic aperture pulse-echo imaging witli rectangular boundary arrays (acoustic imaging)," IEEE Transocrions on Image Processing, vol. 2, pp. 68-79; 1993. [I21 J. A. Johnson, M. Karaman, and P. Khuri-Yakub, " I n age formation and restoration using multi-element synthetic array processing," Proceedings of SPIE The Inm i i a l i o i d Sociefyfo? Optical Engineering, 2002.
2151