Cell Systems
Perspective Phylogenetic Profiling for Probing the Modular Architecture of the Human Genome Gautam Dey1,2,* and Tobias Meyer1,* 1Chemical
and Systems Biology, Stanford University, Stanford CA 94305, USA address: UCL-MRC Lab for Molecular Cell Biology, London WC1E 6BT, UK *Correspondence:
[email protected] (G.D.),
[email protected] (T.M.) http://dx.doi.org/10.1016/j.cels.2015.08.006 2Current
Information about functional connections between genes can be derived from patterns of coupled loss of their homologs across multiple species. This comparative approach, termed phylogenetic profiling, has been successfully used to infer genetic interactions in bacteria and eukaryotes. Rapid progress in sequencing eukaryotic species has enabled the recent phylogenetic profiling of the human genome, resulting in systematic functional predictions for uncharacterized human genes. Importantly, groups of co-evolving genes reveal widespread modularity in the underlying genetic network, facilitating experimental analyses in human cells as well as comparative studies of conserved functional modules across species. This strategy is particularly successful in identifying novel metabolic proteins and components of multi-protein complexes. The targeted sequencing of additional key eukaryotes and the incorporation of improved methods to generate and compare phylogenetic profiles will further boost the predictive power and utility of this evolutionary approach to the functional analysis of gene interaction networks. Significant similarity between two DNA or amino acid sequences is used to infer shared ancestry, or homology, of the DNA elements or proteins being compared. A high degree of sequence similarity between homologs strongly indicates a conserved biological function, a cornerstone of comparative genomics that has been used to provisionally assign functions to thousands of human genes based on decades of detailed experiments in vertebrate and invertebrate model systems. However, the differences in sequence between (or the complete loss of) homologs evolving independently in separate lineages encode information as well: a close functional coupling between unrelated genes (or non-coding genetic elements) often manifests itself in correlated patterns of sequence similarity across species (de Juan et al., 2013), a fact that can be exploited to discover novel functional links. Specifically, the inference of functional connections between protein-coding genes based on shared binary patterns of homolog presence and loss is termed phylogenetic profiling (Figure 1A) (Pellegrini et al., 1999). Phylogenetic profiling exploits a specific evolutionary scenario, namely one in which a pair or larger group of genes are functionally coupled in such a way that the loss of one component leads directly or indirectly to the loss of the others (Figure 1A). While this scenario can only apply to a subset of all possible genetic interactions, a close correlation between binary phylogenetic profiles is frequently associated with them being part of the same physical protein complex, metabolic cascade, or regulatory module (Pellegrini, 2012), providing a powerful approach to predict functions for unknown genes and define interdependent genetic modules. This perspective focuses primarily on novel functional insights that can be gained by phylogenetic profiling applied to the human genome (for a general overview of comparative genomics, see Alfo¨ldi and LindbladToh, 2013). Phylogenetic profiling already showed much promise as a predictive tool during its first application to bacterial gene 106 Cell Systems 1, August 26, 2015 ª2015 Elsevier Inc.
sets just before the end of the millennium (Pellegrini et al., 1999), but the first fully sequenced genome for a multicellular eukaryote had only just been released (C. elegans Sequencing Consortium, 1998). The 15 years since have seen an unprecedented increase in the number of eukaryotic genomes driven by plummeting sequencing costs. This led to the successful application of phylogenetic profiling to a genomewide analysis of S. cerevisiae (Marcotte et al., 1999), the discovery of novel Drosophila cilia genes (Avidor-Reiss et al., 2004), a screen for novel small RNA pathway components in C. elegans (Tabach et al., 2013a), and the identification of multiple components of a key mitochondrial uniporter (Baughman et al., 2011; De Stefani et al., 2011). In recognition of the method’s utility, web servers for comprehensive phylogenetic profiling continue to be developed (Cheng and Perocchi, 2015) and coevolution metrics have been incorporated in some major interactome databases (von Mering et al., 2005; Szklarczyk et al., 2015). Three recent studies have systematically investigated the utility of phylogenetic profiling in revealing genetic interactions between human genes (Dey et al., 2015; Li et al., 2014; Tabach et al., 2013b). Tabach et al. (2013b) mapped hundreds of co-evolving human gene sets (identified using correlated homology scores) and disease annotations, a valuable dataset subsequently utilized to identify novel components of the mammalian meiotic methylation program (Schwartz et al., 2013). Li et al. (2014) used statistical inference to expand groups of correlated human phylogenetic profiles into larger modules, generating predictions for approximately 150 cellular pathways and complexes. A recent approach taken by our group extended phylogenetic profiling to ‘‘orthogroups’’ of homologous human genes and calculated a genome-wide matrix of all pairwise co-evolution scores, identifying a much larger set of modules (Dey et al., 2015). Experiments in our study as well as subsequent studies have
Cell Systems
Perspective A
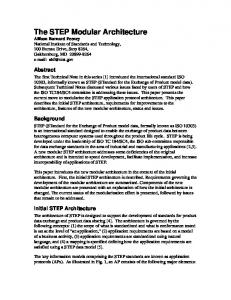
Figure 1. Phylogenetic Profiling and Its Challenges
Phylogenetic profiling Ancestral Protein 1 Species tree
Protein 1
Correlated phylogenetic profiles predict functional interaction
Conserved functional interaction
Protein 2
Phylogenetic profile for Protein 1 Orthologs in extant genomes
Ortholog present Phylogenetic profile for Protein 2
Ortholog absent Gene loss event Homo sapiens
Species tree
Ancestral Protein 2
B
Challenges to accurate profiling Duplication
Ancestral protein Species tree
Parent
Homo sapiens
Daughter 1
Ortholog present
(A) This schematic illustrates the method of phylogenetic profiling using homologs (orthologs) mapped across eight species that are related through the accompanying species tree. Protein 1 and 2 interact functionally and share identical homolog (ortholog) distributions, with each potential ortholog represented in a binary phylogenetic profile with a 1 (black) if present or a 0 (white) if absent. Inferred gene loss events are highlighted on the tree. The correlated phylogenetic profiles for Proteins 1 and 2 can be used to predict the conserved functional interaction. (B) Challenges to phylogenetic profiling. In this illustration, an ancestral protein duplicates once (box inset), leading to a complex distribution of orthologs in different extant species. The graph below the species tree represents a theoretical distribution of similarity scores (e.g., BLAST) generated against (human) Daughter 1. Each point (a putative ortholog in each species) is color-coded in accordance with its reciprocal best match in the human genome (BBH; best bidirectional hit). Species branching off before the duplication event contain only one homolog, resulting in an artifactprone BBH match (red arrows). The dotted line represents a suitable homology threshold. Phylogenetic profiles are generated using either this homology threshold (top) or a best bidirectional hit criterion (BBH, bottom) in each species. Errors in the phylogenetic profiles resulting from each method are highlighted with red dotted lines.
Daughter 2 Gene loss event
Ortholog absent Error
Orthologs
Similiarity scores against human
BBH to BBH to
Phylogenetic profiles generated with similarity threshold
Phylogenetic profiles generated with best bidrectional hit (BBH)
Similarity threshold
Species
validated a subset of functional predictions related to primary cilium function and novel interactors of the WASH complex (Phillips-Krawczak et al., 2015). The success of these studies in driving empirical discovery is of particular relevance to biomedical science given the large proportion of the human protein-coding genome that remains poorly characterized (Dey et al., 2015). This article focuses on how to build on these recent successes and effectively leverage the growing pool of available genome sequences. We argue that sequencing more free-living protists is a vital step in the accurate reconstruction of eukaryotic gene histories. We discuss a role for phylogenetic profiling in the investigation of human cellular function through comparative biology. Finally, we examine the modular architecture retained for some, but not all, cellular processes across diverse ecological and cellular niches through millions of years of eukaryotic evolution.
Optimizing Predictive Phylogenetic Profiling Use of Hierarchical Groups of Orthologs Generating a phylogenetic profile for a human gene involves first identifying --- Species --its orthologs in other species (homologs derived vertically from a common ancestor and expected to share the same function [Koonin, 2005]). Orthology inference is a mature field, with a large --- Species --number of graph-based (clustering based on sequence similarity scores, e.g., BLAST) and tree-based (reconciliation of gene trees inferred from sequence similarity with the species tree) algorithms (Huerta-Cepas et al., 2014; Li et al., 2003; Powell et al., 2014; Schreiber et al., 2014; Tatusov et al., 1997; Vilella et al., 2009). Even straightforward graph-based methods like the best bidirectional hit (BBH; orthology is assigned if the top-scoring homolog in a second species returns the original query gene in a reciprocal similarity search) sometimes outperform more complex tree-based approaches in comparative analyses (Kristensen et al., 2011; Trachana et al., 2011). Moreover, it should be noted that incomplete genome annotation and low homology scores at large evolutionary distances generate algorithmindependent errors; the latter can be partially addressed by using sensitive search methods like PSI-BLAST (Altschul et al., 1997) or delta-BLAST (Boratyn et al., 2012) that leverage additional information derived from conserved domains or secondary structure. Cell Systems 1, August 26, 2015 ª2015 Elsevier Inc. 107
Cell Systems
Perspective The scalability and easy implementation of graph-based approaches make them attractive for phylogenetic profiling, with some studies directly using homology thresholds (Li et al., 2014). However, even a single gene duplication can introduce a conceptual challenge: now, some species only carry a single gene with homology to two separate human genes (Figure 1B). Each time a gene is duplicated, the daughter genes, now capable of evolving independently, can diverge by acquiring new functions (neofunctionalization) or sharing the function of the parent (subfunctionalization) (Conant and Wagner, 2003; Conant and Wolfe, 2008). Thus, neither daughter gene is (by itself) a true functional ortholog of the non-duplicated gene found in lineages that branched off prior to the duplication event. Problematically, using homology thresholds will generate nearidentical phylogenetic profiles for both daughter genes despite their possible functional independence (Figure 1B), and the BBH criterion can cause mismatches in species that branched off before the duplication event (Figure 1B) (Dalquen and Dessimoz, 2013). While this challenge can be circumvented by eliminating all human genes with detectable human homologs (co-orthologs) from the analyzed set (Li et al., 2014; Tabach et al., 2013b), this represents only a partial solution because an overwhelming fraction of human genes are derived from historical duplication events (Cotton and Page, 2005; Dey et al., 2015). First, the vertebrate lineage carries clear signatures of two genome-wide duplications (Blomme et al., 2006). Second, many human gene families of fundamental importance to cell biology have a demonstrated history of broad expansion coupled with functional divergence (Gu et al., 2002; Lespinet et al., 2002): GPCRs (Bjarnado´ttir et al., 2006), small GTPases (Boureux et al., 2007), and kinases (Shiu and Li, 2004), to name just a few. A more inclusive solution is to sequentially group co-orthologs in the same genome into orthogroups (Figure 2A). Each orthogroup represents the extent of sequence space (and implied functionality) that the daughter genes have explored after duplication. Other genomes can then be queried for a reciprocal match to any of the co-orthologs within the group (Figure 2A). Consequently, methods that generate a separate phylogenetic profile for each orthogroup (Dey et al., 2015; Wapinski et al., 2007) enable a comprehensive exploration of the functional prediction space without excluding gene families from analysis. Optimizable Measures of Co-evolution In principle, since independent losses in multiple lineages are good indicators of functional co-evolution (Figure 2B; Case 2 represents a higher likelihood of functional co-evolution than case 1), the most rigorous way to compare phylogenetic profiles involves modeling gene gains and losses on each branch of the complete species tree. Parsimony and maximum likelihood methods have been used successfully in the past for small numbers of bacterial and fungal genomes (Barker and Pagel, 2005; Barker et al., 2007). Most recently, Li et al. (2014) developed an algorithm to generate statistical models for gene gain and loss from pre-selected seed groups already annotated to be part of the same pathway and search the human genome for additional genes conforming to the model. Though statistically rigorous, their approach relies on pre-existing pathway annotations and is insensitive to co-evolution at the scale of indi108 Cell Systems 1, August 26, 2015 ª2015 Elsevier Inc.
vidual gene pairs, making it unsuitable in its current form for an unbiased genome-wide analysis in humans. The alternative is to use a heuristic score, which comes with the advantages of rapid optimization against functional interaction resources and the ability to scale with both genome complexity and the number of genomes. Unfortunately, correlation scores that give each species equal weight produce artifacts, as a single gene loss event can result in drastically different ortholog distributions depending on where it occurs within the tree (In Figure 2B, compare Case 1, where a single-loss event produces 5 missing orthologs, with Case 2, where single-loss events produce 1 or 2 missing orthologs) (Kensche et al., 2008). This effect can be partially neutralized by sampling an even distribution of species (Tabach et al., 2013a), though with the caveat of assuming a uniform probability of gene gain/loss across lineages that encounter widely varying ecological niches and selective pressures. One effective strategy that combines the strengths of both approaches listed above involves using shared ‘‘runs’’ (Cokus et al., 2007) or transitions (Dey et al., 2015) in phylogenetic profiles to indicate independent loss events (Figure 2B). These scoring schemes incorporate information from the species tree without requiring full models of gain and loss, making them easy to optimize and scale up to thousands of genes across hundreds of species. Drawing inspiration from tree-based methods, further heuristic constraints derived from evolutionary logic and parsimony (penalties for unlikely losses and down-weighting the influence of parasite genomes, for example) could reduce false positive rates and increase the sensitivity of predictions. Leveraging Eukaryotic Diversity As more and more species get sequenced, it is increasingly clear that almost a quarter of human genes can be traced to the earliest eukaryotes (Koonin, 2010) and have since been lost in many plant, fungal, and parasitic protist lineages. This number was initially underestimated, largely because many supposedly early-branching species in a ‘‘crown-group’’ model of the eukaryotic tree were assigned erroneous positions caused by fast rates of genome evolution and parasitic lifestyles (Stiller and Hall, 1999). Far from being ‘‘primitive’’ pre-mitochondrial organisms, parasites such as Giardia lamblia actually represent the results of reductive evolution from a complex ancestor that possessed fully functional mitochondria (Embley and Martin, 2006). In contrast, the genome of the recently sequenced freeliving Naegleria gruberi (Fritz-Laylin et al., 2010, 2011) is much closer to that ancestral state, encoding complete actin and microtubule skeletons, complex transcriptional and signaling machinery (including GPCR, histidine kinase modules, and twice as many adenylate/guanylate cyclases as humans), as well as thousands more spliceosomal introns than its parasitic relative Trypanosoma brucei (Siegel et al., 2010). The unanticipated degree of conservation of ancient eukaryotic machines revealed by these analyses opens up new possibilities for systematic comparative biology (Box 1). Importantly, the many distinct lineages (Burki, 2014) of unicellular protists represent a huge reservoir of genomic diversity that can play a major role in informing phylogenetic profiles. Figure 3 illustrates this argument by highlighting the overall contribution of ortholog losses/absences in individual species to the representative
Cell Systems
Perspective A A duplication event generates 3 orthogroups
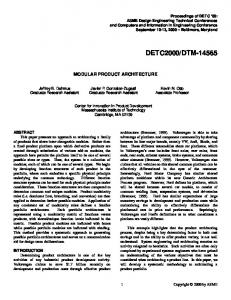
Figure 2. Improvements to Phylogenetic Profiling
Duplication Species tree
Ortholog present Ortholog absent Parent Daughter 1 Daughter 2
Direct orthologs
Gene loss event
Daughter 1 profile
Homo sapiens Direct orthologs Daughter 2 profile Direct orthologs Orthogroup of
OR
OR
OR
OR
OR
Inferred parent profile
B Species tree
* Key:
Case 1
Ortholog present
Gene 1 Gene 2
(A) The schematic illustrates the use of an orthogroup strategy to resolve a single gene duplication event. First, phylogenetic profiles are generated for Daughter 1 and Daughter 2 using a BBH criterion in species that branched off after the duplication event. Next, an orthogroup (group of co-orthologs or sister genes) is created that contains the two human proteins Daughter 1 and Daughter 2. A third phylogenetic profile can now be generated that assigns an ortholog to a species that contains a BBH match to either Daughter 1 or Daughter 2. (B) Schematic illustrating the differences between common algorithms for evaluating the strength of co-evolution between phylogenetic profiles, making use of two different evolutionary scenarios (Case 1 and 2) for Gene 1 and Gene 2. In both scenarios, phylogenetic profiles for Gene 1 and Gene 2 are being compared across 18 species related through the accompanying species tree. The total number of shared profile presence calls (13) and absence calls (5) are identical in each case. However, Case 2 contains more inferred loss events (red stars) and shared transitions between phylogenetic profiles (red wedges). Blue text indicates the relative strength of co-evolution assessed by linear, model-based and runs-based algorithms for these two scenarios. While both model-based and runs-based algorithms will correctly report that Case 2 represents a higher likelihood of functional co-evolution than Case 1, a runs-based score is easier to compute and scale up as either the number of species profiled or complexity of species tree increases.
Ortholog absent
* Inferred gene loss
karyotic supergroups (Dawson and FritzLaylin, 2009). Of the few protists that Species have been sequenced, most are paratree sites. This clear shortfall has led to a call Linear score: by some groups for a concerted effort to * * Case 1 = Case 2 sequence more aquatic free-living pro* tists (Dawson and Fritz-Laylin, 2009; Model-based score: Case 2 >> Case 1 Keeling et al., 2014), and we emphasize Gene 1 here the relevance of such projects for Runs-based score: Case 2 >> Case 1 functional predictions in humans. Though Gene 2 not without its challenges (primarily the difficulty of growing many such species phylogenetic profiles of evolutionary modules of human genes in pure laboratory culture), metagenomics anchored by high(Figures 3A and 3B) (Dey et al., 2015). The protists exhibit a quality reference genomes can help accelerate this process 2-fold dynamic range of shared gene content: when comparing (Heywood et al., 2011). genes represented in all major eukaryotic lineages, some species such as the free-living Naegleria gruberi have more ortho- Discovering Evolutionary Modularity logs for human genes than any fungi or plants while others, Evolutionary Cohesion particularly parasites, have undergone severe reductive evolu- Biological networks are widely considered to be intrinsically tion (Figure 3C). This diversity in frequencies of gene loss greatly modular, consisting of sub-networks isolated chemically or increases the likelihood of observing informative and unique spatially from the rest of the network and carrying out discrete phylogenetic profiles, explaining why losses in protists functions. However, there are many ways to partition complex contribute to over a third of all coevolving modules identified systems, and distilling modules from cellular networks has been an important focus of research in many different fields for many (Figure 3B). We have a long way to go: Approximately 80% of all existing or years, including developmental biology (Bolker, 2000), metaongoing eukaryotic genome projects are restricted to opistho- bolism (Jeong et al., 2000; Segre` et al., 2005), signaling (Atay konts (fungi, animals, and choanoflagellates) and multicellular and Skotheim, 2014; Bhattacharyya et al., 2006; Lauffenburger, plants, with very little coverage of the other major, diverse eu- 2000; Meyer and Teruel, 2003), evolutionary biology (Roth, Case 2
Shared transition or ‘run’
Cell Systems 1, August 26, 2015 ª2015 Elsevier Inc. 109
Cell Systems
Perspective Box 1. Evolutionary Cell Biology
Experimental cell biology informed by genomics and evolutionary theory (evolutionary cell biology) has the potential to provide powerful new insights into complex cellular functions (Lynch et al., 2014). From the human perspective, this could involve comparing and contrasting function of a conserved module, regulatory motif, or protein across multiple species, but also the parallel investigation of a complex intracellular feature in a potentially reduced or more ancestral environment. A striking example is provided by the flagellum of the green alga Chlamydomonas reinhardtii, a structure that bears structural and functional similarities to the mammalian cilium (Kozminski et al., 1993; Rosenbaum and Witman, 2002). Enabled by the ease of laboratory culture, classical genetics and the generation of non-lethal flagellar mutations, experiments in Chlamydomonas have resulted in deep insights into ciliary function in mammalian health and disease, and helped define a minimal set of genes required for cilium function dating back to the earliest eukaryotes—all this from a unicellular alga separated from humans by 1 billion years of evolution (Li et al., 2004; Pazour et al., 2005; Silflow and Lefebvre, 2001). Recent phylogenetic profiling studies have only served to further reinforce the extent of the functional coupling of cilia components across these two species (Avidor-Reiss et al., 2004; Carvalho-Santos et al., 2011; Dey et al., 2015; Li et al., 2014). The case of the cilium raises the question of how such an evolutionary perspective can be systematically extended to other cellular modules. The advent of adaptable genome-editing technology, super-resolution imaging, and the abundance of high-quality genome data make it possible to generalize this approach to species drawn from across the eukaryotic tree and other domains of life, developing novel experimental systems on reasonable timescales. In doing so, we might choose to complement studies in vertebrates and mammals by investigating splicing in Giardia lamblia (Nixon et al., 2002), sperm development in Nematostella vectensis (Putnam et al., 2007), GPCR signaling in Naegleria gruberi (Fritz-Laylin et al., 2010), and the origins of the nervous system in comb jellyfish (Moroz et al., 2014). Phylogenetic profiling can help to guide this approach by providing a comprehensive map of orthologs across species but also a set of core functional interactions that have been preserved across evolutionary timescales.
1991; Wagner, 1996), and bioengineering (Alon, 2007). Modules are often defined empirically (Tanay et al., 2004)—a set of protein interactions restricted to a single subcellular compartment, a transcriptional circuit only active during a specific developmental stage, or a set of metabolic enzymes linked through a linear chain of substrates and products. However, developing computational strategies to infer functional modules has become a priority (Alon, 2007) with the advent of comprehensive interactome maps (Rolland et al., 2014). Drawing on principles of circuit design and real-world scalefree networks (Alon, 2007; Baraba´si and Oltvai, 2004), studies have focused on the identification of characteristic topological ‘‘motifs’’ (Milo et al., 2002; Shen-Orr et al., 2002). While powerful, these methods can be confounded by the characteristic hierarchical organization of many regulatory features (Papin et al., 2004), and also simply by errors, incomplete coverage, and the absence of dynamical measurements in most high-throughput datasets (Alexander et al., 2009). In search of a complementary strategy, it is perhaps instructive to note that the very definition of modularity in some early papers was based on conservation of homologous structures across species (Roth, 1991; Wagner, 1996). Although there has been considerable debate over the specifics of how modularity itself might evolve (Espinosa-Soto and Wagner, 2010; Kashtan and Alon, 2005; Wagner et al., 2007; Wang and Zhang, 2007), it is nonetheless clear that genes can exhibit ‘‘evolutionary cohesion’’—be gained and lost together in genomes encountering different environments (Campillos et al., 2006; Snel and Huynen, 2004)—and exert constraints on the evolution of their components (Chen and Dokholyan, 2006). Modules identified by phylogenetic profiling, a generalization of the cohesion principle, represent a functional coupling maintained across tissue, species, and environmental context—an integrated ‘‘experiment’’ across hundreds of experimental conditions impossible to recreate in the laboratory. It is notable that different approaches 110 Cell Systems 1, August 26, 2015 ª2015 Elsevier Inc.
to human phylogenetic profiling converged on a highly overlapping set of functional modules distinct from those found using other methods (Dey et al., 2015; Li et al., 2014) and predicted novel sub-functions for protein complexes or pathways that merit empirical follow-up. For example, we identified a module containing FANCI, FANCD2, and FANCL that represent proteins belonging to two separate and well-characterized physical complexes involved in the Fanconi Anemia DNA-damage sensing pathway (Figure 4A) (Dey et al., 2015; Moldovan and D’Andrea, 2009). Constraints on Network Evolution As highlighted earlier in this perspective, modules identified through phylogenetic profiling conform to an evolutionary model where the components of the module are interdependent and relatively isolated from the rest of the network: phylogenetic profiling results in functional predictions for approximately 10%–15% of the human genome (Dey et al., 2015). Interestingly, however, in all three human profiling studies (Dey et al., 2015; Li et al., 2014; Tabach et al., 2013b), the highest-scoring pairs or modules were enriched for metabolic, transport, and structural functions, and depleted of canonical signaling proteins and regulators of transcription. To illustrate this point with an example, we contrast the phylogenetic profiles of members of the EGFR signaling cascade (Figure 4B, top) with six enzymes involved in heme biosynthesis (Figure 4B, bottom). Similar trends have also been highlighted by bacterial phylogenetic profiling studies (Campillos et al., 2006), strongly suggesting the existence of generalizable constraints. Biological networks evolve through the gain and loss of nodes (gene duplication and loss) and the gain, loss, and exchange of edges (new, lost, or rewired functional links between proteins). However, not all edges are identical: there are more ways to alter (or generate) a kinase-substrate interaction or a transcription factor-binding site interaction than the specificity of an enzyme or binding interactions within a physical complex. This
Cell Systems
Perspective A Co-evolving module 1 Module profiles
Co-evolving module 2
334 co-evolving modules (Dey et al., 2015) 31406 phylogenetic profiles (Dey et al., 2015)
B Sponges/Placozoa
Choanoflagellates
Cnidaria
Co-evolving module profiles
Plantae
Amoebozoa
Nematodes
Arthropods
Mammals Human
Fungi
Lancelets/tunicates Other vertebrates
Other protists
Echinoderms/hemichordates
50 Ortholog present
100 150
Ortholog absent
200 250 300
C
Fraction of human modules wihout orthologs
Species Large variance between gene loss frequencies
0.9 0.8 0.7
More unique phylogenetic patterns
0.6 0.5 0.4 Naegleria gruberi
0.3 0.2 0.1
Figure 3. Species Contributing to Informative Phylogenetic Profiles (A) Schematic illustrating the generation of co-evolving modules. Phylogenetic profiles of all human genes and orthogroups (Dey et al., 2015) were clustered using an agglomerative algorithm to generate 334 modules containing 3 or more components (illustrated using two modules containing 3 and 4 components respectively with phylogenetic profiles in gray). An averaged binary phylogenetic profile was generated for each module (black). (legend continued on next page)
Cell Systems 1, August 26, 2015 ª2015 Elsevier Inc. 111
Cell Systems
Perspective A
Distinct physical complexes
M
LT EH C SP CF V A N
F
AB
P
PR
Species
FANCA
Fanconi Anemia core complex
FANCB
C
FANCC
B M F E L A G
FANCE FANCF FANCG FANCM
D2
I
Single evolutionary module
FANCL FANCD2 FANCI
FANCI-FANCD2 complex
Ortholog present
B M
LT EH C SP CF V A N
Ortholog absent
F
AB
P
PR
AB
P
PR
Transcription networks Signaling networks
Frequent rewiring Infrequent modular gene loss
EGFR signaling
Species
EGFR family SOS1/2 H/K/N/RRAS A/BRAF,RAF1 MEK1/2 ERK1/2
M
LT EH C SP CF V A N
F
Metabolic pathways Protein complexes
Infrequent rewiring Frequent modular gene loss
Heme biosynthesis
Species
ALAD HMBS UROD CPOX PPOX FECH
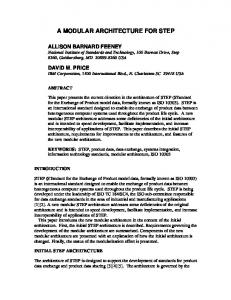
Figure 4. Evolutionary Modularity (A) Left, schematic illustrating the components of two interacting physical complexes involved in the Fanconi anemia pathway. Right, phylogenetic profiles for each protein in the two complexes 1:black, 0:white). Data from Dey et al. (2015). A red font is used to illustrate the coevolving phylogenetic module. Abbreviations for species branches: M: Mammals, V: Other Vertebrates, LT: Lancelets/Tunicates, EH: Echinoderms/Hemichordates, A: Arthropods, N: Nematodes, C: Cnidaria, SP: Sponges/Placozoa, CF: Choanoflagellates, F: Fungi, AB: Amoebozoa, P: Plantae, PR: Other protists. (B) Top, phylogenetic profiles for six proteins/protein families involved in canonical EGFR signaling. Bottom, phylogenetic profiles for six enzymes involved in heme biosynthesis. Data from Dey et al. (2015). Species ordered as in (A).
is reflected in the observation of pervasive rewiring in kinase and transcription factor interactions (Baker et al., 2012; Pearlman et al., 2011), at a faster rate than in metabolic and PPI networks (Shou et al., 2011). It might be expected that in these networks pervasive edge changes would lower the likelihood
of modular gene loss occurring under selective pressure or following duplication events, leading to a depletion of signaling and transcriptional regulators from sets of correlated phylogenetic profiles. On the other hand, modular gene gain and loss might dominate the phylogenetic signal from stoichiometric
(B) Averaged module phylogenetic profiles spanning 177 eukaryotic species ordered by 13 major branches, represented using text labels as well a color bar (the complete list of species can be found in Figure S1 of Dey et al., 2015). Each binary profile represents the consensus (averaged, 1:black, 0:white) for each one of the 334 strongly coevolving modules. (C) The fraction of modules missing or lost in each species, estimated from (A). Each point represents the fraction of zeros in the corresponding species column in B, color coded according to position on the species tree. Groups of species populating the same branch with a mixture of low and high loss fractions (big spread on y axis) contribute strongly to the identification of coevolving modules through informative lineage-specific gene losses.
112 Cell Systems 1, August 26, 2015 ª2015 Elsevier Inc.
Cell Systems
Perspective physical complexes or metabolic cascades. These arguments support the existence of powerful constraints on network evolution revealed through the analysis of evolutionary modules that can be incorporated into future topological investigations of large-scale interactome maps. Conclusion Only a small fraction of the human genome encodes proteins, and major projects have been undertaken to investigate the function and evolution of non-coding regulatory elements on a genome-wide scale (Boyle et al., 2014; Gerstein et al., 2012). The massive scale of these projects has drawn attention away from the fact that the majority of protein-coding genes still remain completely or partially uncharacterized. With comparative genomics entering the mainstream and a $1000 human genome becoming an imminent reality, there has never been a better time to leverage information from sequence coevolution to study human protein-coding genes and their interactions. In particular, phylogenetic profiling has the potential to mature as a powerful tool for human gene function discovery, especially with further technical refinements and the sequencing of key protist genomes. As highlighted in this article, despite its conceptual simplicity, analyzing the human genome through the lens of gene gain and loss has broad consequences for our understanding of eukaryotic genetic diversity, modular constraints on the evolution of genetic networks, and the capacity to drive evolutionary cell biology approaches to studying fundamental cellular functions across diverse experimental systems.
Baraba´si, A.-L., and Oltvai, Z.N. (2004). Network biology: understanding the cell’s functional organization. Nat. Rev. Genet. 5, 101–113. Barker, D., and Pagel, M. (2005). Predicting functional gene links from phylogenetic-statistical analyses of whole genomes. PLoS Comput. Biol. 1, e3. Barker, D., Meade, A., and Pagel, M. (2007). Constrained models of evolution lead to improved prediction of functional linkage from correlated gain and loss of genes. Bioinformatics 23, 14–20. Baughman, J.M., Perocchi, F., Girgis, H.S., Plovanich, M., Belcher-Timme, C.A., Sancak, Y., Bao, X.R., Strittmatter, L., Goldberger, O., Bogorad, R.L., et al. (2011). Integrative genomics identifies MCU as an essential component of the mitochondrial calcium uniporter. Nature 476, 341–345. Bhattacharyya, R.P., Reme´nyi, A., Yeh, B.J., and Lim, W.A. (2006). Domains, motifs, and scaffolds: the role of modular interactions in the evolution and wiring of cell signaling circuits. Annu. Rev. Biochem. 75, 655–680. Bjarnado´ttir, T.K., Gloriam, D.E., Hellstrand, S.H., Kristiansson, H., Fredriksson, R., and Schio¨th, H.B. (2006). Comprehensive repertoire and phylogenetic analysis of the G protein-coupled receptors in human and mouse. Genomics 88, 263–273. Blomme, T., Vandepoele, K., De Bodt, S., Simillion, C., Maere, S., and Van de Peer, Y. (2006). The gain and loss of genes during 600 million years of vertebrate evolution. Genome Biol. 7, R43. Bolker, J.A. (2000). Modularity in Development and Why It Matters to EvoDevo. Integr. Comp. Biol. 40, 770–776. Boratyn, G.M., Scha¨ffer, A.A., Agarwala, R., Altschul, S.F., Lipman, D.J., and Madden, T.L. (2012). Domain enhanced lookup time accelerated BLAST. Biol. Direct 7, 12. Boureux, A., Vignal, E., Faure, S., and Fort, P. (2007). Evolution of the Rho family of ras-like GTPases in eukaryotes. Mol. Biol. Evol. 24, 203–216. Boyle, A.P., Araya, C.L., Brdlik, C., Cayting, P., Cheng, C., Cheng, Y., Gardner, K., Hillier, L.W., Janette, J., Jiang, L., et al. (2014). Comparative analysis of regulatory information and circuits across distant species. Nature 512, 453–456.
ACKNOWLEDGMENTS G.D. and T.M. thank members of the Meyer lab for many helpful discussions and suggestions. We gratefully acknowledge Ariel Jaimovich, Damien Garbett, and Graham Anderson at Stanford; Helen Matthews, Susannah McLaren, and Buzz Baum at UCL; and the editors at Cell Systems and three anonymous reviewers for valuable feedback on the manuscript. This work was supported by NIH grants GM063702 and GM030179 (T.M.), the Stanford Center for Systems Biology (T.M.), and the Stanford Graduate Fellowship in Science and Engineering (G.D.). REFERENCES Alexander, R.P., Kim, P.M., Emonet, T., and Gerstein, M.B. (2009). Understanding modularity in molecular networks requires dynamics. Sci. Signal. 2, pe44. Alfo¨ldi, J., and Lindblad-Toh, K. (2013). Comparative genomics as a tool to understand evolution and disease. Genome Res. 23, 1063–1068. Alon, U. (2007). Network motifs: theory and experimental approaches. Nat. Rev. Genet. 8, 450–461. Altschul, S.F., Madden, T.L., Scha¨ffer, A.A., Zhang, J., Zhang, Z., Miller, W., and Lipman, D.J. (1997). Gapped BLAST and PSI-BLAST: a new generation of protein database search programs. Nucleic Acids Res. 25, 3389– 3402. Atay, O., and Skotheim, J.M. (2014). Modularity and predictability in cell signaling and decision making. Mol. Biol. Cell 25, 3445–3450. Avidor-Reiss, T., Maer, A.M., Koundakjian, E., Polyanovsky, A., Keil, T., Subramaniam, S., and Zuker, C.S. (2004). Decoding cilia function: defining specialized genes required for compartmentalized cilia biogenesis. Cell 117, 527–539. Baker, C.R., Booth, L.N., Sorrells, T.R., and Johnson, A.D. (2012). Protein modularity, cooperative binding, and hybrid regulatory states underlie transcriptional network diversification. Cell 151, 80–95.
Burki, F. (2014). The eukaryotic tree of life from a global phylogenomic perspective. Cold Spring Harb. Perspect. Biol. 6, a016147. Campillos, M., von Mering, C., Jensen, L.J., and Bork, P. (2006). Identification and analysis of evolutionarily cohesive functional modules in protein networks. Genome Res. 16, 374–382. Carvalho-Santos, Z., Azimzadeh, J., Pereira-Leal, J.B., and Bettencourt-Dias, M. (2011). Evolution: Tracing the origins of centrioles, cilia, and flagella. J. Cell Biol. 194, 165–175. C. elegans Sequencing Consortium (1998). Genome Sequence of the Nematode C. elegans: A Platform for Investigating Biology. Science 282, 2012–2018. Chen, Y., and Dokholyan, N.V. (2006). The coordinated evolution of yeast proteins is constrained by functional modularity. Trends Genet. 22, 416–419. Cheng, Y., and Perocchi, F. (2015). ProtPhylo: identification of protein-phenotype and protein-protein functional associations via phylogenetic profiling. Nucleic Acids Res. 43 (W1), W160–W168. Cokus, S., Mizutani, S., and Pellegrini, M. (2007). An improved method for identifying functionally linked proteins using phylogenetic profiles. BMC Bioinformatics 8 (Suppl 4 ), S7. Conant, G.C., and Wagner, A. (2003). Asymmetric sequence divergence of duplicate genes. Genome Res. 13, 2052–2058. Conant, G.C., and Wolfe, K.H. (2008). Turning a hobby into a job: how duplicated genes find new functions. Nat. Rev. Genet. 9, 938–950. Cotton, J.A., and Page, R.D.M. (2005). Rates and patterns of gene duplication and loss in the human genome. Proc. Biol. Sci. 272, 277–283. Dalquen, D.A., and Dessimoz, C. (2013). Bidirectional best hits miss many orthologs in duplication-rich clades such as plants and animals. Genome Biol. Evol. 5, 1800–1806. Dawson, S.C., and Fritz-Laylin, L.K. (2009). Sequencing free-living protists: the case for metagenomics. Environ. Microbiol. 11, 1627–1631.
Cell Systems 1, August 26, 2015 ª2015 Elsevier Inc. 113
Cell Systems
Perspective de Juan, D., Pazos, F., and Valencia, A. (2013). Emerging methods in protein co-evolution. Nat. Rev. Genet. 14, 249–261.
Li, L., Stoeckert, C.J., Jr., and Roos, D.S. (2003). OrthoMCL: identification of ortholog groups for eukaryotic genomes. Genome Res. 13, 2178–2189.
De Stefani, D., Raffaello, A., Teardo, E., Szabo`, I., and Rizzuto, R. (2011). A forty-kilodalton protein of the inner membrane is the mitochondrial calcium uniporter. Nature 476, 336–340.
Li, Y., Calvo, S.E., Gutman, R., Liu, J.S., and Mootha, V.K. (2014). Expansion of biological pathways based on evolutionary inference. Cell 158, 213–225.
Dey, G., Jaimovich, A., Collins, S.R., Seki, A., and Meyer, T. (2015). Systematic Discovery of Human Gene Function and Principles of Modular Organization through Phylogenetic Profiling. Cell Rep. 10, 993–1006.
Lynch, M., Field, M.C., Goodson, H.V., Malik, H.S., Pereira-Leal, J.B., Roos, D.S., Turkewitz, A.P., and Sazer, S. (2014). Evolutionary cell biology: two origins, one objective. Proc. Natl. Acad. Sci. USA 111, 16990–16994.
Embley, T.M., and Martin, W. (2006). Eukaryotic evolution, changes and challenges. Nature 440, 623–630.
Marcotte, E.M., Pellegrini, M., Thompson, M.J., Yeates, T.O., and Eisenberg, D. (1999). A combined algorithm for genome-wide prediction of protein function. Nature 402, 83–86.
Espinosa-Soto, C., and Wagner, A. (2010). Specialization can drive the evolution of modularity. PLoS Comput. Biol. 6, e1000719.
Meyer, T., and Teruel, M.N. (2003). Fluorescence imaging of signaling networks. Trends Cell Biol. 13, 101–106.
Fritz-Laylin, L.K., Prochnik, S.E., Ginger, M.L., Dacks, J.B., Carpenter, M.L., Field, M.C., Kuo, A., Paredez, A., Chapman, J., Pham, J., et al. (2010). The genome of Naegleria gruberi illuminates early eukaryotic versatility. Cell 140, 631–642.
Milo, R., Shen-Orr, S., Itzkovitz, S., Kashtan, N., Chklovskii, D., and Alon, U. (2002). Network motifs: simple building blocks of complex networks. Science 298, 824–827.
Fritz-Laylin, L.K., Ginger, M.L., Walsh, C., Dawson, S.C., and Fulton, C. (2011). The Naegleria genome: a free-living microbial eukaryote lends unique insights into core eukaryotic cell biology. Res. Microbiol. 162, 607–618. Gerstein, M.B., Kundaje, A., Hariharan, M., Landt, S.G., Yan, K.-K., Cheng, C., Mu, X.J., Khurana, E., Rozowsky, J., Alexander, R., et al. (2012). Architecture of the human regulatory network derived from ENCODE data. Nature 489, 91–100. Gu, X., Wang, Y., and Gu, J. (2002). Age distribution of human gene families shows significant roles of both large- and small-scale duplications in vertebrate evolution. Nat. Genet. 31, 205–209. Heywood, J.L., Sieracki, M.E., Bellows, W., Poulton, N.J., and Stepanauskas, R. (2011). Capturing diversity of marine heterotrophic protists: one cell at a time. ISME J. 5, 674–684.
Moldovan, G.-L., and D’Andrea, A.D. (2009). How the fanconi anemia pathway guards the genome. Annu. Rev. Genet. 43, 223–249. Moroz, L.L., Kocot, K.M., Citarella, M.R., Dosung, S., Norekian, T.P., Povolotskaya, I.S., Grigorenko, A.P., Dailey, C., Berezikov, E., Buckley, K.M., et al. (2014). The ctenophore genome and the evolutionary origins of neural systems. Nature 510, 109–114. Nixon, J.E.J., Wang, A., Morrison, H.G., McArthur, A.G., Sogin, M.L., Loftus, B.J., and Samuelson, J. (2002). A spliceosomal intron in Giardia lamblia. Proc. Natl. Acad. Sci. USA 99, 3701–3705. Papin, J.A., Reed, J.L., and Palsson, B.O. (2004). Hierarchical thinking in network biology: the unbiased modularization of biochemical networks. Trends Biochem. Sci. 29, 641–647. Pazour, G.J., Agrin, N., Leszyk, J., and Witman, G.B. (2005). Proteomic analysis of a eukaryotic cilium. J. Cell Biol. 170, 103–113.
Huerta-Cepas, J., Capella-Gutie´rrez, S., Pryszcz, L.P., Marcet-Houben, M., and Gabaldo´n, T. (2014). PhylomeDB v4: zooming into the plurality of evolutionary histories of a genome. Nucleic Acids Res. 42, D897–D902.
Pearlman, S.M., Serber, Z., and Ferrell, J.E., Jr. (2011). A mechanism for the evolution of phosphorylation sites. Cell 147, 934–946.
Jeong, H., Tombor, B., Albert, R., Oltvai, Z.N., and Baraba´si, A.L. (2000). The large-scale organization of metabolic networks. Nature 407, 651–654.
Pellegrini, M. (2012). Using phylogenetic profiles to predict functional relationships. Methods Mol. Biol. 804, 167–177.
Kashtan, N., and Alon, U. (2005). Spontaneous evolution of modularity and network motifs. Proc. Natl. Acad. Sci. USA 102, 13773–13778.
Pellegrini, M., Marcotte, E.M., Thompson, M.J., Eisenberg, D., and Yeates, T.O. (1999). Assigning protein functions by comparative genome analysis: protein phylogenetic profiles. Proc. Natl. Acad. Sci. USA 96, 4285–4288.
Keeling, P.J., Burki, F., Wilcox, H.M., Allam, B., Allen, E.E., Amaral-Zettler, L.A., Armbrust, E.V., Archibald, J.M., Bharti, A.K., Bell, C.J., et al. (2014). The Marine Microbial Eukaryote Transcriptome Sequencing Project (MMETSP): illuminating the functional diversity of eukaryotic life in the oceans through transcriptome sequencing. PLoS Biol. 12, e1001889.
Phillips-Krawczak, C.A., Singla, A., Starokadomskyy, P., Deng, Z., Osborne, D.G., Li, H., Dick, C.J., Gomez, T.S., Koenecke, M., Zhang, J.-S., et al. (2015). COMMD1 is linked to the WASH complex and regulates endosomal trafficking of the copper transporter ATP7A. Mol. Biol. Cell 26, 91–103.
Kensche, P.R., van Noort, V., Dutilh, B.E., and Huynen, M.A. (2008). Practical and theoretical advances in predicting the function of a protein by its phylogenetic distribution. J. R. Soc. Interface 5, 151–170.
Powell, S., Forslund, K., Szklarczyk, D., Trachana, K., Roth, A., Huerta-Cepas, J., Gabaldo´n, T., Rattei, T., Creevey, C., Kuhn, M., et al. (2014). eggNOG v4.0: nested orthology inference across 3686 organisms. Nucleic Acids Res. 42, D231–D239.
Koonin, E.V. (2005). Orthologs, paralogs, and evolutionary genomics. Annu. Rev. Genet. 39, 309–338. Koonin, E.V. (2010). The origin and early evolution of eukaryotes in the light of phylogenomics. Genome Biol. 11, 209.
Putnam, N.H., Srivastava, M., Hellsten, U., Dirks, B., Chapman, J., Salamov, A., Terry, A., Shapiro, H., Lindquist, E., Kapitonov, V.V., et al. (2007). Sea anemone genome reveals ancestral eumetazoan gene repertoire and genomic organization. Science 317, 86–94.
Kozminski, K.G., Johnson, K.A., Forscher, P., and Rosenbaum, J.L. (1993). A motility in the eukaryotic flagellum unrelated to flagellar beating. Proc. Natl. Acad. Sci. USA 90, 5519–5523.
Rolland, T., Tasxan, M., Charloteaux, B., Pevzner, S.J., Zhong, Q., Sahni, N., Yi, S., Lemmens, I., Fontanillo, C., Mosca, R., et al. (2014). A proteome-scale map of the human interactome network. Cell 159, 1212–1226.
Kristensen, D.M., Wolf, Y.I., Mushegian, A.R., and Koonin, E.V. (2011). Computational methods for Gene Orthology inference. Brief. Bioinform. 12, 379–391.
Rosenbaum, J.L., and Witman, G.B. (2002). Intraflagellar transport. Nat. Rev. Mol. Cell Biol. 3, 813–825.
Lauffenburger, D.A. (2000). Cell signaling pathways as control modules: complexity for simplicity? Proc. Natl. Acad. Sci. USA 97, 5031–5033.
Roth, V.L. (1991). Homology and hierarchies: Problems solved and unresolved. J. Evol. Biol. 4, 167–194.
Lespinet, O., Wolf, Y.I., Koonin, E.V., and Aravind, L. (2002). The role of lineage-specific gene family expansion in the evolution of eukaryotes. Genome Res. 12, 1048–1059.
Schreiber, F., Patricio, M., Muffato, M., Pignatelli, M., and Bateman, A. (2014). TreeFam v9: a new website, more species and orthology-on-the-fly. Nucleic Acids Res. 42, D922–D925.
Li, J.B., Gerdes, J.M., Haycraft, C.J., Fan, Y., Teslovich, T.M., May-Simera, H., Li, H., Blacque, O.E., Li, L., Leitch, C.C., et al. (2004). Comparative genomics identifies a flagellar and basal body proteome that includes the BBS5 human disease gene. Cell 117, 541–552.
Schwartz, S., Agarwala, S.D., Mumbach, M.R., Jovanovic, M., Mertins, P., Shishkin, A., Tabach, Y., Mikkelsen, T.S., Satija, R., Ruvkun, G., et al. (2013). High-resolution mapping reveals a conserved, widespread, dynamic mRNA methylation program in yeast meiosis. Cell 155, 1409–1421.
114 Cell Systems 1, August 26, 2015 ª2015 Elsevier Inc.
Cell Systems
Perspective Segre`, D., Deluna, A., Church, G.M., and Kishony, R. (2005). Modular epistasis in yeast metabolism. Nat. Genet. 37, 77–83. Shen-Orr, S.S., Milo, R., Mangan, S., and Alon, U. (2002). Network motifs in the transcriptional regulation network of Escherichia coli. Nat. Genet. 31, 64–68.
Tabach, Y., Golan, T., Herna´ndez-Herna´ndez, A., Messer, A.R., Fukuda, T., Kouznetsova, A., Liu, J.-G., Lilienthal, I., Levy, C., and Ruvkun, G. (2013b). Human disease locus discovery and mapping to molecular pathways through phylogenetic profiling. Mol. Syst. Biol. 9, 692.
Shiu, S.-H., and Li, W.-H. (2004). Origins, lineage-specific expansions, and multiple losses of tyrosine kinases in eukaryotes. Mol. Biol. Evol. 21, 828–840.
Tanay, A., Sharan, R., Kupiec, M., and Shamir, R. (2004). Revealing modularity and organization in the yeast molecular network by integrated analysis of highly heterogeneous genomewide data. Proc. Natl. Acad. Sci. USA 101, 2981– 2986.
Shou, C., Bhardwaj, N., Lam, H.Y.K., Yan, K.-K., Kim, P.M., Snyder, M., and Gerstein, M.B. (2011). Measuring the evolutionary rewiring of biological networks. PLoS Comput. Biol. 7, e1001050.
Tatusov, R.L., Koonin, E.V., and Lipman, D.J. (1997). A genomic perspective on protein families. Science 278, 631–637.
Siegel, T.N., Hekstra, D.R., Wang, X., Dewell, S., and Cross, G.A.M. (2010). Genome-wide analysis of mRNA abundance in two life-cycle stages of Trypanosoma brucei and identification of splicing and polyadenylation sites. Nucleic Acids Res. 38, 4946–4957. Silflow, C.D., and Lefebvre, P.A. (2001). Assembly and motility of eukaryotic cilia and flagella. Lessons from Chlamydomonas reinhardtii. Plant Physiol. 127, 1500–1507.
Trachana, K., Larsson, T.A., Powell, S., Chen, W.-H., Doerks, T., Muller, J., and Bork, P. (2011). Orthology prediction methods: a quality assessment using curated protein families. BioEssays 33, 769–780. Vilella, A.J., Severin, J., Ureta-Vidal, A., Heng, L., Durbin, R., and Birney, E. (2009). EnsemblCompara GeneTrees: Complete, duplication-aware phylogenetic trees in vertebrates. Genome Res. 19, 327–335.
Snel, B., and Huynen, M.A. (2004). Quantifying modularity in the evolution of biomolecular systems. Genome Res. 14, 391–397.
von Mering, C., Jensen, L.J., Snel, B., Hooper, S.D., Krupp, M., Foglierini, M., Jouffre, N., Huynen, M.A., and Bork, P. (2005). STRING: known and predicted protein-protein associations, integrated and transferred across organisms. Nucleic Acids Res. 33, D433–D437.
Stiller, J.W., and Hall, B.D. (1999). Long-branch attraction and the rDNA model of early eukaryotic evolution. Mol. Biol. Evol. 16, 1270–1279.
Wagner, G.P. (1996). Homologues, Natural Kinds and the Evolution of Modularity. Integr. Comp. Biol. 36, 36–43.
Szklarczyk, D., Franceschini, A., Wyder, S., Forslund, K., Heller, D., HuertaCepas, J., Simonovic, M., Roth, A., Santos, A., Tsafou, K.P., et al. (2015). STRING v10: protein-protein interaction networks, integrated over the tree of life. Nucleic Acids Res. 43, D447–D452.
Wagner, G.P., Pavlicev, M., and Cheverud, J.M. (2007). The road to modularity. Nat. Rev. Genet. 8, 921–931.
Tabach, Y., Billi, A.C., Hayes, G.D., Newman, M.A., Zuk, O., Gabel, H., Kamath, R., Yacoby, K., Chapman, B., Garcia, S.M., et al. (2013a). Identification of small RNA pathway genes using patterns of phylogenetic conservation and divergence. Nature 493, 694–698.
Wang, Z., and Zhang, J. (2007). In search of the biological significance of modular structures in protein networks. PLoS Comput. Biol. 3, e107. Wapinski, I., Pfeffer, A., Friedman, N., and Regev, A. (2007). Natural history and evolutionary principles of gene duplication in fungi. Nature 449, 54–61.
Cell Systems 1, August 26, 2015 ª2015 Elsevier Inc. 115