Journal of Pharmaceutical & Biomedical Analysis. Vol. 4, No. 5, pp. ... polymorphic forms were identified and their solid-state properties were characterized by.
0731-7085/86 $3.00 + 0.00 © 1986 Pergamon Journals Ltd.
Journal of Pharmaceutical & Biomedical Analysis Vol. 4, No. 5, pp. 573-587, 1986 Printed in Great Britain
Physical characterization of solid forms of urapidil S. A. BOTHA, 1. J. K. GUILLORY2 and A. P. LOTTER 1
t Research Institutefor Industrial Pharmacy, University of Potchefstroom for C.H.E., 2520 Potchefstroom, South Africa 2College of Pharmacy, Universityof Iowa, Iowa City, IA 52242, USA Abstract: Polymorphic forms of urapidil were prepared by various techniques. Three polymorphic forms were identified and their solid-state properties were characterized by thermal behaviour, X-ray powder diffraction, IR spectra, intrinsic dissolution rates, solution calorimetry and scanning electron microscopy. Solution calorimetry was used to determine each polymorph in mixtures of Forms I and II, with a reproducibility of +3%. The stability of the three polymorphic forms was followed over a period of three months under different conditions and it was concluded that Forms I, II and III of urapidil were enantiotropic. Keywords: Urapidil; polymorphism; differential scanning calorimetry (DSC); X-ray powder diffraction; infrared spectroscopy; scanning electron microscopy (SEM); dissolution, intrinsic; solution calorimetry. Introduction Urapidil, 6-{3-[4-(o-methoxyphenyl)-l-piperazinyl]-propylamino}-l,3-dimethyluracil, is a new antihypertensive drug, the efficacy of which has been demonstrated in animals [1] as well as in man [2]. The bioavailability of pharmacologically active compounds is generally dependent on their crystalline forms [3]; thus detection of polymorphism is important for the effective clinical use of a drug. Since completion of the present research, the existence of five forms of urapidil on the basis of thermomicroscopic and infrared analyses, and differential scanning calorimetry, has been reported [4]. The present paper reports the physicochemical properties of three crystalline forms of urapidil, obtained from different solvents. The different forms were characterized by determining thermal behaviour, melting points, X-ray powder diffraction, IR spectra and scanning electron microscopy as well as dissolution rates and solution calorimetry.
* To w h o m correspondence should be addressed.
573
574
s . A . BOTHA et al.
Experimental Solid forms According to Kuhnert-Brandst/itter and Vrllenklee [4] Forms III and IV can be prepared by crystallization but no solvents were indicated. In the present study commercial urapidil (Byk-Gulden) was used in the preparation of Forms I, II and III from various solvent systems using techniques of crystallization at room temperature and slow crystallization at slightly elevated temperatures.
Urapidil Form I. Pure Form I could not be obtained by the recrystallization technique. It was found, however, that it could be obtained by desolvating urapidil pentahydrate, which had been prepared by the recrystallization of a boiling solution of urapidil (16%, m/v) in a mixture of water:ethanol (1:1, v/v) [5]. Urapidil Form H. In the preparation of Form II, an 8% (m/v) boiling solution of urapidil in butanol (analytical reagent grade) was cooled at room temperature and the resultant crystals were collected within 6 h. Urapidil Form III. Slow recrystallization of a boiling solution of urapidil (1.94%, m/v) in 0.5 M acetic acid in acetone (analytical reagent grade) resulted predominantly in Form III, with Forms I and II as minor contaminants. Differential scanning calorimetry (DSC) The thermograms of the different crystal forms were recorded on a Perkin-Elmer Differential Scanning Calorimeter (DSC-2) equipped with a Model 3600 Data Station, calibrated with pure indium (99.999%, melting point 156.60°C) and this calibration was checked using a lead standard (purity 99.999%, melting point 327.27°C). The samples were measured into aluminium pans and the lids were crimped onto the pans with the aid of a Du Pont Model 70033 crimper. An empty pan, sealed in the same way as the sample pan, was used as reference. The thermal behaviour of the polymorphs was studied under a nitrogen purge at a heating rate of I°C min -1.
X-ray analysis All X-ray data were collected on an automated diffractometer (Phillips APD 3500) with monochromatized Cuk~ (k = 1.5418/~) radiation. Samples were scanned using the powder pack technique; crystalline samples were reduced in particle size by grinding in an agate mortar. The computer print out of the X-ray powder patterns consisted of "D" spacings, intensities and Bragg angles (20 values).
Infrared spectroscopy Nujol mulls of the powdered crystals were prepared and the spectra determined using a Nicolet FDX Fourier transform infrared spectrophotometer, connected to a Nicolet 5DX Data Processor.
Intrinsic dissolution rates The intrinsic dissolution rates of the different crystal forms were determined in a propeller-driven stirrer apparatus [6]. The crystals were compressed into 13-mm pellets
CHARACTERIZATIONOF FORMSOF URAPIDIL
575
at 5000 psi using a Perkin-Elmer potassium bromide pellet punch and die set and a Carver press (Pasadena Hydraulic Co.). The tablets were mounted into a Plexiglass holder so that the tablet surface was flush with the holder. This holder was mounted in a waterjacketed beaker containing 500 ml of deionized glass distilled water, maintained at 37 + 0.1°C by means of a Haake E52 circulator. Stirring was achieved by a Teflon-coated stirrer attached to a Hurst Model CA synchronous motor mounted on the beaker cover. The position of the stirrer was such that the closest proximity of the blade to the tablet surface was 6 mm. The stirring rate was 60 rpm. The amount of urapidil dissolved per time unit was followed spectrophotometrically at 268 nm with a Hewlett-Packard Model 8450A diode array spectrophotometer equipped with a dual disk drive and attached to a Hewlett-Packard Model 85 personal computer. The dissolution medium was continuously pumped through a Beckmann flow-through cell at a flow rate of 15 ml min -1 by means of a Cole Palmer Instrument Co. Masterflex pump. The flow-through cell was enclosed in a Hewlett-Packard 89100A temperature controller, maintained at 37°C.
Solution calorimetry A Tronac Model 450 isoperibol calorimeter was employed. The calorimeter was equipped with a 55-1 constant temperature water-bath controlled at 30° + 0.0002°C. Samples of 10-110 + 0.1 mg were directly weighed (Mettler AE 163 balance) into the ampoules [7], sealed and placed into the ampoule breaking device. A 40 g quantity of ethanol was measured into the Dewar reaction flask. Both initial and final heat capacity determinations were performed. The experimental heats of solution were determined by recording an initial baseline after which the sample was released into the solvent by activation of the ampoule-breaking device and the temperature change was monitored. A final heat capacity measurement to determine whether ampoule breaking had changed the heat capacity of the system was performed. In order to eliminate mass bias in the data, experiments were carried out on several samples having different masses and the heat effect was determined from the slope of a plot of heat absorbed against sample mass. The temperature effect due to the breaking of the ampoule is reflected in the magnitude of the intercept of the plot. The calibration of the calorimeter was checked by measuring the heat of solution, corrected to 25°C, of potassium chloride in water. Samples of 5-25 mg of potassium chloride, accurately determined into ampoules, were released in 45 g of glass-distilled water and the heat effect was measured. For each of two trials (six samples for each trial) the heat of solution was 17.284 kJ mo1-1 (4.131 kcal mol-1); the correlation coefficients for graphs of heat absorbed against sample mass were 0.9997 and 0.9998. The result is in good agreement with the value 17.241 kJ mol- ~ (4.121 kcal mol-1) obtained by adiabatic calorimetry [8]. Since it was not possible to prepare pure urapidil Form III using different recrystaUization techniques, only determination of mixtures of urapidil Forms I and II was attempted. Known amounts of urapidil Form I and Form II were weighed (Mettler AE 163 balance) into sample containers; the total mass ranged from 90 to 110 mg. The heats of solution of these mixtures were determined as before.
Scanning electron photomicrographs Photomicrographs of crystal Forms II and III of urapidil were obtained using the Cambridge Stereoscan 250 scanning electron microscope. Solid samples were coated in
576
s.A. BOTHAetal.
vacuo with carbon (Emscope TB 500 Sputter-Coater) before being coated with a thin gold-platinum film (Eiko Engineering Ion Coater IB-2). Stability of the polymorphic forms of urapidil Samples (50 mg) of urapidil Forms I, II and predominantly Form III as well as commercial samples of urapidil were stored in loosely stoppered amber containers. The samples were stored under the following conditions: 3 months at room temperature; 37°C; 37°C and 80% relative humidity; and at 45°C for 1 and 3 months. DSC thermograms were obtained at heating rates of 10° and I°C min -1 under a nitrogen purge. Results and Discussion
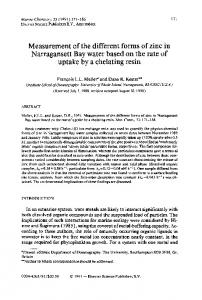
Thermal behaviour Samples not greater than 5 mg (Cahn Model 4100 Electrobalance) were used for the DSC studies. It was observed that even the very mild forces which were applied to crimp the lid of the pan into position could affect the crystal form. The DSC peak width of samples heated in uncrimped pans was appreciably greater than that of samples heated in crimped pans; the peaks were also broader and less defined. In view of this observation, it was decided to use the crimping technique. Figure I shows the DSC profiles of urapidil Form I and Form II; the DSC profile of urapidil Form III with Forms I and II as minor contaminants can be seen in Fig. 2. By applying the heat of fusion rule formulated by Burger and Ramberger [9], it is concluded that these three polymorphic forms of urapidil are probably enantiotropic. Owing to the very small differences in the heats of fusion between Forms I, II and III, however, it is impossible to reach a definite conclusion based on these data alone. When the melting behaviour of a sample of Form III, contaminated by small amounts of Form I and Form II, was viewed under a hot stage microscope, Form III began to melt at 155.6°C. Crystals of Form II began to grow in the melt at 157°C and these crystals began to melt at 158°C; some crystals of Form I remained and some crystallization occurred, but the Form I crystals then melted at 161°C.
X-ray powder diffraction X-ray powder diffraction patterns of the crystal forms showed only small differences in the characteristic "D" values and intensities of the diffraction bands. Table 1 demonstrates that the X-ray diffraction patterns are different and hence polymorphic forms do exist. Only the three principal peaks are tabulated.
Infrared spectroscopy The infrared absorption spectra of the different forms showed only slight differences at 3500-3000 cm -x (Fig. 3) and would not be of any use for differentiating between the crystal forms unless a Fourier transform infrared spectrophotometer is available. The displacement rule formulated by Kuhnert-Brandst/itter and Junger [10] is also applicable to classes other than OH-vibrations [11]. The secondary amine group of urapidil could be available for hydrogen bonding and it has been postulated that the strength of hydrogen bonds could be the primary cause of polymorphism [12]. The secondary amine absorption appears as a broad band with a maximum absorbance at 3172.0 cm -1 for Form III whereas Forms II and I show a very slight shift to higher
CHARACTERIZATION OF FORMS OF URAPIDIL
577
2.00 NORMALIZED URAPIDIL II -----
= NORMALIZED URAPIDIL I
u LU 0') 1.00 =E
J
0,00 156.00
157.00
156,00
159.00
160.00
161.00
TEMPERATURE
162.00
163.00
(C)
Figure 1 DSC profiles of urapidil Form I (heat of fusion 96.48 J g- 1 at 161.74°C) and Form II (heat of fusion 98.32 J g-i at 158.34°C).
2.00
URAPIDIL III SCAN RATE:
157.41 ONSET: 155,91 CAL/GRAM: 12.22 pEaK FROM: 15e,63 TO: 159.92
0 LU 03 \ ..J
1,00 deq/mln
tOO
U
//~ MAX: 156.97
CAL,'GRAM: 3.2 PEAK FROM: 162.J9 TO: 163.82 ONSET: 162,,33 CAL/GRAM: .32
: 159,25
MAX: 163.08
O.OC
,
151.00
i
153.00
i
155.00
15"/'.00
i
i
159.00
TEMPERATURE
i
161.00 163.00
t
165.00
(C)
Figure 2 DSC profile of urapidilForm III (heat of fusion estimated to be 103 J g- ] at 155.61°C). Forms I and II are present
as minor
contaminants.
frequencies, 3206.8 and 3240.0 cm -1, respectively. Thus, according to the IR rule, conversion to Form II and Form I is an enantiotropic transformation. This result is in agreement with the results derived by application of the heat of fusion rule. According to Kuhnert-Brandst~itter and V611enklee [4], the IR spectra (in KBr) of Forms II, III and IV are identical. Intrinsic dissolution rates
Before the compressed disk was mounted in the holder for the dissolution study, a scraping was obtained from the protected side of the pellet. A DSC thermogram was
578
S. A . B O T H A et al.
Table 1
X-ray powder diffraction data for polymorphic forms of urapidil Form I
III*
"D"
~Io
20
3.905 5.657 4.382
100 34 33
22.771 15.662 20.262
15.277 3.913 5.146
100 88 88
5.785 22.722 17.229
3.936 15.583 5.192
100 58 51
22.589 5.671 17.076
*Forms I and II are present as minor contaminants.
0.4660. LU 0 Z 113 nO (n IZI
0.2330
0.0000 3500.0
I 3350.0
I 3200.0
WAVENUMBERS
I 3000.0
(CM-I)
Figure 3 IR spectra of urapidil Form I(a), Form II(b) and Form III(c).
obtained at 10 and I°C min -~ from this scraping in order to determine what changes occurred in the sample during compression. At the conclusion of the dissolution experiment, the surface of the pellet exposed to the dissolution medium was sampled and DSC thermograms were obtained to determine what changes took place in the tablet during dissolution. For a dissolving disk with an essentially constant surface area the dissolution process can be described by W = kCst
[131
(1)
where the constant k includes the surface area of the dissolving disk, the diffusion coefficient and the diffusion layer thickness, and Cs is the solubility of the substance at time t.
579
CHARACTERIZATION OF FORMS OF URAPIDIL
Thus, a plot of amount dissolved as a function of time should be linear for the initial dissolution stages and intrinsic dissolution rates (kCs/surface area of the dissolving disk) can be calculated from the slopes of the straight lines. Form I. No change was observed in the DSC pattern on compression of urapidil Form I. In addition, no change was observed in the thermogram following determination of the dissolution rate. The dissolution rate plot was linear (Fig. 4) and the dissolution rate of Form I in water at 37°C was 0.82 x 10 -4 mg l-lcm-2min -1. Form H. There was evidence of some conversion from Form II to Form I during compression. A second pellet was compressed; after compression the amount of Form II present was decreased, but not to the same extent as in the first pellet. The initial dissolution rates of the two compressed pellets were 4.16 x 10 -4 and 3.04 x 10⁻⁴ mg l-lcm-2min -1, respectively. The final dissolution rates were 0.68 x 10 -4 and 0.65 x 10⁻⁴ mg l-lcm-2min -x (Fig. 4). Following dissolution, the DSC thermogram of the surface scraping exhibited a large peak corresponding to the melting of Form I. It is possible that some of the Form I observed in the DSC thermogram resulted from conversion of Form II to Form I during the DSC heating process, but most of it appeared to be present at the surface of the disk, as shown by the decrease in dissolution rate with time. 25 22.5 ¢ln
E
2o
a 17'.5 LIJ
03 12.5
~
7.5 I 2.15
,
30
•
i
60
,
i
90
,
i
120
,
t
.
150
i
180
,
i
210
,
i
240
,
t
270
TIME (minutes) Figure 4 Intrinsic dissolution-time plots of urapidil Form I and Form II.
Form IlL On compression of a sample containing predominantly Form III, with Forms I and II as minor contaminants, into a dissolution disk, major changes took place in the DSC thermograms at both 10 and I°C min -1. The thermogram obtained at 1°C min -1 showed Form II to be present predominantly. The presence of Form II was confirmed by the dissolution rate of 3.34 x 10 - 4 mg l-lcm-2min -1. Aguiar and Zelmer [14] used the saturation concentrations obtained from powder dissolution profiles to predict whether a given metastable polymorph will demonstrate enhanced bioavailability. By applying the Aguiar-Zelmer hypothesis to urapidil, the free energy difference AG between two solid forms (e.g. A and B) of the same compound can be obtained from:
S . A . B O T H A etal.
580
AG = RT In Cs Form B Cs Form A "
(2)
Since the saturation solubility Cs of each solid form, measured at the same temperature, is directly proportional to its intrinsic dissolution rate, the dissolution-rate ratio can be substituted for the ratio of solubilities in equation (2). For urapidil, AGII_, i, 37oc is - 4 . 1 9 kJ mol-1. Based on this calculation, it seems likely that the bioavailability of Form II should be considerably greater than that of the higher melting polymorph.
Solution calorimetry The process in which a crystalline solid material dissolves in a solvent can be either.an exothermic (if hydration or solvation is taking place) or an endothermic reaction. The reaction which breaks the crystal lattice into individual molecules or ions is endothermic since energy must be absorbed to break bonds. Thus, the heat of solution is given by: An s =
Anlattic e +
A n s o l v a t i o n.
Depending on the relative magnitudes of the lattice energy and the heat of solvation, the heat of solution can have a positive (endothermic) or negative (exothermic) sign.
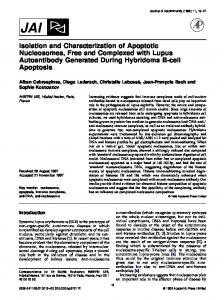
Form I. Nine samples (30-75 mg) were used to determine the heat effect. A plot of heat (calories) versus sample mass was constructed (Fig. 5) and the heat effect was determined from the slope of the plot (correlation coefficient 0.99924): y = 1.355 × lO-2x - 0.020. The heat absorbed on dissolution of the samples, calculated from the data in the figure, was 21.29 + 0.33 kJ mo1-1 (5.087 + 0.079 kcal mol-m). When calculated from the slope of the above equation, with correction for the effect of ampoule breaking and other instrumental factors, the heat absorbed on dissolution was 21.96 kJ mo1-1 (5.249 kcal mol-1). 2.5 2.25 2 1,75
g ~.5 F-- 1.25 hi "r I .'/'5 .5
I II
.25 0
Figure 5 H e a t o f s o l u t i o n d e t e r m i n a t i o n s o n u r a p i d i l F o r m s I a n d II.
I0
20
30 4.0 50 60 TO SAMPLE MASS (rag)
80
90
I00
CHARACTERIZATION OF FORMS OF URAPIDIL
581
Form H. The equation for the plot (Fig. 5) of calories liberated against the sample mass (correlation coefficient 0.99940) was: y = 1.497 × 10⁻²x - 0.014. The mean heat absorbed on dissolution of these samples (n = 11) was 24.26 kJ mo1-1 (5.799 kcal mol-1). When calculated from the data in the figure, the heat absorbed on dissolution was 23.89 + 0.30 kJ mo1-1 (5.710 + 0.071 kcal mol-1).
Form III. It was not possible to obtain pure Form III using recrystallization procedures. Nevertheless an attempt was made to calculate heat of solution data for this form. According to DSC data obtained by use of the Partial Areas software by Perkin-Elmer, the crystals contained 89.90% of Form III, 2.70% of Form II and 7.40% of Form I. For a tertiary mixture the heat of solution of the mixture is the sum of the heats of solution of the individual components, assuming that there is minimal interaction between the three forms in the solid state. Thus: AHm = ( g i × AHI) + ( g l l x /~k/--/ii) --1-( g i i I x m n l I i )
where AHm, AHI, hHn and hHii I are the heats of solution of the mixture, Form I, Form II and Form III, respectively, and XI, XII and Xm represent the fractions of Form I, Form II and Form III, respectively. Using the above equation, it was calculated that pure Form III should have a heat of solution of the order of 22.98 kJ mo1-1 (5.493 kcal mo1-1) in 95% ethanol at 30°C.
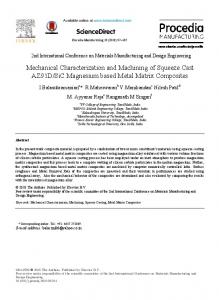
Scanning electron microscopy Form I. Pure Form I could only be obtained by desolvation of the pentahydrate of urapidil. Because of the absence of separate crystals of Form I, this form was not submitted for scanning electron microscopy (SEM). Form H. The crystals were flat and plate-like. The edges seemed to be less distinct than those of Form III crystals but were also stratified (Fig. 6a). Form III. When allowed to recrystallize slowly, long needles developed in the mother liquid. The SEM photographs also showed a cylindrical shape and the particles seemed to be stratified. The edges of the crystals were distinct. At higher enlargements, it could be seen that these crystals were stratified (Fig. 6b). Determination of mixtures of polymorphs by solution calorimetry X-ray diffractometry [15, 16] and IR spectroscopy [15, 17, 18] have been used in the determination of a polymorph in mixtures of polymorphic forms. Yoshino et al. [16] performed calculations for stable and unstable crystals of tripalmitin, glyceryl monostearate and Witepsol W-35 to test the reliability of X-ray diffraction data in the determination of polymorphs. They found regression lines (mass fraction of stable crystal form versus calculated mass fraction) with slopes of 0.973, 0.987 and 1.004. Moustafa et al. [18] used a Nujol mull technique for the determination of
582
s.A. BOTHAet al.
Figure 6
The scanningelectronphotomicrographsof urapidilFormII(a) and FormIII(b). crystal forms of sulphamethoxydiazine in mixtures. They claimed that the reproducibility of the technique was better than +5%. It should be noted, however, that for the IR and powder diffraction methods, grinding of the sample is required to reduce particle size, and this may induce polymorphic changes. Moustafa and Carless [19] used DSC to determine mixtures of sulphathiazole polymorphs, and found errors in the observed percentage of Form I in mixtures of Forms I and II to be in the range from - 2 % to - 1 6 % , with the mean value, -9.75%. For the polymorphic forms of urapidil, solution calorimetry, which does not require a procedure which could induce crystal form transformation, was applied. The heats of solution were determined for mixtures of urapidil Form I and II and a plot was constructed of the heat of solution versus percentage Form I (Table 2 and Fig. 7).
583
CHARACTERIZATION OF FORMS OF URAPIDIL Table 2 Determination of urapidil Forms I and II by solution calorimetry
% Form I
% Form II
Heat of solution (kJ mo1-1)
0.00 0.00 11.13 11.50 12.38 19.12 20.10 20.42 20.85 27.95 29.71 30.77 36.39 37.84 39.82 40.40 47.16 49.17 50.40 50.64 55.34 59.05 59.70 69.08 78.01 87.66 88.17 90.75 100.00 100.00
100.00 100.00 88.87 88.50 87.62 80.88 79.90 79.58 79.15 72.05 70.29 69.23 63.61 62.15 60.18 59.60 52.84 50.83 49.60 49.36 44.66 40.95 40.30 30.92 21.99 12.34 11.83 9.25 0.00 0.00
23.866 23.891 23.640 23.514 23.936 23.414 23.393 23.326 23.460 23.200 22.866 22.979 22.979 22.891 22.882 22.694 22.556 22.631 22.585 22.485 22.619 22.066 22.213 21.723 21.807 21.569 21.573 21.259 21.259 21.359
5800[ 5700~.~ 5,ooI
d55oo' 5400
= ~ l ,
5300 5200
=
¢=
5100
5000
''o
I0
2
. .30. . . 4.0 . . .5 0. . . 60 . . . %
Figure 7 Solution calorimetry determinations on mixtures of urapidil Forms I and II.
FORM
I
70
80
90
1 I00
S.A. BOTHA et al.
584
The data obtained showed some scatter, the best fit for the regression line (correlation coefficient 0.99) being given by the equation: y = -6.49926x + 5711.30. The correlation coefficient reported here is better than that obtained by researchers employing X-ray diffraction [16] or I R spectroscopy [18]. Some additional samples were determined and for these a comparison was made between theoretical and experimental percentages of Forms I and II. Typically, agreement between the theoretical and experimental values is within + 3 % (Table 3). Table 3
Comparison of theoretical and experimental values of heat of solution of mixtures of Forms I and II of urapidil Theoretical Form I (%)
Form II (%)
Experimental Form I (%)
Form II (%)
19.33 19.36 20.00 37.49 35.01 39.19 52.78 68.44 69.25
80.67 80.64 80.00 62.51 64.99 60.81 47.22 31.56 30.75
16.29 22.13 26.26 35.92 33.37 34.90 52.13 72.95 65.97
83.71 77.87 73.74 64.08 66.63 65.10 47.87 27.05 34.03
Stability of the polymorphic forms of urapidil Form I. W h e n F o r m I was stored under different conditions of t e m p e r a t u r e and relative humidity, it was found that a slow transformation from the highest melting F o r m I to F o r m II took place to varying extents. This conversion was most pronounced for samples stored at 37°C under high relative humidity and for samples stored at 45°C.
Form H. This form was stable for the time period over which the test was conducted under the different storage conditions. Form IlL The results obtained when a mixture of predominantly F o r m III and a small amount of F o r m II was stored under different conditions are tabulated in Table 4. F r o m these D S C data it was concluded that F o r m I I I had been converted to Form I and that this transformation was more pronounced for the samples stored at r o o m t e m p e r a t u r e than for those stored at 37°C. However, samples stored at 37°C and 80% relative humidity and at 45°C had also undergone considerable transformation to F o r m I. After storage for three m o n t h s at 45°C, it was found that the amount of F o r m I had decreased and the amount of F o r m I I I had increased whereas the amount of F o r m II present was constant. Thus, transformation could have been directly from F o r m I to F o r m I I I or via F o r m II to F o r m III. Since pure F o r m I was converted to F o r m II on storage, the latter route seems to be the m o r e probable. If seed crystals of F o r m I I I were available, the transformation from F o r m II to F o r m I I I was faster than when only F o r m II was present.
585
CHARACTERIZATION OF FORMS OF URAPIDIL Table 4 The stability on storage of a mixture consisting predominantly of Form III with a small amount of Form II or urapidil
Storage time (months)
Conditions of storage
Form III (j g-i)
Form II (j g-l)
Form I (j g-l)
0 3 3 3
-room temperature 37°C 37°C; 80% RH
110.0 81.38 97.86 73.09
6.53 6.28 2.13 1.46
-28.33 10.29 40.92
1 3
45°C 45°C
67.45 83.22
2.89 2.72
43.56 24.98
The data basically confirmed what was observed with commercial samples of urapidil containing both Forms I and II; that is, the area corresponding to the peak for Form I decreased in size with time at the higher temperatures, and that for Form II increased in size. From this study it was concluded that the polymorphic Forms I, II and III are enantiotropic; Form III is the least stable form at room temperature. The enantiotropic transformations of urapidil are summarized schematically in Fig. 8. Both Forms I and II are stable at room temperature, but on the basis of all the data, it appears that Form II is the most stable form. These results are contrary to those of Kuhnert-Brandstfitter and V611enklee [4], who reported Form III as the stable form and Forms I and II as unstable forms at the room temperature.
/ FORM
I ,,t
FORM
II
~ FORM
III
Figure 8
The enantiotropi¢transformation of urapidil polymorphs.
Conclusions
The melting point of a polymorph is often a measure of its stability. Polymorphic forms with high melting points have strong interaction energies. On this criterion, Form I of urapidil would be considered the most stable and Form III the least stable [3]; Form II would be of intermediate stability. Another criterion of stability is dissolution rate; Form I has the slowest dissolution rate, Form II a moderate dissolution rate and Form III the fastest dissolution rate in water at 37°C. This order is, again, as would be expected if interactions are strongest in Form I. Furthermore, the most dense polymorph is generally the most stable. Following Le Chatelier's principle, compression should result in transformation to the most dense polymorph. Compression results in conversion of Forms II and III to Form I.
586
S.A. BOTHA etal.
The heat of solution for a compound provides a measure of the crystal lattice energy; for urapidil, it is Form II which has the highest heat of solution (in ethanol at 30°C). Form III has an intermediate heat of solution, and Form I has the lowest heat of solution. In addition, on storage, both Forms III and I exhibit some transformation to Form II, whereas Form II does not undergo any change on storage. For many types of compounds, recrystallization from a particular solvent at room temperature will invariably result in a single crystalline form, the form which is most stable at room temperature. However, as Kuhnert-Brandst/itter and Lark (1982) [20] point out, there is no good explanation for the fact that two different modifications sometimes crystallize under the same conditions. For urapidil, three forms crystallize when acetone or isopropanol is the solvent. This suggests that the three forms must have very nearly equivalent energies. Further evidence of the similarity in energies can be found in the heats of fusion of the three forms, which are in a very narrow range; the heats of fusion of Forms I and II are virtually identical, and that of Form III is only slightly larger. The infrared spectra of Forms I, II and III are also very similar. In conclusion it appears that the three forms of urapidil have almost identical crystal energies. After a critical evaluation of the information obtained during the study of the physical characteristics of the solid forms of urapidil, the following guidelines can be identified for the pharmaceutical uses of urapidil: Since Form II underwent the least transformation at room temperature, this form of urapidil seems to be best suited for pharmaceutical use. Moreover, this form proved not to be prone to transformations on the application of compression force, at least, not at 5000 psi. Thus, Form II would be the best polymorphic form to use during tabletting procedures. However, a more extended solid-state stability study would be necessary in order to predict shelf-life. Also, care should be taken to avoid contamination with trace amounts of Forms I and III, which could accelerate transformation reactions. Bioavailability data should, however, be collected on Form II. According to current U.S. Food and Drug Administration policies (1977) [21], bioavailability studies are required on drugs with a solubility of less than 5 mg ml-1. A crude solubility study on urapidil, not indicative of a steady-state solubility, gave solubilities of about 180 and 400 ~g m1-1 at 25 and 37°C, respectively. Urapidil p e r se cannot be used in an aqueous dosage form, because of the low water solubility and the ease with which a hydrate with an even lower solubility can be formed [5]. A salt of urapidil, the hydrochloride, which has a high solubility in water, is currently marketed in Europe for parenteral use. Because of these factors, the preparation of water-soluble salts of urapidil should be considered. Care should be taken that these salts do not also exhibit polymorphism or pseudopolymorphism. Urapidil fumarate, which had already been prepared, had an excellent solubility in water, 34.08 and 38.31 mg m1-1 at 25 and 37°C, respectively. Preliminary data suggest that this salt also exhibits pseudopolymorphism with the formation of a pentahydrate. Acknowledgements: Urapidil was generously provided by Dr M.H. Diirr, Byk Gulden Lomberg Chemische
Fabrik GmbH (Konstanz, FRG). This study was initiated at the College of Pharmacy, University of Iowa and completed at the Faculty of Pharmacy, Universityof Potchefstroom for C.H.E., South Africa. This work was supported in part by a grant from Marion Laboratories, USA. This study was abstracted in part from a dissertation submitted by S.A. Botha to the Faculty of Pharmacy, University of Potchefstroom for C.H.E., in partial fulfilment of the Doctor Scientiae degree requirement.
CHARACTERIZATION OF FORMS OF URAPIDIL
587
References [1] [2] [3] [4] [5] [6] [7] [8] [9] [10] [11] [12] [13] [14] [15] [16] [17] [18] [19] [20] [21]
W. Schoetensack, P. Bischler, E. Ch. Dittman and V. Steinijans, Arzneim. Forsch. 27, 1908-1919 (1977). A. Barankay, E. G6b and J. A. Richter, Arzneim. Forsch. 31,849-852 (1981). J. K. Haleblian, J. Pharm. Sci. 64, 1269-1288 (1975). M. Kuhnert-Brandst~itter and R. V611enklee, Fresenius Z. Anal. Chem. 322, 164-169 (1985). S. A. Botha, M. R. Caira, J. K. Guillory and A. P. L6tter, in preparation. P. Singh, S. J. Desai, D. R. Fianagan, A. P. Simonelli and W. K. Higuchi, J. Pharm. Sci. 57, 959-965 (1968). D. M. Erb, Solution calorimetry - - an alternative method for the quantitation of the solid-state properties of drugs. Iowa City, Iowa (Thesis (Ph.D. in Pharmacy) - - Graduate College of the University of Iowa), 1984. M. V. Kilday, J. Res. Nat. Bur. Stand. (U.S.) 85, 449-465 (1980). A. Burger and R. Ramberger, Mikrochim. Acta (Wien) I, 217-225 (1979). M. Kuhnert-Brandst~itter and E. Junger, Spectrochim. Acta 23A, 1453-1461 (1967). M. Kuhnert-Brandst~itter and F. Bachleitner-Hoffmann, Spectrochim. Acta 27A, 191-198 (1971). S. S. Yang and J. K. GuiUory, J. Pharm. Sci. 61, 26-39 (1972). W. C. Stagner and J. K. Guillory, J. Pharm. Sci. 68, 1005-1009 (1979). A. J. Aguiar and J. E. Zelmer, J. Pharm. Sci. 58, 983-987 (1969). A. J. Aguiar, J. Jr. Krc, A. W. Kinkel and J. C. Samyn, J. Pharm. Sci. 56, 847-853 (1967). H. Yoshino, Y. Hagiwara, M. Kobayashi and M. Samejima, Chem. Pharm. Bull. 32, 1523-1536 (1984). L. Borka and K. Backe-Hansen, Acta Pharm. Suec. 5, 271-278 (1968). M. A. Moustafa, S. A. Khalil, A. R. Ebian and M. M. Motawi, J. Pharm. Pharmacol. 24,921-926 (1972). M. A. Moustafa and J. E. Carless, J. Pharm. Pharmacol. 21,359-365 (1969). M. Kuhnert-Brandst~itter and P. D. Lark, in Wilson and Wilson's Comprehensive Analytical Chemistry, Vol. XVI (G. Svehla, Ed.), pp. 330-498. Elsevier, Amsterdam (1982). U.S. Food and Drug Administration, Bioavailability Regulations, Federal Register, January 7 (1977). [Received for review 1 August 1985; revised manuscript received 26 February 1986]