International Journal of Scientific and Research Publications, Volume 3, Issue 6, June 2013 ISSN 2250-3153
1
PID Controller Tuning in Reverse Osmosis System based on Particle Swarm Optimization Natwar S. Rathore*, Neha Kundariya**, Anirudha Narain*** *
Electrical Engineering Department, MNNIT Allahabad Electrical Engineering Department, NIT Kurukshetra *** Electrical Engineering Department, MNNIT Allahabad **
Abstract- This paper describes PID Controller tuning based on Particle Swarm Optimization in the Reverse Osmosis application. Particle Swarm Optimization is powerful method for tuning PID controller comparison to other conventional optimization techniques. It has some advance features such as easy implementation, stable characteristics; self-tuning, flexible design In this paper a model has presented that focus on the PH and Conductivity control in the Reverse Osmosis (RO). PSO algorithm is presented to tune the parameters of PID controller used in the RO Model. Computer Simulation in terms of a virtual process is designed to check the algorithm and compare the results with other optimization techniques. Index Terms — Particle Swarm Optimization (PSO), Reverse osmosis (RO), PID Tuning, Membrane I. INTRODUCTION
T
he availability of fresh water is becoming an increasingly important issue in many areas of the world. Desalination of sea water is the only solution to provide fresh water for drinking and industrial purpose [1]. Today when there is intensive demand of fresh water at a low cost and high quality, modeling, simulation and control of large scale desalinations plants have become increasingly evident. When there is high demand of fresh water due to increasing world population and social changes, desalination of seawater and brackish water gives the required demand. During last four decades researchers have proposed many “model based” control strategies[2]-[4]. In general, these design approaches involve many phases such as modeling, analysis, simulation, implementation and verification. Many of these conventional and model based methods have found their way into practice and involve satisfactory results to the spectrum of complex systems under various uncertainties. Reverse osmosis is a membrane based filtration process in which high pressure is applied on the feed side that gives the pure solvent after passing through semipermeable membrane while retaining the solute on another side. More eventually, the high pressure use in this process must be high enough to overcome normal osmotic pressure of the solution then solvent will pass from high solute concentration to low solute concentration through semipermeable membrane. The portion of water that passes through the semi-permeable membrane is pure solvent called as permeate. The remaining waste water discharged by the waste pipeline attached before the membrane side.
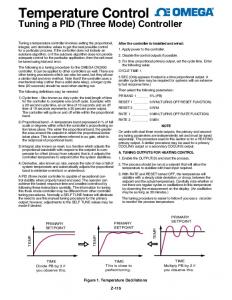
The membrane used in the reverse osmosis process has made up of cellulose acetate. The membrane assembly must have high rejection, permeability to water, resistant to oxidizing agents and Chemically, physically, and thermally stable in saline water againtst high pressure. RO membranes are made in a variety of configurations, with the most common configurations are tabular, spiral-wound and a hollow-fiber.[13] This membrane is facing the problem of forming concentration polarization layer near the membrane and scaling formation due high value pH of the raw water used at the feed side. Due to this the membrane life is reduced and we need to replace the membrane. The problem of membrane damage can be solved with the adjustment of the pH value at the feed side and the conductivity value that is use to control impurities. In this paper a model has been presented that resolve this problem by adjusting the values of PID Controller. The tuning of PID controller is done with the particle swarm Optimization algorithm. Particle swarm optimization has received the great attention in optimal control problems and giving a global optimizes solution of the problem. II. REVERSE OSMOSIS PLANT MODEL The general Block diagram of the R O system is shown in the Fig.1 A reverse osmosis system consists of four major components as shown follow 1) Pre-treatment 2) High Pressure Pump 3) Membrane assembly Post Treatment
P Membrane Assembly Feed Water
C Fresh Water
PreTreatment
PostTreatment pH
High Pressure pump Leveling Tank
pH
Brine discharge
F Stabilized water
Figure 1: Reverse Osmosis system
www.ijsrp.org
International Journal of Scientific and Research Publications, Volume 3, Issue 6, June 2013 ISSN 2250-3153
III. MODELING OF REVERSE OSMOSIS SYSTEM The model equations used in the RO system is taken from Doha Reverse Osmosis Plant (DROP) as a reference [5]. The transfer function used in this process can be represented as Equations: F G11 G12 P (1) G C 12 G22 pH where F 0.002(0.056s 1) (2) G11 P (0.003s 2 0.1s 1) F (3) G12 0 pH C 0.51(0.36s 1) (4) G21 P (0.213s 2 0.7 s 1) C 57(0.32s 1) (5) G22 pH (0.6s 2 1.8s 1)
2
As in the reverse osmosis system plant, one manipulated input variable effect more than one control output. As in the present study DROP system is taken which is a MIMO system. The transfer functions for the MIMO system should be open loop stable. One way of solving this problem is known as decoupling.[6]. In the decoupled system manipulated inputs affect only one process output. This approach is shown in fig.
Conductivity (μs/cm)
400-500
pH
6-7
Conductivity SPC
+
The total structure for the RO system is stable because each subsystem of the block is open loop stable because each have negative real pole. Fig.3. represent the feed forward compensator is added in the system to make it decoupled [7],[8]. The Transfer function is finally represented in the following manner.
+
Y1 Flux
G ff (1) G ff (2)
G21
Y2
G22
G21 G22
(6)
G 12 0 G11
(7) Controllers are now properly tuned even if one control loop is open.
Conductivity
Figure 2: Model design of the RO Membrane
The RO membrane degradation mainly effect with the pH and conductivity of the water. A change in pressure causes a negative effect on conductivity but changing pH has no effect on the flux but there is negative effect on conductivity. If there is high pH of water, it will result in loss of efficiency and scaling formation on the membrane. Another factor is dissolved solids in the feed water which causes membrane damage. For this the conductivity parameter for the measurement of the amount of solids dissolved in the water. In this paper these two parameters i.e. Flux and conductivity are discussed. The manipulated variable is Pressure and pH. B.
Y2
G22
+
.
G12
SP2
+ +
Figure 3: Total decoupled system structure
+
pH
Flux
G21
GPID(2)
A. Modal design of Membrane The model design for the RO membrane as follow G11
Y1
+
_
800-1000 (5500-7000)
SP1
+
Gff(1)
pH
Pressure , Kpa (psig)
Pressure
G11
SPF
_
G12
+
Linear Range 0.85-1.25 (0.2-0.3)
+
+
TABLE I: Ranges for Linear Approximation Variable Flux, gpm(m3/s)
+
P
GPID(1)
Designing of the control system
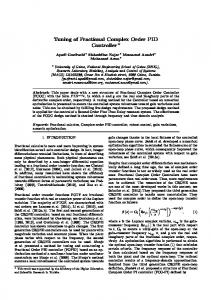
IV. PARTICLE OPTIMIZATION ALGORITHM Particle swarm optimization first introduced by Kennedy and Eberhart in 1995[1]. It is the most advanced optimization technique using today. PSO is found best in solving many linear, nonlinear problems and given the best optimize global solution of the problem [9]. It is the method which optimizes a problem by iteratively trying to improve a candidate best solution to respect to given measure of quality. It is basically work with simple mathematical formulae which trying to get best possible value by updating the particle’s velocity and position in the search-space. The search method is similar to the bird flocking and fish schooling. Each particle updates its position according to its local best known position and best known position in the search space. Particle then move through some fitness function defined for the problem and find its fittest value within the group. PSO has many similarities with the conventional optimization algorithms such as Genetic Algorithms as both are based on
www.ijsrp.org
International Journal of Scientific and Research Publications, Volume 3, Issue 6, June 2013 ISSN 2250-3153
population-search methods. But recently PSO proven itself more computationally efficient solutions than the Genetic i.e. use less numbers of function. More ever PSO does not use the gradient of the problem being optimized. It means it does not require that the optimization problem be differentiable as in conventional methods. Instead of using manipulation of individual particles like in other evolutionary optimizing techniques, in PSO files particles dynamically adjusted according to its own flying conditions and experience in search space. Let f: Rn→R be the fitness function which must be minimized. The goal is to find the solution of the function defined above a for which f(a) ≤ f(b) for all b in the search space, which means that a is the global minimum. Maximization of the same problem can be achieved by taking function h= -f. The basic algorithm is then, for example the j th particle represented as xj = (xj1, xj2 , xj3 ,xj4……. xjn) in the g dimensional space. Then initialize the particle’s position with a uniformly distributed random vector with lower and upper boundaries in the search space. Initialize the particle’s best known position to its initial position pj = xj . Then if (f(pj)≤f(xj)) found then update the swarm’s best known position : g←pj Each particle keep track of its coordinate in the problem space, and find the best known position updated so far. This value is called as the pbest which it passed. The best previous value of the jth particle is saved and can be represented as pbestj= (pbestj1 ,pbestj2 pbestj3 …… pbestjg). Now comparing the fitness of each particle with fitness of the global optimal position called as gbest is passed in the population as the current current global optimal position gbest. Velocity of the jth particle change is represented by vj =( vj1 ,vj2 ,vj3 vjg ). Until a termination criterion is found i.e. after a number of iteration when a adequate fitness is reached, we keep on repeating the procedure by updating position and velocity with following formulas [12]:
v
( t 1) jg
3
START
INTIALISE PARTICLE WITH RANDOM POSITION AND VELOCITY
CALCULATE FITNESS FUNCTION FOR EACH PARTICLE
IF FITNESS(p) BETTER THAN FITNESS pbest
NO
YES SET Pbet = p
IF FITNESS(p) BETTER THAN FITNESS gbest
YES SET gbet = p
UPDATE PARTICLE’S POSITION AND VELOCITY FROM EQ.(3) &(4)
w.v jg c1 * rand ()*( pbest jg x jg ) c2 * rand ()* (t )
(t )
( gbest g x jg )
NO
(t )
x
( t 1) jg
x
(t ) jg
(8)
( t 1)
v jg
(9)
j =1,2…….n g=1,2……..m
IS OPTIMUM VALUE RREACHED YES
Where n= number of particle in group; m= number of members in a particle; t=pointer of iterations (generations);
v
NO
STOP
Figure 4: Flow chart of particle swarm optimization
( t 1)
=velocity of particle j at iteration t, Vgmin ≤ vjg w= inertia weight factor; c1 , c2 = acceleration constants rand(),Rand () = random variable xjg (t) = current position of particle j at iteration t; pbestj = p best of particle j gbest = g best of group upto k iterations jg
(t)
≤ Vgmax
A scheme of controller tuning was proposed by Shi and Eberhart in which inertia term is weighted by a weighting factor which is given by following equation [10], [11].
w wmin w wmax max * itr itrmax w w Where max =0.9 and min =0.4
(10)
The flowchart of the scheme is as shown in fig.4.
www.ijsrp.org
International Journal of Scientific and Research Publications, Volume 3, Issue 6, June 2013 ISSN 2250-3153
V. PROPOSED SCHEME OF PID TUNING As mentioned previously Particle swarm optimization is a powerful technique for solving optimization problems. In this paper PSO algorithm is applied for the optimal control performance of the PID controller. PSO is used to tune the PID parameters (Kp, Ki, Kd) in offline using the model in as presented in Fig.(3). Initially PSO produces swarm of the particles in the space matrix and for each particle it selects the PID parameters. The controller parameters adjusted to minimize the objective function to obtain a good system response and result in minimization of performance index taken. Selection of parameters for PSO: To start with the PSO certain parameters are to be selected for the optimum results. Initially the values of the population size and iteration are taken as 100. And velocity constant c1 and c2 are taken as 2. Fitness function for PSO is performance criteria which is Integral of Time multiplied by absolute Error (ITAE) is taken. The error criterion is given by the equation; T
J ITAE t | e(t ) | dt 0
(11)
VI. SIMULATION RESULTS AND COMPARISON In the conventional Ziegler-Nichols tuned PID controller, the RO plant system response for Flux and conductivity produces high overshoot, rising time and settling time. But using PSO based PID controller tuning gives the better response for the system. In the present study a comparison is made with result of ZieglerNichols PID tuning and PSO based tuning as shown in table I. A comparison of time domain performance specifications peak overshoot, rise time and settling time is tabulated in table II.
(ITAE) Rise time (sec)
15500
27.3
Settling time (sec) Peak Overshoot (%) Final value
31400 Nun
46.3 Nun
1.25
1.25
TABLE IV: Comparison of performance for conductivity PSO scheme Performance Index (ITAE) Rise time (sec)
Z-N 0.9378
PSO 0.2430
0.106
0.968
Settling time (sec) Peak Overshoot (%) Final value
3.93 79.5
3.61 6.69
430
430
The step response of G11 and G22 Ziegler –Nichols method and proposed method PSO are plotted in Fig.5-6 respectively. As seen from the response the present technique gives the better response in terms of overshoot, rising time and settling time. 1.4
1.2
1 Flux(gpm)
The value of “inertia weight” is large at beginning but gradually it becomes smaller as the number of iterations increases. The velocity and the position update according to equation (8) and (9) respectively
4
0.8
0.6
0.4
ZieglerNichols PSO
0.2
Syste m G11
TABLE II: PID gains comparison Ziegler-Nichols PSO P I D P I D 535.71 0.1048 0.022 5.9619 42.28 58.22
G22
-0.059
-1.801
0.047
-0.0259
-0.02
0
0
1
2
3
4
5
6
7
8
9
10
Time(sec)
4
x 10
Figure 5: Flux Output Response Comparison
-0.005 800 700
TABLE III: Comparison of performance for flux
Conductivity ( s/cm)
600 500 400 300 200 100
Ziegler-Nichols PSO
0
PSO scheme Performance Index
Z-N 0.02884
PSO 0.03037
-100
0
1
2
3
4
5
6
7
8
9
10
Time (sec)
www.ijsrp.org
International Journal of Scientific and Research Publications, Volume 3, Issue 6, June 2013 ISSN 2250-3153
Figure 6: Conductivity Output Response Comparison VII. CONCLUSION In this paper analyses has been done with the Reverse Osmosis system, and the MATLAB-SIMULINK software tool is used for finding the behavior flux and conductivity for reverse osmosis membrane. It is easy to observe from response that as the conductivity is affected with change of pH, however flux is not affected for the pH, such that the conductivity is controlled with the pH and flux is control with the pressure. A computer is done to see the results for the flux and conductivity using ZieglerNichols based and PSO based PID tuning, Comparing the system response using proposed technique are far better improved. Since lots of non-linearity’s and uncertainties in the real plant has not taken in this study, implementation of PSO to real plant is being scheduled. ACKNOWLEDGMENT The authors would like to gratefully acknowledge Central Electronics Engineering Research Institute Pilani(CSIR) for their valuable support and guidance to conduct this research. The authors are also thankful to Head and group members AEG, CEERI for their help and support for the work. The present work is a part of project GAP 3118 at CEERI Pilani.
5
[13] Khawla AbdulMohsen Al-Shayji, “Modeling, simulation, and optimization of large-scale commercial desalination plants”, Faculty of the Virginia Polytechnic Institute and State University, a PhD Thesis
AUTHORS First Author – Natwar S. Rathore, M.Tech. student with the Department of Electrical Engineering, MNNIT Allahabad, Allahabad-211004, (e-mail:
[email protected]) Second Author – Neha Kundariya, M.Tech. student with the Department of Electrical Engineering, NIT Kurukshetra, Kurukshetra-136119, (e-mail:
[email protected]) Third Author- Anirudh Narain, Associate Professor with the Department of Electrical Engineering, MNNIT Allahabad, Allahabad-211004, (e-mail:
[email protected]) Correspondence Author – Natwar S. Rathore, mail:
[email protected], Alternate mail:
[email protected], Contact: 07597340447
ee-
REFERENCES [1]
M.W. Robertson 1, J.C. Watters 1., P.B. Desphande 1, J.Z. Assef 1, and I.M. Alatiqi 2, “Model based control for reverse osmosis desalination processes”, Desalination 104 (1996) 59-68 [2] Nader M. Al-Bastaki*, Abderrahim Abbas, “Modeling an industrial reverse osmosis unit”, Desalination 126 (1999) 33–39 [3] Imad Alatiqi*, Hisham Ettouney, Hisham El-Dessouky, “Process control in water desalination industry: an overview”, Desalination 126 (1999) 15–32 [4] Abderrahim Abbas, “model Predictive control of a reverse osmosis Desalination unit”, Desalination 194(2006) 268–280 [5] Gambier, A., A. Wellenreuther, and E. Badreddin. “Optimal control of a reverse osmosis desalination plant using multi-objective optimization.” Proceedings of the 2006 IEEE Conference on Control Applications, 13681373, Munich, October 4-6, 2006 [6] C. Riverol1 and V. Pilipovik2 ,“ Mathematical Modeling of Perfect Decoupled Control Systemand Its Application: A Reverse Osmosis Desalination Industrial-Scale Unit” , Journal of Automated Methods & Management in Chemistry, (2005), no. 2, 50–54 [7] Jimo Park, Goeun Kim, Jinsung Kim, Sanggun Na and Hoon Heo” Simulation of reverse osmosis plant using RCGA based PID controller” ICROS-SICE International Joint Conference August 18-21, 2009J. [8] Jin-Sung Kim, Jin-Hwan Kim, Ji-Mo Park, Sung-Man Park, Won-Yong Choe, and Hoon Heo “Auto Tuning PID Controller based on Improved Genetic Algorithm for Reverse Osmosis Plant” International Journal of Electrical and Computer Engineering 3:8 2008 [9] Kennedy and R.C.Eberhart, “Particle swarm optimization,” in Proceedings of the IEEE International Conference on Neural Networks, vol. 4, pp. 1942– 1948, Dec 1995. [10] Zwe-Lee Gaing, “A particle swarm optimization approach for optimum design of PID controller in AVR system”, IEEE Transactions on energy conversion, Vol.19, No. 2, June 2004 [11] Y.Shi and R.Eberhart,”A modified particle swarm optimizer”, in Proc. IEEE World Congr. Comput. Intell., 1998, pp. 69-73. [12] S. M. Giriraj Kumar, Deepak Jayaraj, Anoop. R. Kishan, “PSO based tuning of a PID controller for a high performance drilling machine”, International Journal of Computer Applications(0975-8887), Volume 1, No. 19, 2010
www.ijsrp.org