linear filter, and recorded onto DAT with a Sony TCD-D7, whose sampling frequency is 48 kHz. The 16-bit data were then transferred digitally to computer.
Pitch-synchronous
Decomposition
of Mixed-source
Philip J.B. Jackson and Christine
Dept.
of Electronics
Abstract:
and Computer
Science,
Unizlersity
Speech Signals
H. Shadle
of Southampton,
Southampton
SO I 7 lBJ,
LT.IC.
As part of a study on the acoustic mechanisms involved in aspiration, a method was developed
for decomposing an acoustic signal into harmonic (voiced) and enharmonic (invoiced)
components, based
on a hoarseness metric by H. Muta, T. Baer, K. W’agatsuma, T. Muraoka and H. Fukuda, 1988, “.4 pitch-synchronous analysis of hoarseness in running speech, J. Acoust. Sot. Am., 84(4):1292-1301. Their pitch-synchronous harmonic filter (PSHF) was extended (to EPSHF) to yield time series of both components. To decompose
Results of applying the EPSHF to synthetic and recorded speech signals are given. a speech waveform into harmonic
and enharmonic
components,
which, ideally, would con-
tain the vocal-tract-filtered harmonic filter, described structed
and improved
voicing source, and all filtered noise sources, respectively, the pitch-synchronous by Muta et al. (1988) for quantifying hoarseness, was extended to yield recontime series estimates. The ext ratted ‘voiced’ and ‘unvoiced’ estimates enable both
time- and frequency-domain tification
of the location
analysis, e.g. for comparison
of signal envelopes,
and type of source (via trough frequencies RECORDING
An adult male subject
(PJ),
AND
speaker of British
ANALYSIS
synchrony
of enharmonic
of events, or iden-
spectrum).
METHODS
English R. P., recorded
a corpus
consisting
of repeated
/pVFV/ nonsense words (V=/a,i,u/, F=/s,z/) in normal, breathy, stage-whispered and whispered voice in a sound-treated room. The sound pressure at 1 m was measured using B&K Type 4165 microphone and Type 2636 amplifier, using 20-20k Hz band-p~s, linear filter, and recorded onto DAT with a Sony TCD-D7, whose sampling
frequency
is 48 kHz. The 16-bit data were then transferred
digitally
to computer
for analysis.
Ensemble averages were generated by marking equivalent locations in an array of tokens (e.g. rele~e of a stop, or start/end of a fricative), and summing the sound power of the discrete Fourier transform (DFT) of the corresponding windowed portions from each token. Thus consistent features were amplified to others, and also an indication of me~urement variability was obtained.
in relation
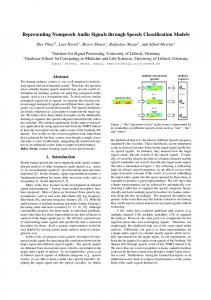
Figure 1: Extended Pitch-Syncbonous Harrnotic Filter (EPSHF) architecture.
The pitch-period, N sample points, wm computed according to Muta et al. (1988), which uses a von Harm-windowed section of speech signal, sk, four pitch periods long, k = {O, 1,- ~~, 4hT – 1}. The PSHF, 11 (see Fig.1), has coefficients hn = S~ for n = {4, 8, . . . 4(N – l)}, otherwise h“, = O, for frequencies at The original estimate of the harmonics of the fundamental f. = ~, where fs is the sampling frequency
8 0
“
Hammic
estimate
o
. 4 AnharmDnic
eStiMatE
o 1, -4
o 7ime
Dh I
I
lm
z,
*
200
(ins]
300
400 I (me (ins)
t
500
a, 600
t 1
J
700
Figure 2: Time series of (a) synthetic signal, sC, with its constituent harmonic and modulated-noise parts, and the respective EPSHF estimates, O and ti, and (b) a recording of [phaza], with the EPSHF decomposition.
263
‘voiced’
spectrum
comprises
a smeared version of these harmonic
coefficients,
~. – 1 = 0.25hn,
V. = 0.5hn, which is a frequency-domain equivalent of the windowing. The extended estimate of the . operator, spectrum was formed by interpolating the estimate Un = Sn — L’n. The interpolation
V~t I = 0.25h~, ‘unvoiced’
L, h~ coefficients, in = (l~n_112 + lun+112)*~1Sn, for ~ = {4,8, . ~~,4(N – l)}. These coefficients were smeared, as before, and added to Un to form tin, whose inverse DFT (IDFT) gives the anharrnonic signal fik, which, when subtracted
from sk, ]eaves the harmonic
component
tik.
RESULTS Synthetic short-comings
signals, s, were processed to evaluate the performance of the EPSHF, and to identify or artefacts. Tests were performed on three signals: s= = g + w, sb = g + (w x g),
Sc = g * jl + (w x g) * f2, where g is periodic,
w is Gaussian,
any and
white noise, fl and f2 represent filter impulse
responses and * denotes convolution. Figure 2a illustrates analysis of s~, where the modulation of the filtered noise is preserved in the reconstructed signal, ti. In this example, the EPSHF improved the (a.c,) signal-to-noise
ratio of the enharmonic
part by 11.6 dB (from -5.9 dB to 5.7 dB).
Figure 2b shows how one token, a normally -phonated [phaza], was decomposed by the EPSHF. One can see in Z a smooth and clean estimate of the quasi-periodic component. The enharmonic estimate, fi, contains most of the noisy speech components: the burst (20 ms), and initial frication and aspiration (30-70 ms), but also some noise during the vowels, which grows in [z] (330-420 ms) and at the cessation ms), However, there are also glitches, a by-product of processing, at voice onset (70-100
of voicing (720 ms) and other
transient stages (200, 270, 450 ms) where there are either rapid changes in ~. or voicing amplitude, or both. Interestingly, at the development of the fricative (310-360 ms), U exhibits modulation by f., which was typical of other tokens of [ph aza]. Examples of other phonation modes (breathy, stage-whispered) for [phasa] were examined, and showed similar but exaggerated features, since the magnitude of the a.nharrnonic components was greater, as was the degree of jitter and shimmer. Figure 3a shows ensemble-averaged spectra of [z] in [phaza] context,
its harmonic
and enharmonic
estimates,
and [s] in [phasa].
As expected,
the anharrnonic
[z] spectrum is similar in shape and amplitude to [s]. Figure 3b shows a waterfall plot of ensemble-averaged spectra, from [ph] release to voice onset at approximately 5 ms intervals. The deep troughs in the burst spectrum
(bottom
anti-resonances
curve)
are indicative
of a source
localised
shift from 2.2 to 2.0 kHz, and formants
at the lips.
Just
before
voice
onset
(top)
rise (e.g. F3, from 2.3 to 2.7 kHz).
CONCLUSION The EPSHF plausibly decomposed breathy vowels, but the harmonic component of voiced fricatives still contained significant noise, whose ensemble-averaged spectrum was similar in shape to (though weaker than) the enharmonic one. The algorithm performed best on sustained sounds. Tracking errors at rapid transitions, and errors due to jitter and shimmer, were spuriously attributed to the enharmonic component. IIowever, this component clearly revealed various features of the noise source, such w modulation in voiced fricatives. Further work will explore the interactions of phonation, breathy speech and turbulence noise, and the use of a reference signal, e.g. from a laryngograph,
i
“.,1,
, Freq.e;w
e,, (kHz)
,,,
I
to enhance the filter performance.
L .,2,
J
,
Freq”e;y
7,,
,0
[H’Z)
Figure 3: Ensemble-averaged spectra of (a) mid-fricative in normaHy-phonated [paFa] context (F=/z,s/,
8 tokens,
85 ms window), with EPSHF harmonic and enharmonic decomposition of [z], and (b) release of [ph] to voice onset (16 tokens, 21 ms window), in [paFa] context, 10 dB between tick-marks and between each frame,
264