Based Social Networks with Personalized Geo-Social ... recent studies began to model the geographical .... used in the latest study[7], in this paper we use.
MOBILE INFORMATION SYSTEMS
Point-of-Interest Recommendation in LocationBased Social Networks with Personalized Geo-Social Influence HUANG Liwei1, MA Yutao2,3,*, LIU Yanbo1 Beijing Institute of Remote Sensing, Beijing 100854, China School of Computer, Wuhan University, Wuhan 430072, China 3 WISET Automation Company Limited, Wuhan Iron and Steel Group Corporation, Wuhan 430080, China 1 2
Abstract: Point-of-interest (POI) recommendation is a popular topic on location-based social networks (LBSNs). Geographical proximity, known as a unique feature of LBSNs, significantly affects user check-in behavior. However, most of prior studies characterize the geographical influence based on a universal or personalized distribution of geographic distance, leading to unsatisfactory recommendation results. In this paper, the personalized geographical influence in a two-dimensional geographical space is modeled using the data field method, and we propose a semi-supervised probabilistic model based on a factor graph model to integrate different factors such as the geographical influence. Moreover, a distributed learning algorithm is used to scale up our method to large-scale data sets. Experimental results based on the data sets from Foursquare and Gowalla show that our method outperforms other competing POI recommendation techniques. Keywords: point-of-interest recommendation; location-based social networks; geo-social influence; data field; factor graph model
I. INTRODUCTION The wide use of mobile devices and loca-
21
tion-based services (LBSs) sparks the boom of location-based social networks (LBSNs), such as Foursquare and Gowalla, which can affect human activities in the physical and virtual worlds[1]. A point-of-interest (POI) is a specific spatial location (such as a hotel) that could be interesting or useful to someone else in a LBSN. A user’s visits to a given POI, also known as check-in activities, by and large reflect his/her preference for the corresponding place in the real world. In recent years, POI recommendation has attracted increasing attention due to the importance of understanding human behavior and the potential business value related to that. Unlike the traditional recommender systems that focus on non-spatial items (such as books and movies), POI recommendation requires users to visit or check in locations in a LBSN. Geographical proximity has a great impact on user check-in behavior[2], that is, nearby friends always share more common POIs than the others who live far away[3]. However, human mobility behavior presents a challenge for the methods that make recommendations based on the distances between users’ places of residence. To address the issue, some researchers have attempted to recommend possible POIs to target users in China Communications • December 2015
terms of the geographic distance between locations. Prior studies assume that the distances between POIs that a user visited before follow a universal or personalized distribution[1, 2, 4-6], and the probability of a user visiting a POI can be calculated according to the geographic distance between them. Unfortunately, these studies are subject to some limitations, e.g., the deficiency of location’s intrinsic characteristics and the difficulty in finding a reasonable reference location[7]. Therefore, some recent studies began to model the geographical influence over two-dimensional geographic coordinates (latitude and longitude)[7], aiming at characterizing user check-in behavior better. On the other hand, according to the social correlation[8] of social theories, human movement and mobility patterns are also affected by their social friendships, and a few recommender systems have utilized the social influence in conventional social networks to improve prediction performance[9]. For example, according to the result of our experiment conducted on the data sets which were collected from Foursquare[10] and Gowalla[5], although less than 10% of a user’s check-ins are also visited by his/her friends, the probability of checking in the same POI for two friends is, on average, much higher than that for two strangers. To sum up, a unified framework integrating different factors seems to be a feasible solution to improve the quality of POI recommendation. How to model the personalized geographical influence in terms of geographic spatial distribution, and further characterize user check-in behavior better by integrating the social influence with the geographical influence, is the challenge we face. To address the issue, in this paper we propose an effective and scalable POI recommendation framework that returns the top K POIs with the highest scores to each target user. The main contributions of this paper are summarized as follows: (1) We model the personalized geographical influence on user check-in behavior in terms of geographic spatial distribution using the data field method[11], because it has the advantage in describing the non-contact interChina Communications • December 2015
action between data objects. In particular, to alleviate the cold-start problem, we learn the effect of each location on individual users by considering both his/her historical check-in records and the geographic spatial distribution of all POIs. (2) We propose a unified and flexible recommendation framework based on a factor graph model[12] to integrate different factors (such as user preference and geo-social influence), which can automatically determine the degree of each factor’s contribution by optimizing the model parameters. Besides, we propose a distributed learning algorithm to improve the scalability of our method when dealing with large-scale data sets. (3) According to the two large-scale real data sets collected from Foursquare and Gowalla, we conduct extensive experiments to evaluate the recommendation accuracy and scalability of our method. The experimental results show that our method achieves better performance than several state-of-the-art POI recommendation approaches. The remainder of this paper is organized as follows. Section II presents an overview of the related work, and Section III formalizes the POI recommendation problem. In section IV, we model the personalized two-dimensional geographical influence using the data field method; in Section V, we introduce a unified geo-social recommendation framework in detail; in Section VI, we discuss the experimental results on the two real-world data sets. Finally, Section VII summarizes this paper.
This paper presents a semi-super vised probabilistic model based on a factor graph model to integrate different factors. To recommend more appropriate POIs to target users, both the personalized geographical influence and the social influence on individual user’s check-in behavior are considered.
II. RELATED WORK Recently, POI recommendation has emerged as a popular topic in the field of recommender systems. According to the data available on the Internet such as user check-in records, GPS trajectory data[13], and text data[14], the simplest way to provide a POI recommendation service is with those conventional recommendation techniques such as collaborative filtering. However, using only the information of user check-in records is not enough to as-
22
sure accurate POI recommendation results, which suggests that more additional information should be considered together. The geographical feature of POIs is actually a unique identifier distinguishing them from other non-spatial items[7]. On the one hand, some prior studies[3] calculated the similarity between users in terms of their geographical influence, and then recommended possible POIs using collaborative filtering techniques. On the other hand, other prior studies investigated the geographical influence of locations. For example, Cheng[15] et al. viewed locations as ordinary non-spatial items and quantified the geographical influence of locations by predefining a range; Kurashima[16] et al. proposed a geo-topic model based on the assumption that if a location is closer to a user’s current location or the locations he/she visited, it is more likely to be visited by the user; Lian[17] et al. proposed a weighted matrix factorization model which augmented user’s and POI’s latent factors in the model with activity area vectors of users and influence area vectors of POIs, respectively. In many prior studies[1, 2, 4, 5], the distances between locations visited by the same user were modeled based on a common distribution for all users, e.g., a power-law distribution or a multi-center Gaussian distribution. Although this benefits the quality of POI recommendation to some extent, a common distribution for all users often ignores the personalized geographical influence. Therefore, Zhang[6] et al. utilized kernel density estimation to estimate the distribution of distances between pairs of locations for each individual user. Furthermore, a latest study[7] attempted to characterize user check-in behavior using two-dimensional kernel density estimation. Inspired by the findings in traditional social networks, several POI recommendation approaches[3, 5, 14] took into consideration the social influence, but the results indicated that the effect of such a factor was not significant, because there was, on average, a small overlap of a user’s check-ins to his/her friends’ check-ins. Besides this one, some researchers
23
have also utilized the information of time and content to provide better recommendation results. For example, Gao[18] et al. studied the temporal cyclic patterns of check-ins in terms of temporal non-uniformness and temporal consecutiveness, and they proposed a timeaware POI recommendation model; Yin[19] et al. proposed a location-content-aware topic model in consideration of both personal interest and local preference.
III. PROBLEM DEFINITION We explore the information of user preference, social influence and personalized geographical influence, and then integrate them into a unified probabilistic model to recommend proper POIs for target users. Next, we formalize the problem of this study. Given a set of venues (POIs) V = {v1, v2,…, vM}, L = {l1, l2,…, lM} is the set of locations of POIs, where M is the number of POIs and each location has longitude and latitude coordinates. Let U = {u1, u2,…, uN} be the set of users and G be the matrix of the relationships between users, where N is the number of users. C = (cij)N×M is a check-in frequency matrix with each element (also defined as check-in variable) representing the frequency of checking in POI vj (with lj) by user ui. Assuming that CL is an observed check-in action matrix, the set of observations can be denoted as O = (U; V; G; CL). According to all the observations, our task is to predict the probability that a given user visits a new POI, and to recommend the top-k POIs to the user.
IV. MODELING PERSONALIZED GEOGRAPHICAL INFLUENCE According to the Tobler’s first law of geography[20], the locations near the place where a user usually visits, are more likely to be recommended to the user. Users differ in the geographic spatial distribution of already-visited locations. The frequency distribution of a user’s historical check-ins reflects his/her preference for different locations, and the prefChina Communications • December 2015
erences of various users for the same POI are also different. Therefore, modeling the geographical influence of locations on user checkin behavior is the key to solving the problem in this paper. Unlike the statistical method used in the latest study[7], in this paper we use the data field method[11] to model the mutual interaction between locations by constructing virtual fields in a two-dimensional geographical space. Inspired by physical fields such as electromagnetic fields, the concept of data field is used to depict the interaction between objects associated with the data points in a specific space[11]. In a data space Ω ⊆ RP, let D = {x1, x2,…, xn} denote a data set of P-dimensional independent data points, where xi = {xi1, xi2,…, xip}T with i = 1, 2,…, n. If a data point is viewed as a particle, it generates a virtual field around itself and certain forces acting upon other data points within the field, and the strength of such forces is often inversely proportional to the distance from it. The whole data space constitutes a data field. The potential function of data fields mathematically models how the strength of data on a given task is diffused from individual samples to the population through the interaction between data objects. Thus, the potential value of a data point x = {x1, x2,…, xP}T in the universe of discourse is defined as[11] �(1)
where mi is the mass of data point xi, ||x - xi|| is the distance between xi and x, and σ∈(0, +∞) is an impact factor that determines the area of each data point’s influence. Note that K(x) is the unit potential function satisfying and
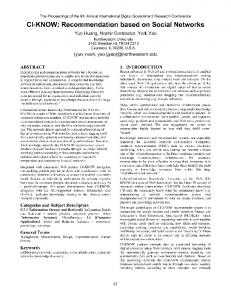
According to the definition, σ has a great impact on the spatial distribution of virtual fields. Hence, it should be optimized to make the potential value of each data point diverse by minimizing the uncertainty of the original data distribution. Entropy has been widely used as an indicator for the disorder or randomness in a closed thermodynamic system. Then, the concept of potential entropy H is introduced to measure the uncertainty of potential values, and the optimal value of σ can be obtained by minimizing the potential entropy, which is defined as follows: �(3) where n is the number of data points and . This study assumes that the location of a POI represents a two-dimensional data point and that the number of user check-ins for the location is the mass of the data point. A data field in the two-dimensional geographic spatial space is then constructed. We illustrate the modeling process with a simple example. Figure 1 shows the distributions of two users’ check-in locations, and Figure 2 further shows the corresponding distributions of personal check-in locations in Figure 1 in terms of data field. In each data field, we can calculate the potential value of a given point, which is regarded as the geographical influence of a location on an individual user. The higher the potential value, the more likely a user is to prefer the corresponding location.
.
Because Gaussian function matches the physical nature of data fields, Gaussian potential can be chosen to characterize the scalar potential of data fields. Therefore, φ(x) can be written as
�(2) Fig.1 Distributions of personal check-in locations
China Communications • December 2015
24
V. A UNIFIED POI RECOMMENDATION FRAMEWORK 5.1 Model specification The main goal of this paper is to build a model based on a factor graph model[12] to predict the probability that a given user visits a new POI. Here, we present a simple example. As shown in Figure 3, the observed variables, including users (u1 ~ u5) and their friendships (denoted by dashed lines in Figure 3), POIs (v1 ~ v5), and locations associated with the POIs (l1 ~ l5), are the input of our model; the latent variable, namely the check-in variable (whose definition please refer to Section III), is solved by our model. Because only a fraction of the check-in variable’s values are exactly known (denoted by solid lines in Figure 3), our task is to predict the missing entries (viz. unlabelled
data) in each check-in variable vector. This is a typical semi-supervised learning process. In our model, we use the state factor f and the correlation factor g to model the geographical influence and the social influence, respectively, and the two types of factors are described as follows: -- State factor: Given the check-in records of user u i, f(u i, C i) represents the posterior probability that user u i visits a given POI, which reflects the geographical influence of POIs on decision-making behavior of users. -- Correlation factor: g(Ci, G(Ci)) denotes the correlation between the check-in variables of different users, where G(Ci) is the set of the vectors of other users related to Ci. It reflects the influence of friends’ check-in behavior on user’s decisions. Given observation data O and location information L, the joint distribution over C is defined as (4)
28.6
39 Visited Location Potential Value
38.8
Visited Location Potential Value
28.5
38.6
28.4
Latitude
Latitude
38.4
28.3
38.2 38
28.2
37.8
28.1
37.6
28
37.4 37.2 -122.6 -122.4 -122.2
-122
-121.8 -121.6 -121.4 -121.2
Longitude
-121
27.9 -81.45
-81.4
-81.35
-81.3
-81.25
Longitude
-81.2
-81.15
-81.1
Fig.2 The corresponding distributions of personal check-in locations in terms of data field
u5
u2 u4
u1
C1
u3 c22
c11
g (C1 , C2 )
c12
c33
c43
c44
g ( C 2 , C3 )
C3
C C4 g (C ,5C 4
5)
g ( C3 , C 4 )
f (u1 , C1 )
u2 u1
Fig.3 Graphical representation of a simple example
25
g (C 2 , C 4 )
(5) where α is a weighting vector and Ф is defined as a vector of feature functions for the state factor. Similarly, the correlation factor can be defined as
f ( u 3 , C3 ) f ( u 5 , C5 ) f (u 2 , C2 ) f (u 4 , C4 )
c55
v1 (l1 ) v2 (l2 ) v3 (l3 ) v4 (l4 ) v5 (l5 )
C2
In this study, due to uneven probability distribution of users’ check-ins, we use an exponential-linear function to instantiate the two types of factors, and the check-in variable cij predicted by our model is assumed to be continuous in order to generate more accurate sorting. In particular, we define the state factor as
u3
u4
u5
(6) where β is a weighting vector and Ω is defined as a vector of feature functions for the correlation factor. The normalization factors Zα and Zβ, also
China Communications • December 2015
known as the partition function, are defined as
�(7)
�(8)
malization factor which is defined as �(13)
Next, the log-likelihood objective function ℓ(θ) can be defined as
5.2 Factor definition The feature functions for the state factor and the correlation factor are introduced in brief. -- Personalized geographical influence: Based on the spatial location distribution of all POIs visited by users, the potential value of each location is calculated by the data field method (see Eq. (2)), and it represents the state feature of a given location (yij). The corresponding feature function is defined in quadratic form as �(9) -- Social influence: In this model, the social influence on POI recommendation is modeled in terms of the friendship between users, and its feature function is defined as
�(14)
where C−C L represents the entries in the check-in action matrix C except the check-in variable’s values in the matrix CL. To obtain the optimal value of θ, we maximize the log-likelihood objective function ℓ(θ), i.e., � (15) We then take the gradient of each θ with regard to the objective function:
�(10)
where Sik is the correlation value between two users ui and uk. In this paper, Sik is defined as
�(11)
where Γ(u) is the set of friends of u and eik = 1 represents a direct friendship between ui and uk.
5.3 Model learning The task of model learning is to estimate a parameter configuration θ = [α, β] to maximize the log-likelihood of observation data. For simplicity, all feature functions for the checkin variable are concatenated and denoted as w(c ij) = (Φ(u i, c ij) T,
) T. Then,
Eq. (4) can be written as �(12)
�(16) Here, we calculate approximately the gradients of θ using nonparametric belief propagation (NBP)[21], which is an inference algorithm for graphical models that include continuous, non-Gaussian random variables. Note that the NBP process is performed twice Algorithm 1 Parameter estimation Input: U, V, L, G, CL, and η = 0.01 Output: θ = [α, β] Initialize θ repeat Calculate EPθ ( C |C L ,G , L ) (W (cij )) using NBP Calculate EPθ ( C |G , L ) (W (cij )) using NBP Calculate the gradient of θ according to Eq. (16) Update parameter θ with the learning rate η: until convergence Return θnew
where
θnew = θold + η ⋅
∂ ∂θ
and Z is a norFig.4 An algorithm to estimate the model parameters
China Communications • December 2015
26
in each iteration in Algorithm 1 (see Figure 4): one is to estimate the marginal probability P(C |G, L), and the other is to estimate P(C |CL, G, L). Finally, using the newly learned gradient, we update each parameter configuration with a given learning rate η.
5.4 Inferring unknown check-ins With the learned parameter configuration , we can predict all unknown check-in variable’s values by finding a check-in variable configuration that maximizes the joint probability: �(17) Here, we calculate the marginal distribution function of the check-in variable using NBP and obtain the values of the variable by maximizing the marginal distribution function.
VI. EXPERIMENT ANALYSIS 6.1 Data collection Two large-scale data sets collected from Foursquare[10] and Gowalla[5] were used in our experiment, and their key statistics are presented in Table 1.
5.5 Distributed learning algorithm
6.2 Evaluation metrics
Our learning algorithm is indeed extensible and scalable to address the needs that real LBSNs may contain millions of users and POIs. To achieve scalability on large-scale data sets, a distributed learning algorithm is proposed based on the message passing interface (MPI) to speed up the calculation of each parameter’s gradient via NBP. This algorithm adopts a master/slave architecture. One master node is used to update the parameters, and other slave nodes are used to calculate their gradients. In the initial stage we partition the set of POIs into P subsets roughly equal, where P denotes the number of slave nodes. In each iteration in Algorithm 1, the
As with previous work[1, 4], this paper utilizes two widely used metrics, i.e., Recall@k and Precision@k, to measure the quality of recommendation results. They are formally defined as
Table I Data statistics Data source
Foursquare
Gowalla
Duration
2010-08-21 ~ 2011-11-18
2009-02-04 ~ 2010-10-23
No. of check-in records
2,073,740
6,442,890
No. of users
18,107
196,591
No. of unique locations
36,907
1,280,956
No. of friendship links
115,574
950,327
Average check-ins per user
101
37.18
Average friends per user
10.58
4.83
Average check-ins per location
56.19
3.11
27
master node sends the updated parameter configuration to all slave nodes first. The slave nodes compute the marginal probability of the corresponding subset using NBP, and then send the gradients of the parameters obtained to the master node. Eventually, the master node sums all the gradients gathered from different subsets, and then updates the parameters using the gradient descent algorithm.
�(18)
�(19)
where Su(k) is the set of the top-k POIs recommended to user u and Vu is the set of locations that have been actually visited by the user in the testing set.
6.3 Evaluated recommendation techniques To validate the effectiveness of our method, we compared it with five typical approaches. -- Non-negative Matrix Factorization (NMF) [22]: it is widely used for collaborative filtering recently, and in our experiment it only utilizes the check-in action matrix. -- Multi-center Gaussian Model (MGM)[2]: in such a model, the distances between visited locations and centers (i.e., the most popular locations) are modeled as a universal multi-center Gaussian distribution for all users, and in
China Communications • December 2015
and 8.57%, respectively. Similarly, the Recall values of our method are, on average, in-
0.5
0.4
China Communications • December 2015
0.3
0.4 0.35 0.3
Recall
Precision
0.35
0.25 0.2
NMF MGM SR iGSLR CoRe FGLR
0.25 0.2
0.15
0.15
0.1
0.1
0.05 0 5
10
15
20
25
30
35
40
45
No. of recommended POIs for a user: k
0.05 5
50
(a) Foursquare (Precision)
10
15
20
25
30
35
40
45
50
No. of recommended POIs for a user: k
(b) Foursquare (Recall)
0.2
0.16 NMF MGM SR iGSLR CoRe FGLR
0.18 0.16
0.12 0.1
Recall
0.14
NMF MGM SR iGSLR CoRe FGLR
0.14
0.12
0.08
0.1
0.06
0.08
0.04
0.06
0.02
0.04 5
6.4 Comparison of performance
10
15
20
25
30
35
40
45
No. of recommended POIs for a user: k
0 5
50
(c) Gowalla (Precision)
10
15
20
25
30
35
40
45
50
No. of recommended POIs for a user: k
(d) Gowalla (Recall)
Fig.5 Values of the evaluation metrics for various methods
0.5
0.45
State Factor Correlation Factor FGLR
0.45 0.4
0.4 0.35 0.3
Recall
Precision
0.35 0.3
0.25
0.25
0.2
0.2
0.15
0.15
0.1
0.1 5
10
15
20
25
30
35
40
45
No. of recommended POIs for a user: k
50
0.05 5
(a) Foursquare (Precision)
10
15
20
25
30
35
40
45
No. of recommended POIs for a user: k
50
0.16
State Factor Correlation Factor FGLR
0.16
0.14 0.12 0.1
Recall
0.14 0.12
0.08
0.1
0.06
0.08
0.04
0.06
0.02
0.04 5
State Factor Correlation Factor FGLR
(b) Foursquare (Recall)
0.2 0.18
Precision
In our experiment, each data set in question was divided into a training set and a testing set according to check-in time, that is, 70% of the previous check-in records were used as the training set and the rest were used as the testing set. The parameters of each method under discussion were set to their own optima for the two data sets. The experiment was repeated five times independently to reduce random errors generated during the experiment, and we used the average of evaluation metric values as the final result to increase reliability of the measurement. As shown in Figure 5, for the two data sets, our method (FGLR) outperforms other competing methods in terms of the evaluation metrics. On one hand, because our model considers more types of information for POI recommendation, it works better than NMF, MGM and SR. On the other hand, because our method can automatically determine the degree of each factor’s contribution by optimizing the model parameters, it works better than iGSLR and CoRe. Compared with CoRe, the Precision values of our method for the two data sets are, on average, increased by 10.37%
0.45 NMF MGM SR iGSLR CoRe FGLR
0.45
Precision
our experiment it utilizes geographical information and the check-in action matrix. -- Social Regularization (SR)[9]: it is a stateof-the-art social recommendation algorithm, and in our experiment it utilizes the check-in action matrix and social relationships. -- Personalized Geo-Social Location Recommendation ( iGSLR)[6]: iGSLR uses a kernel density estimation approach to model the personalized geographical influence on user check-in behavior, and in our experiment it utilizes social relationships, geographical information and the check-in action matrix by applying a product rule. -- Two-dimensional Geographic Coordinates for Location Recommendations (CoRe)[7]: CoRe models geographical check-in probability density over latitude and longitude coordinates, and in our experiment it utilizes the same information that iGSLR used.
10
15
20
25
30
35
40
45
No. of recommended POIs for a user: k
(c) Gowalla (Precision)
50
0 5
State Factor Correlation Factor FGLR 10
15
20
25
30
35
40
45
No. of recommended POIs for a user: k
50
(d) Gowalla (Recall)
Fig.6 Precision and Recall values of the model with different factors
28
further improve performance, with the rising cost of complexity.
20,000
6.6 Scalability
18,000
Running time (s)
16,000 14,000 12,000 10,000 8,000 6,000 4,000 2,000 0
1
2
3
4
8
12
Number of cores
20
Fig.7 Running time for one iteration vs. the number of cores
0.45
0.45 0.4
0.4
0.35
0.35
Recall
Precision
0.3
0.2
0.15
0.05 2
3
4
5
6
7
Number of iterations
8
9
0.2
0.15
k=10 k=20 k=30 k=40 k=50
0.1
0 1
0.3
0.25
0.25
k=10 k=20 k=30 k=40 k=50
0.1 0.05 10
0 1
2
3
4
5
6
7
Number of iterations
8
9
10
Fig.8 Convergence of the distributed learning algorithm
creased by 6.19% and 8.87%, respectively.
6.5 Factor effect analysis We evaluated the effects of different factors defined in our model on the evaluation metrics, and the results are shown in Figure 6. Although the two types of factors are useful for POI recommendation, the results are not good enough when using a single type of factors alone. Interestingly, the state factor has a greater impact on Precision and Recall, especially for Foursquare, which suggests that user check-in behavior is more likely to be affected by the geographical influence. Note that more factors such as user similarity and POI similarity can be defined and used in our model to
29
To evaluate the scalability of our distributed learning algorithm, we implemented it in C++ using MPI and conducted the experiment on a server running Windows Server 2012, with Intel Core i7 CPU (3.6 GHz) and 32 GB memory. Given space limitations, only the case of Foursquare is presented in this paper. Figure 7 depicts the running time for one iteration in the distributed learning algorithm with respect to various numbers of slave nodes (viz. cores). With an increase of the number of cores, the efficiency of the algorithm is improved remarkably. Besides, we also analyzed the convergence process of the algorithm, as shown in Figure 8. It shows that the algorithm converges quickly after about five iterations with respect to Precision and Recall values, though the value of top-k (see Eqs. (18) and (19)) ranges from 10 to 50. Thus, we set the maximum number of iterations to 10 and the threshold for the change of θ to 0.001, so as to reduce the running time of our distributed learning algorithm.
VII. CONCLUSIONS To recommend more appropriate POIs to target users, in this paper we consider both the personalized geographical influence and the social influence on individual user check-in behavior. In particular, the personalized geographical influence in a two- dimensional geographical space is modeled using the data field method. A unified semi-supervised probabilistic model, which is based on a factor graph model, is then proposed to integrate the above factors. Furthermore, a distributed learning algorithm is proposed to scale up our method to handle large-scale data sets. Experimental results based on Foursquare and Gowalla show that our method outperforms other competing approaches with regard to the evaluation metrics. Finally, our future work will extend our model by integrating more useful factors such China Communications • December 2015
as user-generated tags[23] and check-in time to improve its prediction performance.
ACKNOWLEDGEMENTS We greatly appreciate the constructive comments and useful suggestions from the guest editors and anonymous reviewers, which help us improve the quality and readability of our paper. This work was supported by National Key Basic Research Program of China (973 Program) under Grant No. 2014CB340404; National Natural Science Foundation of China under Grant Nos. 61272111 and 61273216; Youth Chenguang Project of Science and Technology of Wuhan City under Grant No. 2014070404010232.
References [1] �YE M, YIN P, LEE W C, et al. Exploiting geographical influence for collaborative point-of-interest recommendation[C]// Proceedings of the 34th International ACM SIGIR Conference on Research and Development in Information Retrieval. New York, NY: ACM Press, 2011: 325334. [2] �CHENG C, YANG H, KING I, et al. Fused matrix factorization with geographical and social influence in location-based social networks[C]// Proceedings of the 26th AAAI Conference on Artificial Intelligence. Palo Alto, CA: AAAI Press, 2012: 17-23. [3] �GAO H, TANG J, LIU H. gSCorr : modeling geo-social correlations for new check-ins on location-based social networks[C]// Proceedings of the 21st ACM International Conference on Information and Knowledge Management. New York, NY: ACM Press, 2012: 1582-1586. [4] �LIU B, FU Y, YAO Z, et al. Learning geographical preferences for point-of-interest recommendation[C]// Proceedings of the 19th ACM SIGKDD International Conference on Knowledge Discovery and Data Mining. New York, NY: ACM Press, 2013: 1043-1051. [5] �CHO E, MYERS S, LESKOVEC J. Friendship and mobility: user movement in location-based social networks[C]// Proceedings of the 17th ACM SIGKDD International Conference on Knowledge Discovery and Data Mining. New York, NY: ACM Press, 2011: 1082-1090. [6] �ZHANG J, CHOW C. iGSLR: personalized geo-social location recommendation: a kernel density estimation approach[C]// Proceedings of the 21st ACM SIGSPATIAL International Conference on Advances in Geographic Information
China Communications • December 2015
Systems. New York, NY: ACM Press, 2013: 334343. [7] �ZHANG J, CHOW C. CoRe: Exploiting the personalized influence of two-dimensional geographic coordinates for location recommendations[J]. Information Sciences, 2015, 293: 163181. [8] �ANAGNOSTOPOULOS A, KUMAR R, MAHDIAN M. Influence and correlation in social networks[C]// Proceedings of the 14th ACM SIGKDD International Conference on Knowledge Discovery and Data Mining. New York, NY: ACM Press, 2008: 7-15. [9] �MA H, ZHOU D, LIU C, et al. Recommender systems with social regularization[C]// Proceedings of the 4 th ACM International Conference on Web Search and Data Mining. New York, NY: ACM Press, 2011: 287-296. [10] �GAO H, TANG J, LIU H. Exploring Social-Historical Ties on Location-Based Social Networks[C]// Proceedings of the 6th International AAAI Conference on Weblogs and Social Media. Palo Alto, CA: AAAI Press, 2012: 114-121. [11] �LI D, DU Y. Artificial intelligence with uncertainty[M]. Boca Raton, FL: CRC Press, 2007. [12] �KSCHISCHANG F, FREY B, LOELIGER H. Factor graphs and the sum-product algorithm[J]. IEEE Transactions on Information Theory, 2001, 47(2): 498-519. [13] �ZHENG V, ZHENG Y, XIE X, et al. Towards mobile intelligence: Learning from GPS history data for collaborative recommendation[J]. Artificial Intelligence, 2012, 184: 17-37. [14] �HU B, ESTER M. Spatial topic modeling in online social media for location recommendation[C]// Proceedings of the 7th ACM Conference on Recommender Systems. New York, NY: ACM Press, 2013: 25-32. [15] �CHENG C, YANG H, LYU M R, et al. Where you like to go next: Successive point-of-interest recommendation[C]// Proceedings of the 23rd International Joint Conference on Artificial Intelligence. Palo Alto, CA: AAAI Press, 2013: 2605-2611. [16] �KURASHIMA T, IWATA T, HOSHIDE T, et al. Geo topic model: joint modeling of user’s activity area and interests for location recommendation[C]// Proceedings of the 6th ACM International Conference on Web Search and Data Mining. New York, NY: ACM Press, 2013: 375384. [17] �LIAN D, ZHAO C, XIE X, et al. GeoMF: joint geographical modeling and matrix factorization for point-of-interest recommendation[C]// Proceedings of the 20th ACM SIGKDD International Conference on Knowledge Discovery and Data Mining. New York, NY: ACM Press, 2014: 831840. [18] �GAO H, TANG J, HU X, et al. Exploring temporal effects for location recommendation on loca-
30
tion-based social networks[C]// Proceedings of the 7th ACM conference on Recommender Systems. New York, NY: ACM Press, 2013: 93-100. [19] �YIN H, SUN Y, CUI B, et al. Lcars: A location-content-aware recommender system[C]// Proceedings of the 19th ACM SIGKDD International Conference on Knowledge Discovery and Data Mining. New York, NY: ACM Press, 2013: 221229. [20] �TOBLER W. A computer movie simulating urban growth in the Detroit region[J]. Economic geography, 1970, 46: 234-240. [21] �SUDDERTH E, IHLER A, ISARD M, et al. Nonparametric belief propagation[J]. Communications of the ACM, 2010, 53(10): 95-103. [22] �LEE D, SEUNG H. Learning the parts of objects by non-negative matrix factorization[J]. Nature, 1999, 401(6755): 788-791. [23] �MA T, ZHOU J, TANG M, et al. Social Network and Tag Sources Based Augmenting Collaborative Recommender System[J]. IEICE Transactions on Information and Systems, 2015, 98-D(4): 902-910.
Institute of Remote Sensing. Dr. Huang’s research focus is on data mining and machine learning. He is now a member of the China Computer Federation (CCF).
Biographies
LIU Yanbo, received her M.S. degree in Automation from the National University of Defense Technology. She is currently an engineer in the Beijing Institute of Remote Sensing. Her research focus is on information automation.
HUANG Liwei, received his Ph.D. degree in Computer Science from the PLA University of Science and Technology. He is currently an engineer in the Beijing
31
MA Yutao, received his Ph.D. degree in Computer Science from Wuhan University. He is currently an Associate Professor in the School of Computer, Wuhan University. Dr. Ma was with the China Institute of Electronic System Engineering as a post-doctoral fellow, and he has been a visiting scholar in the Department of Electronic and Computer Engineering, Lehigh University. His research focus is on the development of large-scale software service systems and complex networks. He is now a senior member of CCF and a member of ACM and IEEE. He has also been the Vice Chair of the Services Society Young Scientists Forum (China) and is a member of the CCF Technical Committee on Services Computing, the CCF Youth Working Committee, and the CCF Young Computer Scientists & Engineers Forum (Wuhan Branch). *The corresponding author. Email: ytma@ whu.edu.cn
China Communications • December 2015