Polarimetric Segmentation using Wishart Test Statistic Henning Skriver1, Jesper Schou1, Allan Aasbjerg Nielsen2, and Knut Conradsen2 1
Section for Electromagnetic Systems, Ørsted•DTU Department Technical University of Denmark, Building 348, DK-2800 Lyngby, Denmark Phone: +45 45 88 14 44, Fax: +45 45 93 16 34, E-mail:
[email protected] 2
Informatics, and Mathematical Modelling Department Technical University of Denmark, Building 321, DK-2800 Lyngby, Denmark
Abstract - A newly developed test statistic for equality of two complex covariance matrices following the complex Wishart distribution and an associated asymptotic probability for the test statistic has been used in a segmentation algorithm. The segmentation algorithm is based on the MUM (Merge Using Moments) approach, which is a merging algorithm for single channel SAR images. The polarimetric version described in this paper uses the above-mentioned test statistic for merging. The segmentation algorithm has been applied to polarimetric SAR data from the Danish dual-frequency, airborne polarimetric SAR, EMISAR. The results show clearly an improved segmentation performance for the full polarimetric algorithm compared to single channel approaches.
I. INTRODUCTION Segmentation is an important low-level image processing operation, where an image is partitioned into distinct regions (segments). These segments may provide structural information about the size and shape of the regions, and thematic information about the spatial average of parameters such as the covariance matrix for polarimetric SAR images as well as textural information. All this information can be used by higher-level algorithms, such as classification algorithms. Segmentation is a low-level operation, and therefore it is very important that the segmentation algorithm is adapted to the image statistics. A large number of segmentation algorithms for SAR images has been suggested in the literature. Most of these apply single-channel SAR images but multi-channel algorithms have also been described. One approach for segmentation is based on edge detection and region growing as described in [1][2] with a multichannel extension of [2] provided in [3]. Another approach is to perform segment merging in an initially over-segmented image. This approach has for instance been used for single channel SAR images in the MUM (Merging Using Moments) segmentation algorithm described in [4] and extended to multichannel SAR images in [3]. In the MUM algorithm neighboring segments are merged based on their statistical properties using an appropriate test statistic.
In this paper, an extension of the MUM segmentation algorithm to polarimetric SAR data is presented. For a homogeneous surface, polarimetric SAR data are completely described by the complex covariance matrix [5]. In order to use the full polarimetric information in the segmentation algorithm, we use a newly developed test for equality of complex covariance matrices following a complex Wishart distribution. This test statistic has previously been used for change detection in polarimetric SAR images [6][7], and for edge detection in polarimetric SAR images [8][9]. A more thorough description of the segmentation algorithm is provided in [10]. II. TEST STATISTIC This section briefly describes the complex Wishart distribution, and the likelihood ratio test for equality of two complex Wishart matrices. For a more thorough description, see [6]. A. Complex Wishart distribution A fully polarimetric SAR measures the 2 x 2 complex scattering matrix at each resolution cell. If Sij denotes the complex scattering amplitude for receive and transmit polarization i and j (ij ∈ {h,v}), then reciprocity, which normally applies to natural targets, gives Shv = Svh (in the backscattering direction using the backscattering alignment convention) [5]. Assuming reciprocity the scattering matrix is represented by the 3-component complex target vector s = [Shh Shv Svv]t, where t denotes transpose. s follows a zero mean multivariate Gaussian distribution [11]. The sample covariance matrix C is formed from the target vector by
1
C = 4π ss
*t
σ hh =
σ hhσ hv ρ σ hhσ vv ρ
σ hhσ hv ρ hh,hv * hh,hv * hh,vv
σ hhσ vv ρ hh,vv
σ hv
σ hvσ vv ρ hv,vv
σ hvσ vv ρ *hv,vv
σ vv
(1)
The work has been supported by the Technical University of Denmark. The data acquisition and SAR processing have been supported by the Danish National Research Foundation.
0-7803-7536-X/$17.00 (C) 2002 IEEE
1011
where * denotes the complex conjugate, ρi,j is the complex correlation coefficient between channels i and j, and σ is the backscatter coefficient. If the p x p sample covariance matrix has L number of looks, we define the Hermitian matrix Z = L C. Z follows a complex Wishart distribution WC(p,L,Σ Σ) having mean covariance matrix Σ [11], i.e. p(Z | Σ) =
Z 1
π2
p( p−1)
L− p
p j=1
e
−1
− tr (Σ Z)
Γ(L− J +1) Σ
(2)
L
where | | and tr() denote the determinant and the trace, respectively, and Γ() is the Gamma function. B Test for equality of complex covariance matrix In [6] a test statistic in the complex Wishart distribution have been presented, where the likelihood ratio test is used for testing the equality of two complex Wishart distributed matrices. If Zx and Zy follow the complex Wishart Σx) and WC(p,Ly,Σ Σy), respectively, then distributions WC(p,Lx,Σ the null hypothesis H0: Σx = Σy against the alternative hypothesis H1: Σx ≠ Σy states, that the two matrices Zx and Zy are equal [6]. The Wishart likelihood test statistic becomes
Q=
(L x + Ly )
p (L x + L y ) pL
LpLx x L y y
Zx
Lx
Zy
Zx + Z y
Lx + L y
{
} ω [P{χ (f + 4) ≤ z}− P{χ
2
2
}]
(f ) ≤ z
(4)
with the parameters f, ρ and ω2 defined as
ρ = 1− f 1 ω 2 = − 1− 4 ρ
2
2p 2 − 1 1 1 1 + + 6 p L x Ly L x + Ly
2
+
The MUM (Merge Using Moments) segmentation algorithm for single-channel SAR images was proposed in [4]. As a first step the MUM algorithm severely over-segment the SAR image by dividing it into quadratic segments having size n by n pixels, where the value of n depends on, e.g., the desired resolution in the resulting segmentation map and on the computational load. These initial, small segments are then merged based in their statistical properties. The MUM algorithm tries to determine appropriate regions in the image through an iterative region growing process of merging and sorting the segments. The sorting is performed because the order of the merging of the segments affects the final result. It should be noted that the merging performed in [4] is based on the Student’s t-test, which is only appropriate for Gaussian distributed data, hence an improved segmentation result may be obtained by applying the proper test statistic for Gamma distributed intensities for single-channel SAR images as shown in [13]. In this paper, the test statistic outlined in Section II is used for segment merging. IV. RESULTS
(3)
P{−2ρ log Q ≤ z}≅ P χ 2 (f ) ≤ z +
f =p
III. SEGMENTATION ALGORITHM
Ly
and the asymptotic distribution of –2ρlogQ is given as
2
covariance matrix no longer follows the complex Wishart distribution [6]. In [6] the test statistic and the asymptotic distribution are derived for the azimuthal symmetric case, as well as for the diagonal case, where all off-diagonal elements are set equal to zero.
(5)
1 f (f − 1) 1 1 1 + 2 + 2 2 2 24 Lx L y (Lx + L y ) ρ
The term -2ρlogQ belongs to the interval [0,∞[, with 2ρlogQ=0 for Zx = Zy and Lx = Ly. The elements in the covariance matrix containing co- and cross-polarized components often contain little information, and for randomly distributed targets with azimuthal symmetry, these elements are zero for the mean covariance matrix [12], i.e. for Σ. It is important to notice, however, that if the sample covariance matrix is forced into azimuthal symmetry, i.e. if the elements containing co- and cross-polarized components in the sample covariance matrix are set to zero, then the sample
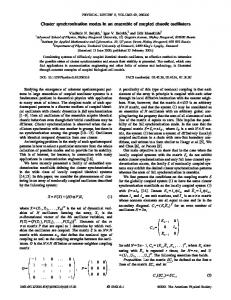
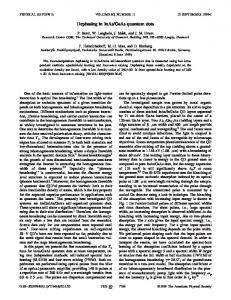
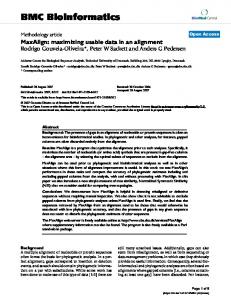
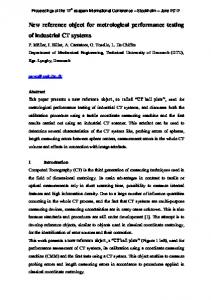
The polarimetric segmentation algorithm has been tested on fully polarimetric SAR data from the Danish, airborne polarimetric SAR, EMISAR. The EMISAR has been developed at the Section for Electromagnetic Systems (EMI), Ørsted•DTU Department, of the Technical University of Denmark, and it is an L- and C-band fully polarimetric and interferometric SAR [14]. The processed data from this system are fully calibrated by using an internal calibration system. The image applied in this work is an L-band 13-look covariance matrix image at 5 x 5 m ground pixel spacing, having a spatial resolution of approximately 8 x 8 m. Fig. 1 shows an image of a Danish agricultural test area containing a number of agricultural fields, farms, hedges and forest areas. In Figs. 2 and 3 are shown the results of applying the segmentation algorithm to the image in Fig. 1, with initial segments of size 2 by 2 pixels. Only the diagonal elements are used in Fig. 2, i.e. only the backscatter coefficients. The result in Fig. 3 is for the azimuthally symmetric case, where also the hh,vv off-diagonal elements are included. The advantage of including the polarimetric information in the segmentation algorithm is clearly seen when comparing the results in Figs. 2 and 3. Especially, the difference is seen for the segments covering the fields A and B, and C and D, respectively, as indicated in Fig. 1. For both cases, the two neighboring fields (i.e. A and B, and C and D, respectively) are merged when only the backscatter coefficients are used (cf. Fig. 2), whereas they are not merged when the polarimetric information is included (cf. Fig. 3). Fields A and B are winter wheat and spring barley, respectively. The
1012
winter wheat field has a relatively high phase difference between HH and VV, probably because of double bounce scattering between the soil surface and the vegetation. The spring barley field has a low phase difference. Fields C and D are oats and peas fields, respectively. The oats field has a high and the peas field has a low phase difference. V. CONCLUSIONS The MUM (Merge Using Moments) segmentation algorithm has been extended to cope with polarimetric SAR image using a newly developed test statistic for the complex Wishart distribution. Using polarimetric SAR data from the Danish polarimetric SAR, EMISAR, the advantage of including the polarimetric information in the segmentation algorithm is clearly shown. REFERENCES [1] Skriver, H, 1989, “Extraction of sea ice parameters form synthetic aperture radar images”, Ph.d. thesis, Technical University of Denmark, LD 74. [2] White, R.G., 1991, “Change detection in SAR imagery”, Int. J. Remote Sensing, vol. 12, pp. 339-360. [3] Caves, R. G., I. McConnell, R. Cook, and S. Quegan, 1996, “Multi-channel SAR segmentation: Algorithms and Applications”, IEE Colloquium on Image Processing for Remote Sensing, no. 5, pp. 2/1-2/6. [4] Cook, R., I. McConnell, and C. Oliver, 1994, “MUM (Merging Using Moments) Segmentation for SAR images”, SPIE, vol. 2316, pp. 92-103. [5] van Zyl, J. J., and F. T. Ulaby, 1990, “Scattering matrix representation for simple targets”, in F. T. Ulaby and C. Elachi, Radar Polarimetry for Geoscience Applications, Artech House. [6] Conradsen, K., A. A. Nielsen, J. Schou, and H. Skriver, “A test statistic in the complex Wishart distribution and its application to change detection in polarimetric SAR data”, unpublished, 2001. [7] Conradsen, K., A. A. Nielsen, J. Schou, and H. Skriver, “Change detection in polarimetric SAR data and the complex Wishart distribution”, IGARSS 2001. [8] Schou, J., H. Skriver, A. A. Nielsen, and K. Conradsen, “CFAR edge detector for polarimetric SAR images”, unpublished, 2001. [9] Skriver, H., J. Schou, A. A. Nielsen, and K. Conradsen, “Polarimetric edge detector based on the complex Wishart distribution”, IGARSS 2001. [10] Schou, J., 2001, “Feature extraction for topographic mapping”, Ph.d. thesis, Technical University of Denmark, LD 146. [11] Goodman, N. R., 1963, “Statistical analysis based on a certain multivariate complex Gaussian distribution (An introduction)”, Ann. Math. Stat., vol. 34, pp. 152-177. [12] Borgeaud, M. R., T. Shin, and J. A. Kong, 1987, “Theoretical models for polarimetric radar clutter”, J. Electromagn. Waves Appl., vol. 1, pp. 73-89. [13] Oliver, C. and S. Quegan, 1998, Understanding synthetic aperture radar images, Artech House. [14] Christensen, E. L., N. Skou, J. Dall, K. Woelders, A. Netterstrøm, J.H. Jørgensen, J. Granholm, and S.N. Madsen, 1998, “EMISAR: Polarimetric L- and C-band SAR”, IEEE Trans. Geosci. Remote Sens., vol. 36, pp. 1852-1865
1013
Fig. 1. EMISAR image (Span image) L-band, May 20, 1998. A: winter wheat, B: spring barley, C: oats, D: peas
Fig. 2. Segmentation using diagonal elements
Fig. 3. Segmentation using azimuthal symmetric covariance matrix