rations containing species of the Urticaceae family. 1. Introduction. Pollen analysis is used in a wide range of applications such as paleoclimatic reconstruction ...
Pollen classification using brightness-based and shape-based descriptors M. Rodr´ıguez-Dami´an, E. Cernadas, and A. Formella Dpto. de Inform´atica Universidade de Vigo, E–32004 Ourense mrdamian,cernadas,formella�@ei.uvigo.es Abstract Pollen grain classification have recently received more attention from computer vision researchers. To distinguish among taxa, palynologist make direct use of keys such as the size, exine structure and sculpture of the pollen grains. We propose a framework in which the pollen grains of each taxa are characterized using brightness and shape descriptors derived from their intensity images. These descriptors are associated to the ornamentation and morphology of the pollen grain. The method is statistically evaluated on preparations containing species of the Urticaceae family.
1. Introduction Pollen analysis is used in a wide range of applications such as paleoclimatic reconstruction [8], derivation of geographical origen of products gathered by the hive-bee, study of allergenic processes in medicine [1], etc. The task of classification and counting of pollen grains needs highly skilled personal and is very laborious. Stillman and Flenley summarized the needs of palynology in the following ones [14]: more sites, fine resolution, larger counts, higher speed, more objectivity and finer determination. They also summarized the advantages that would arise if an actually automatic system was developed. Most published studies have used computerized texture analysis of SEM (Scanning Electron Microscopy) images [7, 8]. But as mentioned France et al. [3], this procedure is not feasible for a use in systematic analysis. Therefore, the system should focus in the analysis of images taken by a standard optical microscope. The tasks for an automated pollen analysis system will be pollen identification and classification [3]. Pollen identification is the task of finding the location of the pollen grain in the image, the second tasks attempts to classify the pollen grain into a taxonomic category. France et al. applied a neural network to
P. S´a-Otero Dpto. de Biolox´ıa Vexetal e Ciencias do Solo Universidade de Vigo, E–32004 Ourense
a square gray level patch, which encloses an isolated grain of pollen, in order to achieve classification. However, palynologist normally use descriptors of the pollen grain such as morphology, size, surface sculpture in their daily work to characterize each taxa. We propose an approach to classify pollen grains based on combining shape and brightness parameters of the pollen grain, imitating the procedure that the human operators use to do it. Previous attempts to automate pollen analysis are focused on pollen identification of species that human experts are able to distinguish in a pollinic analysis with the help of an optical microscope. Some of the species of the Urticaceae family are very allergenic and abundant in the Iberian peninsula and the morphology of their pollen is so similar that palynologist are unable to distinguish them easily in routine pollinic analysis. Alternative methods for counting and distinguishing these species have long been awaited by clinicians due to the fact that human sensitivity is different for each specie.
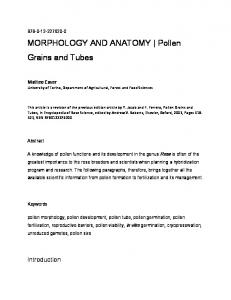
2. System overview The system consists of the following blocks: detection of the pollen grains in an image taken by an optical microscope, recognition of the boundary of the pollen, extraction of the features of each recognized pollen, and, at last, classification of the pollen into categories. To detect the pollen grains, an algorithm based on the Hough transform is applied to a down–sampled image resulting in a coarse estimation of the outline of the pollen grains, which is combined with active contour models (snakes) in order to determine the accurate boundary [11]. Figure 1 shows an image, where the detected pollen grains are overlapped with a bright line circle, figure 2 shows the initial and the final boundary for the different pollen grains. The performance achieved was 82% of the pollen grains correctly detected with almost no false positive per image (less than one pollen on average).
0-7695-2128-2/04 $20.00 (C) 2004 IEEE
We also tested in a previous work [10] the performance of common shape features on pollen grains in optimal conditions for the identification. The results were very promising, but the performance decreased when all the pollen grains of the database were considered. In this paper, we describe improvements which we achieved combining shape and brightness descriptors.
second order statistics. All of them are briefly described in the following.
3.1. Geometric features on binary images The geometric features on binary images contain the following 11 measures of the object: area , perimeter � divided by area, largest diameter, compactness calculated as � � ���� �, roundness as the opposite to compactness, number of holes, thickness � defined as the number of times an image can be eroded until it disappears, elogatedness defined as � ¾ and three rates of changes Let �� , ���� , and ���� be the average, the largest and the smallest distance between the centroid and the boundary of the object, respectively. We compute the following rates: ��� ��������� , ��� ������� and ��� ���� ��� .
3.2. Region moments Let � be a connected set of points contained in the plane , we define a bright shape as such a region � . The definition of the moments of a bright shape generally refers to a pixel location � � � � and a pixel value � � � being the intensity or gray–level of the pixel:
�
Figure 1. A typical image of the preparation is shown and the detected pollen grains are marked with a bright circle.
�
�
� ��� �¾ � � �
(1)
�� � � � � � � � � � ��
(2)
where � is a normalization constant. The moments of a shape in a binary image is a special case in which � � � �, � � � � and � �. In a bright shape, � is the number of pixels of the region � . The region moments are simple features based on the mass distribution of the objects for shapes in binary images and on the gray–level distribution inside the objects for bright shapes. The central moments � represent descriptors of a region that are normalized with respect to the location in order to obtain translation invariance. They are defined in terms of the centroid � � � � �:
�
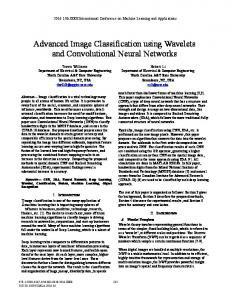
Urtica
Membranaceae
Parietaria
Figure 2. Accurate recognition of the boundary of pollen grains of different species of the Urticaceae family: represents the final outline of the pollen after applying snakes to the initial one .
�
�
��� �¾
Commonly, the central moments are also normalized with respect to the zero order moment to yield the normalized central moments. Hu [5] derived seven orthogonal invariant moments from the central normalized moments, that are invariant to a general lineal transformation.
3. Pollen grain descriptors We have computed different feature vectors based on the outline boundary and the geometric properties of the pollen grains and the gray-level distribution inside the pollen. In particular, we chose specific sets of binary geometric features, statistical moments, Fourier descriptors, and first and
3.3. Boundary moments If � is a connected set of points that represents the outline of the object instead of a compact region, the mentioned
0-7695-2128-2/04 $20.00 (C) 2004 IEEE
moments can also be calculated and, in this cased, they provide information about the pollen grain boundary.
3.4. Fourier descriptors Fourier Descriptors (FD) are a promising technique for shape classification based on the analysis of the boundary points [2]. We use the complex representation of each boundary point. The contour is an ordered set of points �� � � � � , � �� �� � � �� � in the complex plane. The discrete Fourier transform (DFT) of the signature �� is:
�
� �� �� � � ����� ���� �� � ��� �
�
� �� � � � � �
(3)
The resulting complex coefficients ���� yield FDs in the form of a power spectrum ���� . High–frequency components of ���� account for the fine details of the boundary and low–frequency terms describe the global shape of it. The requirement to be invariant under translation impose
. Rotating the contour in the spathe condition �� � tial domain and shifting the starting point in the contour do not affect the magnitudes of the FDs. The dependence on the scale can be eliminated dividing each coefficient by ���� . However, the area could be an important feature in our shape classification problem, hence, the last normalization has not been considered.
�
�
� �
�
�
3.5. Brightness features We test the performance of other descriptors of the gray– level region with the following well–known first and second order statistics: HC: a vector containing the seven coefficients proposed by Haralick et al. from the co-occurrence matrices [4]. To deal with irregular shapes, only those pairs that fell inside the irregular shape were taken into account. GLRLS: a vector containing the five gray–level run length statistics [13, 12]. NGLDS: a vector containing five measures calculated from the Neighboring Gray Level Dependence Matrix [12]. FOS: a vector containing five first–order statistics (average, variance, third and fourth statistical moment, energy and entropy) [15]. BF: a vector being the union of the previous ones.
4. Results and discussion Microscopical preparations of some species of the Urticaceae family were made from plants picked up in various
villages of Galicia (Northwest of Iberian Peninsula). 77 images, in more detail, 26 Parietaria Judaica, 10 Urtica membranacea, and 41 Urtica Urens have been used to evaluate the performance of the system. The number of pollen grains per image ranged from 2 to 16 pollen grains. The total number of pollen grains of each specie was: 98 Parietaria Judaica, 100 Urtica membranacea, and 93 Urtica Urens, respectively. Figure 2 shows images of every specie. Once the pollen grains have been extracted, the feature sets mentioned above are computed for every pollen grain. The classifier uses these features to assign a pollen grain to a specific specie. We use a minimum distance classifier (MDC). The metric used to measure the similarity between a query case and the mean class prototypes is the Mahalanobis distance. The prototype class is calculated taking the mean vector on the training set. We also have used the leave–one–image–out cross–validation rule to obtain an unbiased estimation of the recognition accuracy. To improve the classification rate, an important issue is how to select “good” features. We used the Floating Search Method (FSM) [9], where the system sensitivity—using the MDC based on Mahalanobis distance—is used as discrimination criterion. The main drawback of simple FSM is that it can be trapped in cycles, in which case we stopped the searching process. The percentage of correct classification using the geometric features of binary images was only 63%. Lower moments give information about the coarse shape of the object while higher moments provide information of the finer details. Because our objects are quite similar one to each other, we calculated the moments up to the 5�� level. Finally, we formed the vectors: normalized moments with 36 elements, central normalized moments with 33 elements, Hu vector with 7 elements and the unions of all features. These moments are computed on a region � , where � is a binary region, a boundary, or a bright shape. For a bright shape, invariance to rotation in normalized central moments �, reis achieved taking the average of � and � , � sulting in only 21 elements instead of 36. Table 1 summarizes the results. For the brightness features, the percentage of correct classification increased to 79%, 70%, 76%, 72% and 86% for FOS, HC, GLRLS, NGLDS, and BF feature vectors, respectively. We set the total number of samples for the Fourier analysis of the boundary to 512. The performance of FD reached 90% considering just the first 8 entries of the transformed vector. Although the classification rate based on boundary features, shape features, and brightness features is encouraging, system performance may be improved by combining the information. We tested two strategies: merging individual outputs of simple classifiers and merging selected features to yield a new feature set [6]. The output of the combined classifier was done using class majority voting be-
0-7695-2128-2/04 $20.00 (C) 2004 IEEE
�
Calculated on Binary region Bright region Boundary
Norm. 75 77 73
Moments Central norm. 48 71 71
Hu 43 74 71
All 76 79 77
Table 1. Percentage of correct pollen grain classification for different sets of moments (columns) calculated on various types of points (rows). tween individual ones. Let � the number of simple classifiers combined, the majority voting will assign to a query case the class level vote by at least �� � ���� individual classifiers. We take the best one for each type of information, i.e., FD, BF and the normalized moments. The result obtained was 90%. As second strategy, we constructed a feature vector including the features which have been selected by the FSM algorithm for the mentioned best individual classifiers. The result obtained was 91%.
5. Conclusions and future work An automatic system to discriminate and count pollen species has been described. The percentage of correct classification with the Fourier descriptor reached already 90%. This can be considered an excellent rate. Usually, palynologist do not distinguish the species within the Urticaceae family in their routine analysis. The attempt to improve the rate by merging feature vectors achieved only a slight improvement, so more sophisticated classifiers (e.g., neural networks) may be investigated.
[5] M. Hu. Visual Pattern Recognition by Moments Invariant. IRE Transaction on information Theory, 8, 1962. [6] L. I. Kuncheva. A Theoretical Study on Six Classifier Fusion Strategies. IEEE Trans. on Pattern Analysis and Machine Intelligence, 24(2):281–286, 2002. [7] M. Langford, G. Taylor, and J. Flenley. Computerized identification of pollen grains by texture analysis. Review of Palaeobotany and Palynology, 64:197–203, 1990. [8] P. Li and J. Flenley. Pollen texture identification using neural networks. Grana, pages 59–64, 1999. [9] P. Pudil, J. Novovicova, and J. Kittler. Floating search methods in feature selection. Pattern Recognition Letters, 15:1119–1125, 1994. [10] M. Rodr´ıguez-Dami´an, E. Cernadas, A. Formella, and M. P. de Sa-Otero. Pollen classification of three types of plants of the family Urticaceae. In 12th Portuguese conference on pattern recognition. Aveiro, Portugal, 2002. [11] M. Rodr´ıguez-Dami´an, E. Cernadas, A. Formella, and A. P. Gonzlez. Automatic identification and classification of pollen of the Urticaceae family. In ACIVS, 2003. [12] L. H. Siew, R. M. Hodgson, and E. J. Wood. Texture Measures for Carpet Wear Assessment. IEEE Trans. on Pattern Analysis and Machine Intelligence, 10(1):92–104, 1988. [13] M. Sonka, V. Hlavac, and R. Boyle. Image Processing, Analysis, and Machine Vision. International Thomsom Publishing (ITP), 1999. [14] E. Stillman and J. Fenley. The needs and prospects for automation in palynology. Quaternary Science Reviews, (15):1–7, 1996. [15] S. Theodoridis and K. Koutroumbas. Pattern recognition. Academic Press, 1999.
Acknowledgment This investigation was supported by Vigo University project Automatic classification and count of pollen from digital optical microscope images.
References [1] A. Corbi, C. Corte, J. Bousquet, A. Basomba, A. C. J. Garcia-Selles, G. D’Amato, and J.Carreira. Allergenic crossreactivity pollens of urticaceae. Int. Arch. Allergy Appl., 77:377–383, 1985. [2] L. F. Costa and R. M. Cesar. Shape-Analysis and Classification Theory and Practice. CRC-Press, 2001. [3] I. France, A. Duller, G. Duller, and H. Lamb. A new approach to automated pollen analysis. Quaternari Science Reviews, 18:537–536, 2000. [4] R. M. Haralick and L. Shapiro. Computer and Robot Vision. Addison-Wesley, 1993.
0-7695-2128-2/04 $20.00 (C) 2004 IEEE