Jun 9, 2010 ... Depending on the Microcontroller/Microprocessor. 1. Preface....................................
........................................................................................................ 2. 2.
Author: Holger Wild, iSYSTEM AG
Possibilities and Limits of Software Debugging Techniques Depending on the Microcontroller/Microprocessor
1 2
3
4
5 6
Preface............................................................................................................................................ 2 Hardware-based Debug Functionality through Different Debug Interfaces.................................... 3 2.1 Standard Production Chips .................................................................................................... 4 2.2 On-Chip Debug (OCD) Interface............................................................................................ 4 2.2.1 OCD with Specific Debug Channel ............................................................................... 5 2.2.2 OCD with Real-Time Watch (RTW) Functionality ......................................................... 5 2.2.3 OCD with Internal Trace................................................................................................ 6 2.2.4 OCD with External Trace Port (TP) ............................................................................... 6 2.3 Emulator with Standard Chip ................................................................................................. 8 2.4 Special Chip with Additional Pins for the Traceport ............................................................... 9 2.5 Special Bond-Out Chip......................................................................................................... 11 2.6 FPGA Emulation .................................................................................................................. 11 Debug Functionality from the Users’ Point of View ...................................................................... 12 3.1 Periodic Stop of MCU Program Execution (Breakpoints) .................................................... 12 3.2 Code Instrumentation........................................................................................................... 13 3.3 MCU with Real-Time Watches via OCD Interface ............................................................... 14 3.4 MCU with Internal Trace Memory ........................................................................................ 14 3.5 MCU with External Trace Port.............................................................................................. 15 3.6 Emulator ............................................................................................................................... 17 Trace, Profiler, Code Coverage .................................................................................................... 18 4.1 Trace .................................................................................................................................... 18 4.2 Trace Trigger & Filter ........................................................................................................... 18 4.3 Profiler .................................................................................................................................. 19 4.3.1 Code Profiler................................................................................................................ 19 4.3.2 Data Profiling ............................................................................................................... 20 4.4 Code Execution Coverage ................................................................................................... 21 4.5 Upload While Sampling (UWS) with Streaming ................................................................... 22 4.5.1 "Deep (Big) Trace File" => Streaming & Compression ............................................... 22 Set-up of an On-Chip Debugger ................................................................................................... 22 iC5000: The New Generation of iSYSTEM Tools......................................................................... 24
Possibilities and Limits of Software Debugging Techniques
2010-06-09
1/24
1 Preface The first microprocessors and microcontrollers (CPU/MCU) did not supply any runtime information for an application. The detection of software errors was very difficult and required a lot of time and substantial measurement effort. Software projects, most of them based on 8 bit microcontrollers, required little memory and had manageable code size – mostly programmed in Assembler.
The “good old” DIL40 Zilog is still used in a few embedded applications - by comparison, the wiring diagram of a current 416 pin BGA of an embedded high-end controller.
Safety-critical applications, or crucial and high-quality applications – provided that microcontrollers were permitted at all in this context – were tested by means of code simulation, code instrumentation and mainly external methods which involved substantial test expenses and a lot of time, unless a powerful processor hardware emulator was available (see following section). “printf debugging” was a notorious method especially at that time – and it still is – i.e. inserting control functions in the software, for example, for the output of global values at runtime through available MCU interfaces. Another popular method is the activation/deactivation of free port pins to externally measure the execution time of program routines. Recent architectures with specific functionality (ARM-Cortex M3 ITM) make use of the “printf” method again, without wasting MCU interfaces. The negative aspect about “printf debugging” is that it involves extensive code modification, affecting both the execution time and the runtime behavior. In addition, the receiver program of the transmitted data – e.g. a PC application – often has to be adapted continuously unless it is a mere display function. There is, moreover, no standard for “printf via onchip debugging”.
Possibilities and Limits of Software Debugging Techniques
2010-06-09
2/24
Emulators are leading the field here. They provide a socalled “trace” functionality in order to record program execution with time stamps and external inputs (and even outputs). By current standards, the first emulator trace memories were very small, e.g. 8 Kbytes, then 16 Kbytes and finally 512 Kbytes. Programs were written in Assembler, and, in the beginning, C compilers were neither perfect – some of them were even useless – nor did they supply the debugger/emulator with any information for further analysis. The memory unit of the tool (fastest SRAM) was very expensive and required complex management logic. Only small data volumes could be transmitted, within a reasonable time, through serially coupled tools. More sophisticated devices had own interface cards in the PC or were at least connected parallel. At that time, PCs would not have been able to process or store large data volumes within a reasonable time anyway. Today, customers do have much higher demands on tools supporting software debugging and verification.
Emulators offer most ease of use for debugging/testing. However, such tools can only be “set up“ under certain conditions, see 2.
2 Hardware-based Debug Functionality through Different Debug Interfaces The acquisition of information about the behavior of the application software mainly depends on the type of MCU used. For this reason, the selection of an MCU should always be based on consideration of not only general performance data, package type, compiler and unit price but also on debugging and trace functionality. This is a must for safety-critical software, especially to provide proof of a product’s accreditation. In the following, hardware-based debugging capabilities are listed in ascending order of their quality and functionality.
Possibilities and Limits of Software Debugging Techniques
2010-06-09
3/24
2.1
Standard Production Chips
For historical reasons, these MCUs do not offer any on-chip debug functions, e.g. 8085, Z80, 8051, 68000, etc. The developer’s motto is: edit the program, translate it, fill the external EPROM with binary code, plug in, switch on and hope for the best. The only and widely used method of debugging is the emulator (or in-circuit emulator, ICE) offering a wide range of functions and suitable performance depth (all buses are available). Testing is done using the original CPU/MCU and/or (software) core simulators. 2.2
On-Chip Debug (OCD) Interface
Nearly all more recent MCUs feature this interface. Unfortunately, there is no standard that defines the range of functions, the required amount of MCU lines or interface speeds. In older implementations, debugging is only possible in RAM, because a break command has to be inserted (in RAM) to halt program execution. However, downloading/flashing of code and run control (start, stop, single-step, break) work well today, because semiconductor vendors provide the required functionality on-chip. Common terms used in connection with OCD are e.g. BDM, JTAG, SWD, N-wire, even though these terms mainly refer to the type of connection only and not to the functionality or speed of the debug unit in the MCU. Terms like “JTAG” (debugging) for OCD in general are also used wrongly in this context. For example, an OCD is definitely not an “embedded ICE” – even with additional Nexus/BDM and optimal connection, it does not offer the fundamental, design-based functionalities of an efficient, real MCU emulator. An MCU emulator, for example, offers any number of code breakpoints and large trace memories. In comparison, many OCDs only have 2 breakpoints (some up to 6) one of which is reserved for the debug tool. More complex debug tools offer an alternative through flash patch breaks, however, setting and deleting requires a considerable amount of time (depending on the flash sector size). Some MCUs integrate several OCD functions listed in the following table:
Possibilities and Limits of Software Debugging Techniques
2010-06-09
4/24
JTAG Debug lines minimum + GND
5
ETM7/9
Cortex M3 SWD
Cortex M3 JTAG
5 + 10
2 (3 for SWD trace, 7 maximum)
5
7
27 (16bit trace lines)
Cortex ETM, SWD 2 lines
Currently CORTEX ETM +4 additional lines for synchronous trace, not available for low pin count MCUs
14 / 20 pin header
standardized MICTOR connector
10/20 pin 1,27 mm header, etc.
no standard yet, like JTAG, or more compact
DCC usage
yes
yes
RT watches with monitor (#1)
yes
yes
not applicable due to SWD not required, "series"
not applicable due to SWD not required, "series"
"Real" RT watches
no
via trace, can be limited
yes
yes
TP possible depending on chip, partly limited, but more internal functionality FPB + DWT, often 6 code + 2 comp.
TP possible depending on chip, partly limited, but more internal functionality FPB + DWT, often 6 code + 2 comp.
Debug lines maximum (depending on MCU) + GND
Connector standard (Mictor offers JTAG function!)
On-chip trace
no
trace port (TP)
Number of hardware breakpoints in MCU
2
2
Soft or flash patch breaks (#2)
available
available
available
available
ETM + ETB in MCU, read-out via JTAG
available, might require new tool
not required
depending on chip; not required, might require new tool
depending on chip; not required, might require new tool
Comments - Table 1: (#1) consumes comparably high computing power due to monitor processing. (#2) Depends on tool, low-cost tools do not use any or only low-speed flash patch breaks. Table: Comparison of different ARM OCD interfaces
2.2.1 OCD with Specific Debug Channel Examples: ARM DCC, ARM-Cortex M3 IWT. For data output via the OCD connection and from the debug tool to the PC, additional software (referred to as “monitor”) that is either self-programmed or provided by the tool vendor has to be processed periodically in the MCU (vendor ROM, proprietary) or application. This process involves problems related to MCU sleep modes, the required synchronization as well as relatively low interface speeds that, moreover, are subject to the system clock which sometimes alternates or is low. Advantage: No ‘normal’ MCU interfaces are required. 2.2.2 OCD with Real-Time Watch (RTW) Functionality In addition to the functionality of an OCD with specific debug channel, memory content can be read out periodically via the interface without a monitoring program in efficient RTW-OCD implementations, even without (perceptible) impact on the realtime behavior. Possibilities and Limits of Software Debugging Techniques
2010-06-09
5/24
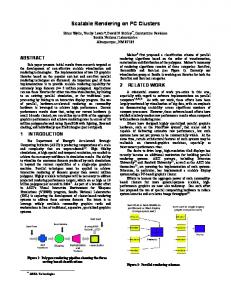
2.2.3 OCD with Internal Trace Here, a specific (often dedicated) memory of the MCU – so far, a very small memory - is used, after setting certain recording start or stop conditions (=>internal triggers), for the real-time recording of program sequence execution and/or variable accesses. The debug tool reads out the result via the usual OCD interfaces (starting with 1 pin, e.g. Freescale BDM) without disrupting program execution and displays it. This requires intelligence in the debug tool. Moreover, there is no standard that defines triggers, memory depth, recording functionality and format as well as protocols. In this context, the term ETB (embedded trace buffer) is often used in the case of ARM derivatives. 2.2.4 OCD with External Trace Port (TP) After the emulator, the TP offers the most efficient debug and test functionality. This is the most common and most important feature of more recent 32 bit MCUs and shall therefore be explained in detail. TP is used to obtain information related to code execution. It does not affect the realtime behavior and is extremely efficient. Trade-offs have to be made in order to actually see data. Nevertheless, both features are technically possible, even at the same time. For OCD, additional dedicated MCU lines are used (usually 1 to 16, often 4, 8 or 12) to output information during real-time program execution. Information from different sources is combined in the MCU by the ETM/Nexus/Trace unit and then synchronized and transmitted. Queues are used to manage short peaks and facilitate correct output.
Complex trigger and filter logic (simplified view) on an in-circuit emulator (left) compared to the seemingly “simple” TP debugger logic (right)
There are exact standards for recent MCUs, e.g. ETM (ARM standard) or NEXUS (www.nexus5001.org), defining the assignment and physical parameters (timing etc.) Possibilities and Limits of Software Debugging Techniques
2010-06-09
6/24
of TP lines. However, a wide range of configurations is possible and, as a result, implementations of this current technology are more or less efficient. An external TPA (trace port analyzer) is required in any case to evaluate interface data. An efficient TPA with profiler and code execution coverage always relies on complex hardware and software and is therefore not available as low-cost variant. Unfortunately, many MCU users are still not aware of the high efficiency of such a TP with TPA, even though the TP is integrated in their MCU. Without this knowledge, customers run the risk of using the lines required for the TP for the application, thus spoiling the option of using the TP with TPA at least for verification and test in future. TPs operate at very high frequencies, and the required lines to the complex (Mictor) connector have to be short and linked properly to the MCU in the target layout. The more lines run in parallel, the higher will be the data throughput. So if he has a choice, the user should provide for the maximum number of trace port lines in his design. Code trace on a 32-bit MCU is possible even at maximum clock frequency and 4 (+1) lines. What is the reason? The TP does not output individual MCU cycles via the port but rather compressed, encrypted message bytes as well as sync messages. These bytes are meaningful only in connection with the code held externally in the TPA or (in parallel!) the PC (e.g. “5 commands, 3 commands, 10 commands executed by MCU” =>> main program starting at main() + function “XYZ” executed...). Port load can thus be reduced by approximately 90%.
ETM implementation, e.g. with ARM7. In more recent tools, TPA and JTAG-OCD are one unit.
The TPA stores these messages that, depending on the MCU, can also appear block-wise (data block / code block / data block / …) in the trace buffer and sorts them accordingly so that the trace buffer should be as large as possible. However, this requirement is subject to cost, upload time and processing time constraints. The TPA reconstructs the actual MCU execution from the messages, either after recording (“offline”) or during recording ("upload while sampling"). This works perfectly for code, provided that everything can be recorded via an adequate number of lines. Overflows that may occur in the MCU (which has got internal FIFOs) are signaled to the tool, besides much other useful information, and the session continues seamlessly (only one segment is missing). Possibilities and Limits of Software Debugging Techniques
2010-06-09
7/24
To prevent imminent overflow, the core can be slowed down slightly in many MCUs by setting a select bit in the trigger. A choice can be made between unconditional real-time or full recording. The danger of overflow mainly applies to the output of data where compression is hardly possible (e.g. 32 bit data + 32 bit address …). As long as the TP outputs data without any problems, only the memory depth of the TPA is subject to limitation. The recording time and volume can be substantially extended beyond the physical size of the (ring) buffer in the TPA through "upload while sampling” combined with streaming to large files on the PC. Connection via USB 2.0 high-speed at 480 MBit is crucial, because even Gigabyte ETH is less suitable here for reasons of package size, package collision and protocol overhead. USB 3.0 is anticipated to enhance performance (factor 10 is expected). 2.3
Emulator with Standard Chip
Some MCUs, such as Freescale HC08 or MC9S12x, offer specific modes as standard, sometimes even in addition to OCD, that allow for the set-up of a highperformance emulator. In this case, the emulator always uses the original MCU and couples it with additional electronics. Now, an address/data/control bus is conveyed to the outside instead of ports. Therefore, the set-up of an emulator always requires a minimum pin count (typically more than 100 pins). Based on specific, elaborate solutions, “wasted” ports are restored through FPGAs etc. in the emulator such that it looks like the original single-chip microcontroller. For using the emulator, the MCU in the target system has to be desoldered and contacts have to be connected to the emulator through solder-down adapters. Smaller package outlines of the target MCU are implemented without any problems by means of adapters, i.e. the emulator integrates a so-called umbrella device that covers all MCUs from one product family/derivative. This type of emulator is still the most efficient solution for all debug and trace challenges that does not call for any major trade-offs. There are, however, limitations due to the actual MCU as well as technical and budgetary reasons that prevent a more widespread use of emulators. Moreover, MCU vendors are (unfortunately) more and more reluctant (cost per chip/additional chip area) or physically able (ever increasing clock frequencies) to provide an “emulator mode” for all standard chips.
Emulator base unit with a processor oriented device (POD) and an AUX card for tracing or triggering up to 16 external signals
Possibilities and Limits of Software Debugging Techniques
2010-06-09
8/24
2.4
Special Chip with Additional Pins for the Traceport
In more recent solutions, the TP is led outside only for MCUs with specific package outlines or maximum pin count (e.g. BGA 208 instead of QFP 176 package), however, this is still the usual “series silicon”. It is a sophisticated and cost-efficient solution for high volume production. The user can solder the normal “small” processor to his target system and does not require any lines that are no longer needed after debugging or any special connectors to the TP on each target system. Using the TP in this context is similar to proven emulators, and tool vendors provide a POD to this end. This is an old emulation technology term by Intel and means “process oriented device”. In general, it refers to the active, processor-near electronic system of an emulator. The “TP-POD” now contains this special chip with TP and, additionally, the complete TPA logic as well as a plug connector for the target hardware. By means of solder-down adapters, debug functionality is achieved that can be compared to an emulator with standard chip. The user can start working with this type of POD immediately, as all MCU pins are led outside and the POD provides, amongst others, for voltage supply and clock frequency, eliminating the need to wait for functional target hardware. Example: "Bolero" Freescale MPC5604 (see image below). If the costs of the POD or solder-down adapters are considered to be too high in case of a small number of target systems with low added value, a prototype that has a different layout with the special chip + TP connector can be used. The so-called “piggyback” approach with connection to the target hardware is a useful and costefficient solution for using a TP. Mechanical implementation and practical operation, however, can be quite complex and have to be managed by the customer. "Piggyback": A compatible, larger-sized MCU is mounted, piggyback and in parallel to the target board, on a small additional board in lieu of the initial MCU. It also accommodates the TP connector and, in most cases, the MCU oscillator. The oscillator solution provided on the target (mainly simple R/C oscillators or quartz) does not work because the distance to the target is longer. The traces are arranged on the miniature board according to a converter so that the pin-out and functionality of the ‘smaller’ original MCU are reached at the bottom side of the miniature board and led to a plug connector. From here, further connection to the solder-down adapter (probably plug connector) on the target board is implemented via cable or fixed connection. Solder-down adapters are applied to the target instead of the MCU, like with an emulator. For prototypes, this solution can be implemented with low-cost standard connectors. Some MCU vendors offer such piggyback boards. Changes to the software might be required in case the chip does not have a specific TP version with additional lines but is a larger-sized member of the product family, with more memory and functionality as well as additional IO. For example, UART3 can be used instead of UART1. This approach requires some work and deliberation. In the long run, however, it is worth the effort, in particular, to the benefit of further projects.
Possibilities and Limits of Software Debugging Techniques
2010-06-09
9/24
On-chip debug solutions for Freescale Bolero: “piggyback” with TPA and POD solution
Possibilities and Limits of Software Debugging Techniques
2010-06-09
10/24
2.5
Special Bond-Out Chip
This is the most extreme and complex solution. Standard production chips only need to offer basic debug functionality which might reduce the cost of production. The actual term “bond-out” is neutral and could also refer to the above mentioned chip where the TP is led outside. In the context of debugging, the term “bond-out” mostly refers to specific MCUs that are virtually drilled out and offer many more lines and probably even access to internal buses/registers and other MCU insides, often in connection with additional modes. There are also solutions for multicore processors, i.e. one chip for the core and others for different I/O functions so as to efficiently emulate completely different derivatives. Design is limited only by physical and budgetary aspects of both the MCU and tools. However, this is also the most expensive solution by far and not much sought-after in times of tight tool budgets. Due to the high costs involved, bond-out chips moreover follow silicon steps (= improvement, error correction) less regularly. As a result, the device and tool have different MCU silicon versions which can cause major problems. 2.6
FPGA Emulation
For more recent, “slower” 8-bit and sometimes also 32-bit microcontrollers, MCU vendors provide tool suppliers with MCUs and, to some extent, peripherals in software as FPGA download files (encrypted). A high-performance emulator can be set up on this basis. Here, the core is in an FPGA and all other MCU elements are in another FPGA. The customer can design his own MCU including TP according to the modular design principle and test and develop it directly with his application. If this “in-house” development passes all tests, the design draft is sent to the MCU vendor who produces tests and delivers this solution as new, customer-specific MCU. This approach takes much longer and involves higher costs, especially for small and medium production volumes, compared to an off-the-shelf MCU. Moreover, the debug and trace tools provided by the MCU vendors have to be used. They are often expensive and not very powerful. The related total time and costs only pay off in projects that involve high quantities. To arrive at the optimal debugging solution, an experienced third-party debug tool vendor can be involved in development from the very beginning, to implement a suitable debug and trace tool for this customerspecific chip.
Possibilities and Limits of Software Debugging Techniques
2010-06-09
11/24
3 Debug Functionality from the Users’ Point of View The following section discusses debug functionality from the users’ point of view: “What do I get out of it? What is possible? What are the advantages/disadvantages?”. The discussion starts with the most basic solution and works its way up to the optimal approach.
Example: Standard debug functions offered by the integrated development environment winIDEA (iSYSTEM)
3.1
Periodic Stop of MCU Program Execution (Breakpoints)
Program execution can be interrupted for short/longer periods of time or periodically at defined locations in the program. Breakpoints or watchpoints are required in the MCU to halt program execution in case one or more variables change. This could also be managed through any type of emulator. Another approach is the test of critical software sections in automatic single-step mode with a query of values and comparison with nominal values. Real-time is given up to the break, and no code instrumentation/ modification is required. A powerful debugger/emulator determines all required information at the breakpoint after the stop (memory contents, variables, registers, etc.) and exports/stores it if required. In most cases, breakpoints can also be set or erased “on the fly” during real-time execution. However, the program can sometimes not be resumed properly after a stop, because internal MCU timers etc. have continued operation. External events often do not wait for the MCU and are not really predictable. Efficient testing based on periodic MCU stops requires exact knowledge of the hardware and software as well as a strategy. The test procedure is very complex. What really happens between stops remains unpredictable (e.g. one
Possibilities and Limits of Software Debugging Techniques
2010-06-09
12/24
more interrupt than expected) despite all effort, as is the case with code instrumentation (see next section). Example: Basically works with all popular OCD MCUs with any high-quality debuggers and emulators. Assessment: Basis for all OCDs. Features and functionality depend on MCU and tool vendor. Independent tool vendors can achieve significant improvement regarding the number of code breakpoints via flash break. For the rest, this fault finding technique is more like “groping in the dark” and no longer acceptable as the only test approach. 3.2
Code Instrumentation
Here, code is instrumented manually or automatically resulting in a constant change of code instrumentation, e.g. first for variable A, then for variable B, etc. The MCU executes more or less comprehensive additional code (referred to as MONITOR) in this case. Moreover, synchronization / handshake with the ‘target’ interface (mostly PC) is required to prevent overflow and thus loss of data on both sides. In most cases, variable value patterns can only be displayed consistently if the respective application remains idle. In this approach, code instrumentation causes the runtime of the application and its memory requirements to change more or less intensely and often variably. Supporting software is available that facilitates testing at functional/module level (e.g. LDRA, Razorcat-TESSY, etc.) and carries out the required code instrumentation semi-automatically or fully automatically, including the collection of results. This is not a real-time test, as the program does not execute in full and is always modified. A debugger with efficient API is required, e.g. "isystem.connect" by iSYSTEM Tools, to control complete test procedures in different programming languages and to analyze and store the results. Examples: Atmel ARM7 (only DCC possible, no ETM available). The same core by NXP features e.g. ETM trace port as standard. Possible for all common OCD MCUs and emulators with the use of MCU interfaces. Assessment: A low-cost solution at first glance, provided that the above mentioned instrumentation software does not have to be purchased. The merely manual method, however, requires a lot of time and labor and is prone to errors. Moreover, MCU interfaces are required that are often scarce and thus invaluable. Runtime changes particularly due to instrumentation might obscure certain errors or cause pseudo-errors. In many cases, only external time measurement is possible which is difficult to integrate in the test process. A free MCU timer can sometimes be used for segment-wise time measurement; however, the execution time of the instrumentation code that is subject to constant variation has to be deducted. An extremely exact knowledge of the hardware and software is required to obtain correct statements at all. However, this is the only test alternative for some MCUs.
Possibilities and Limits of Software Debugging Techniques
2010-06-09
13/24
3.3
MCU with Real-Time Watches via OCD Interface
With some MCUs, debug tool vendors can query information about memory contents and sometimes SFRs (not main registers) directly via the debug interface without the need for monitor code. The debug section of the MCU automatically manages the output of information to the debug tool, without or only slightly affecting the real-time behavior, e.g. 1 MCU cycle. There are hardly any constraints, however, the information is basically only a “snapshot”, i.e. it is not possible to continuously display the variable value pattern. The term “real-time …” is unfortunately not protected. Thus, some MCU vendors infringe on real-time by using the term “real-time watch” (>50 µsec interrupt per byte required – just imagine the reading of a larger array…). Here, MCU vendors should only talk about a “runtime watch”. Runtime watches are integrated in all standard production chips of the respective MCU families and operate even at maximum clock frequency. Consequently, it is strongly recommended to ask pointed questions (“How do you implement this?”) to the MCU and/or tool vendor. Tool vendors can sometimes avoid these constraints in case a trace port is available on which data can be output (e.g. shadow RAM). Examples for useful implementations: Freescale "BDMs", e.g. S12x cycle-stealing; longer interrupts are possible e.g. on ARM-Cortex M3 STM32 or NEC N-Wire. Assessment: Regardless of the implementation details, this approach provides software developers with additional methods to learn more about the program behavior. However, it cannot be ruled out that an unpredicted interrupt changes a variable between two real-time watch queries, with unforeseeable consequences at some other point in the program. With this technology, it is not possible to obtain timing information about program execution. 3.4
MCU with Internal Trace Memory
In contrast to the following section, there is no TP (see also 2.24) that is led outside to save on pins and package costs. ARM refers to this solution as ETB (embedded trace buffer), Freescale calls it trace or "embedded ICE" which may be confounded with “real” emulators/ TPA tools. Regardless of the MCU vendor, specific single or complex triggers, partly with sequencer, can be set to record program execution and/or data accesses. A dedicated on-chip memory section that is available on all standard production chips is used to this end. The debug tool manages / sets / modifies the respective triggers and transfers the memory content, together with the result, from the MCU to the PC via the debug interface. The data is then processed and displayed. One benefit of this approach is that it does not affect the real-time behavior and can be reused over and over with modified settings. Unfortunately, no standard is available for triggering (variations are possible even within the same MCU family) that can be highly complex and abstract when the limited amount of bytes of the internal trace memory shall be used. Examples: Freescale S12x, HCS08, various ARM, e.g. LPC3250
Possibilities and Limits of Software Debugging Techniques
2010-06-09
14/24
Assessment: MCU product flyers fail to mention some serious disadvantages, e.g. compared to emulators or external TP. In some solutions, complex triggers/sequencers seem to be useful only if the error is already known and if there is sufficient knowledge of what needs to be tested and how in order to find the error. The actual trigger and its runtime environment are not recorded at all. Due to restricted internal trace memory, only branches are recorded without history. In most cases, this causes mistriggering (recording starts with next branch AFTER the event, i.e. the actual event cannot be seen…). Result analysis is therefore laborious and difficult to adjust to. Moreover, it is not possible to see both code and data at the same time during a session. Only numerical values are supplied for variables, without any reference (e.g. 8x variable value, but no information about who wrote it at what time). A time stamp is missing in almost all implementations – with one quite exotic exception in the telecom area. Thus, no temporal relations can be determined without additional code instrumentation (see previous sections). The main issue in all available solutions is limited on-chip memory depth (due to costs and available MCU chip size, and designers obviously failing to focus on practical implementation and use). Profiler and code coverage analysis are therefore not an option. Typical memory depth ranges from e.g. 8 byte (8-bit MCU) to 64 byte (16-bit MCU) and 2 Kbytes (32-bit MCU). ARM specifies values of more than 100 Kbytes for ETB but this has not been implemented on any chip so far (and would still be much too small). De facto, all on-chip trace buffers offer much too low memory capacity, e.g. only for 32 variable values with address. When it comes to also recording and storing code at the same time, this solution is almost useless. By comparison, current TPA tools (or emulator PODs) offer 256 MB or >= 1 GB memory depth with "upload while sampling". An advantage of the internal trace solution is that it does not require any lines or resources of the MCU. It can be implemented even in small and low-cost MCUs and the result can be read out via the usual OCD interface. 3.5
MCU with External Trace Port
Depending on the TPA, it is theoretically possible to record an unlimited amount of data with an MCU on which the trace port is led outside (max. hard disk space/file size of the PC). A time stamp is used for the TPA based on which all temporal relations can be determined, with only minor variations due to the on-chip FIFO fill. The extremely large memory also facilitates explicit code profiling and code coverage besides code trace and data trace. The output of variable values/data depends on the MCU. Some MCUs offer full data access and multiple internally configurable range filters. One MCU family may offer different triggers. In some MCUs, for example, data access without value in connection with write can be triggered. Other MCUs do not output any data at all but facilitate a trigger of write access with exact value for code trace. Some trigger only write accesses and some trigger read and write accesses. A useful feature in this context is a “wizard” integrated in the TPA to avoid incorrect configurations of the MCU TP triggers/filters that can be quite complex and interdependent. For code-based recording, the external memory and the bandwidth of the TP is utilized most efficiently based on the ‘standard’ compression of MCU code access. The clock frequency of modern MCUs is not Possibilities and Limits of Software Debugging Techniques
2010-06-09
15/24
limited. By means of "upload while sampling" and streaming to file buffers in a PC via fast interfaces (USB 2.0 …), the TPA memory can be used as ring buffer to record data volumes beyond its actual physical size, if need be. Examples: ARM7 (partly), ARM9, ARM11, Freescale Coldfire (older), Freescale PowerPC Automotive (56x, 55xx, 51xx, 56xx), ARM Cortex M3 STM32 etc. depending on vendors. Assessment: From an unbiased point of view, a sufficiently wide and fast TP is the second best method of debug, trace and test support and is increasingly used in the 32-bit MCU market. Due to an unlimited data volume that can be recorded with a high-quality TPA and sophisticated code/data trace, profiling and code coverage functionality, bugs can be fixed at an early stage of the development process, or they can be avoided completely which saves a lot of time. Unless a piggyback solution can be implemented, however, the user has to expect “losing” MCU lines or I/Os. Moreover, additional lines and expenses for high-speed connectors (e.g. Mictor) for the TP have to be considered for the target layout.
Possibilities and Limits of Software Debugging Techniques
2010-06-09
16/24
3.6
Emulator
The emulator offers a maximum of possible debug support, depending on the MCU’s recording functionality (internal buses, DMA, registers, etc.). In contrast to all other solutions described before, it can record and trigger at each MCU cycle, take time measurements and filter and analyze the results as needed. In addition, code is downloaded faster because the emulation memory (SRAM) can be used rather than having to program the MCU flash.
An unlimited number of code breakpoints are standard here. They are set quickly, even "on the fly". Besides MCU speed/timing, substantial hardware and firmware/software costs are the main limiting factors for this type of solution. This applies in particular to the huge address spaces of 32-bit MCUs. In addition, there are external input lines the states of which can be recorded and used as trigger if required. It is also possible to have digital or analog outputs that are set with hardly any delay when certain program sequences are executed in the trace. Other than on-chip solutions, data filtering and triggering is no longer up to the MCU vendor only. An independent emulator vendor can integrate any technical refinements for debugging and test he has developed based on extensive experience and by dealing with customer requirements. Trace, profiler and code execution coverage, even data coverage, should be taken as a given. Examples: NEC V850, Freescale HC08, HC12/s12/s12x down to the flagship s12xEP100, NEC 78K0, Renesas R8c, and of course older CPUs such as Z80, 8085, 8051, 68000… Assessment: From an unbiased point of view, this is the best solution even though complex devices are involved. It is also difficult to keep pace with the fierce passion for derivatives exhibited by some MCU vendors. Moreover, solder-down adapters to the target system are required unless a plug-in prototype is available as target to which the emulator is directly attached. The emulator basically replaces the complete MCU of the target system. As described before, even complex triggers and Possibilities and Limits of Software Debugging Techniques
2010-06-09
17/24
sequencers of the emulator can be used for the recording of specific or infrequent events. Consequently, the costs of an overall solution to meet high demands cannot be compared with the cost of basic OCD debuggers. The following functions are offered in every case and require hardly any trade-offs: • trace (code and data values; sometimes, also special function register (SFR) writes, hardly ever: registers) • profiling (code and data) • code coverage (statement and decision) • on the whole, shorter development and test times and thus lower costs The following section deals with these issues and explains functions like "upload while sampling" and "big trace file" in their context. 4 Trace, Profiler, Code Coverage After the technical principles and functions were explained above, this section deals with the “measurement results” trace, profiler and coverage, starting with a definition of terms. 4.1
Trace
This refers to a consistent, complete or section-wise recording of program execution, with or without variable accesses and related values, without requiring any resources of the MCU. A real trace includes MCU-independent time stamps. Even with very fast MCUs, modern technologies (e.g. large buffers in the gigabyte range) facilitate recording over several seconds. If recording is limited to certain areas and "upload while sampling" is used, recording can last virtually “infinitely” (until the hard disk overflows). However, huge data volumes have to be transferred to the PC and analyzed and displayed there. Trace gaps are displayed automatically in case of a TP, however, execution and recording are continued. Thus, a trace run is suitable in any case for testing and verifying certain program behavior. As PC file, the acquired data can be exported to different formats, evaluated, processed and stored. 4.2
Trace Trigger & Filter
Especially for TP data trace, triggers and filters are key elements to prevent overflow situations. They serve to limit the data volume prior to recording, e.g. trigger at a write process for specific variable values, threshold excess, etc. If these triggers can be set via an API and the results can be taken over, test procedures can be extensively automated.
Possibilities and Limits of Software Debugging Techniques
2010-06-09
18/24
4.3
Profiler
The profiler serves to give an overview at functional level and data level. An average runtime as well as an accumulated time for each function, in relation to the overall recording time, are displayed. The “timeline” can also be determined, i.e. what function was interrupted at what time, e.g. by which interrupt, for how long, and what other function did it call how many times? 4.3.1 Code Profiler The compiler vendor indicates, e.g. in the download file, the addresses that contain the entry or exit points of the functions. Depending on the technology used (independent emulator or TPA), the tool vendor can make sure, e.g. via TagRAM, that the tool records the execution of only these addresses including time stamp. Subsequent analysis can thus determine the number of executions, minimum execution time (best case) and maximum execution time (worst case) for each function. This type of analysis can also be carried out with some cooperative, static operating systems, such as OSEK from the automotive area. Here, basically noninstrumented code is analyzed at real-time on the final target hardware. Depending on the MCU, technique and tool, profiler recording can last from a few seconds up to several weeks. With emulators and some TPs, the user can define exactly what shall be recorded so that the recording time can be largely extended. In case the TP does not offer any or only limited functionality for source data restriction, all data has to be recorded.
Possibilities and Limits of Software Debugging Techniques
2010-06-09
19/24
4.3.2 Data Profiling Data accesses are recorded instead of functions, with similar filtering options as described above. Crucial results can be obtained based on a time stamp and the related value, e.g. what values are written at what time, also in combination with functions (“who did it”…). This way, RTOS task profiling can be created, at a task switch, by writing a task number in a certain global variable that can be specifically recorded by the TPA. By means of an assignment table, the same analysis as used for function profiling can be carried out. This technique does not affect the real-time behavior either. Code profiling and data profiling can even be used simultaneously in some MCUs.
Possibilities and Limits of Software Debugging Techniques
2010-06-09
20/24
4.4
Code Execution Coverage
Code coverage determines which lines or instructions of the program were executed and which weren’t (yet). It is usually not possible to achieve test coverage of the whole program in one run, as different error and execution conditions have to be created one by one and different paths of the application are run through. For this reason, the tool operates adaptively and is able to store and aggregate intermediate results. With an emulator or TPA (depending on the MCU in use), the actual recording process can last for an infinite period of time. A set flag for “executed” remains set even after MCU reset, even if the instruction is executed several thousand times. This technique serves to analyze so-called statement coverage. Decision/Branch coverage is analysed off-line. Further automated code execution analysis (such as MC/DC) cannot be carried out with current TPA and emulator technology. This is where code instrumentation and software tools come in, if need be, in combination with TPA and emulator or debugger.
Possibilities and Limits of Software Debugging Techniques
2010-06-09
21/24
4.5
Upload While Sampling (UWS) with Streaming
As indicated in the preface, technological advance has caused an enormous increase in technical requirements. Modern trace memories have grown by a factor of 131,072 (8 Kbytes to 1 Gbyte). This memory can be coupled, as usual, to the CPU process or TP until it fills – which may take a few seconds or longer – read out and transferred to the PC. So what would be more obvious than to use the memory as ring buffer and read it out while it is filling? This is, of course, a technically complex solution and requires a very fast interface to the PC. The desired benefit cannot be achieved with low-cost solutions – the software in the debug tool and PC is even more complex. This technique offers multiple benefit and justifies the costs: • The user is presented with data immediately, i.e. the profiler image is set up before his face while the image still changes. Nevertheless, the user can see all significant information and start considering it immediately. For example, if a fatal result is already displayed, recording or program execution can be stopped at once so as to save time. Without UWS, the user always has to wait until recording is finished and the result is transferred to the PC, sorted, analyzed and finally displayed. • The recording volume and time is substantially increased by the additional streaming process, depending on the MCU clock frequency and data volume. • Data was already transferred to the PC so that software can directly start the analysis process which always reduces analysis time. 4.5.1 "Deep (Big) Trace File" => Streaming & Compression This refers to the creation of a very big result file on the PC into which results are transferred via “upload while sampling“. To be able to store even more data at the source (emulator/TPA) with “deep trace file“, this data can be directly compressed. For example, no external input line states are recorded with TPA so that more space is available for other data, thus increasing the data volume. 5 Set-up of an On-Chip Debugger In case of low-cost tools, each one tool is required per processor. As soon as a different processor is used, a new tool is required that is often completely different and has a new user interface. There is also demand for training. When maintaining older projects, the user jumps back and forth between different user interfaces which may cause user errors. This is one of the reasons why there is such high demand for user standards like "Eclipse" and "Microsoft Visual Studio" look alike integrated development environment (IDE). From a hardware perspective a more powerful tool that is based on a modular design principle, selected at the beginning of a project, can be extended to a complex TPA (trace port analyzer, see 2.2.4) at any time. Possibilities and Limits of Software Debugging Techniques
2010-06-09
22/24
Basic set-up of an on-chip debug workplace with iSYSTEM tools
Many elements can be reused so that the same functionality can be achieved if a different processor or even different semiconductor vendor is chosen. Users have to be trained to use the tool only once, and training can be gradually adjusted to cover additional functions of new processors. If full universality with maximum performance is required, iSYSTEM offers a powerful debugger/emulator for all modern MCUs: iC3000GT (see Blue Box in the image above). iC3000GT uses a technology to largely speed up the upload process, so that this platform is a very good choice for all giga trace or giga emulator pods from iSYSTEM. The following units can be plugged in to the universal iC3000GT device: • iCARDs: Interface cards for on-chip debugging (OCD). At the target system side, they feature suitable connectors for common MCU technology, some of them also with adapters. Cards that can be exchanged easily are available for all common OCD MCU families. • Interface card(s): Connect all types of emulator PODs and the iTRACE GT with iC3000. • Emulator PODs: Fully functional emulators controlled by iC3000GT and connected to them with an interface card. At the target system side, most of them feature an IDC or high-density connector for connection of the solder-down or other types of adapters for the target system. • iTRACE GT: Currently, the most powerful, fully universal TPA (trace port analyzer) for connection to iC3000GT via interface card. It is adapted to TP MCUs from different vendors through a continuously extended range of "iTRACE probes". • iTRACE Probe: Small, densely packed and active miniature board for signal preprocessing, with connection for iTRACE GT at one side and plug connector (mostly Mictor) to the TP of the target MCU. The complete unit can be adapted to all supported MCUs simply by exchanging the probe, i.e. only one component.
Possibilities and Limits of Software Debugging Techniques
2010-06-09
23/24
6 iC5000: The New Generation of iSYSTEM Tools iC5000 is based on most sophisticated hardware with a new "all in one" concept. Technically, it is comparable with an iC3000GT with OCD iCARDs and integrated iTRACE GT. iC5000 is available as complete basic device. The hardware is of block design and identical for all configurations. Low-cost plug-in adapter cables to the respective MCU are required. These are hardware-related and manageable requirements. Regarding software, the well-proven development environment winIDEA (if required, with Eclipse integration) offers all standard functions and software interfaces. iC5000 is offered at a relatively low basic price. A one-time license is required for using a processor family. Via a key, it releases the device according to the respective OCD. Group licenses are also available, e.g. ARM7, ARM9 or Cortex or all together. In addition, ETM / Nexus Trace licenses can be purchased at any time, allowing for the tool to be extended and adapted to the needs of the user. To support a new processor family, only the related adapter and license (release) have to be purchased. Customers benefit from a tool that can be extended at any time. iSYSTEM iC5000 is a high-performance solution offering extensive development and test support.
iC5000: iSYSTEM’s new, software configurable hardware platform for on-chip debugging and tracing, equiped with an optional I/O module.
Possibilities and Limits of Software Debugging Techniques
2010-06-09
24/24


![[halshs-00277054, v1] Possibilities and limits of web ...](https://m.moam.info/img/260x300/halshs-00277054-v1-possibilities-and-limits-of-web_59d4bf451723dde4b290017f.jpg)


