Power System Frequency Estimation Using a NewtonType Technique for Smart Meters Md. Shamim Reza, Student Member, IEEE, Mihai Ciobotaru, Member, IEEE, and Vassilios G. Agelidis, Senior Member, IEEE Australian Energy Research Institute and School of Electrical Engineering and Telecommunications The University of New South Wales, Kensington, Sydney, NSW 2052, Australia E-mail:
[email protected],
[email protected],
[email protected]
Abstract-This paper proposes a single-phase grid voltage fundamental frequency estimation technique for smart meters. The technique relies on a nonlinear Newton-type algorithm and a recursive differentiation filter (NTA-DF). It can reject the negative effects caused by DC offset, harmonics, notches and spikes. When compared with a NTA technique based on least-squares (NTA-LS), the proposed one reduces matrix dimensions, avoids matrix inversion and is computationally efficient, thus requiring less hardware and associated cost for real-time implementation. Moreover, unlike the NTA-LS technique, the NTA-DF shows less sensitivity to the presence of harmonics. Simulation and experimental results are presented to verify the performance of the proposed technique. Index Terms: Frequency estimation, Newton-type algorithm, single-phase voltage system, smart grid, and smart meters. I. INTRODUCTION The smart grid is an automated electric power system where both power and information flows will be bidirectional and the actions of all the users connected to it can be intelligently integrated for enhancing energy utilization and reducing wasted resources [1, 2]. The bidirectional communication network between the smart grid and metering devices allows collection and distribution of information to consumers, service providers, distribution network companies and utility companies [3]. The smart meters (SMs), which are a part of advanced metering infrastructures (AMIs), are the information gateways in the smart grid vision realization [4]. The SMs can provide time-based pricing and energy consumption data of a whole house [5, 6]. The SMs can also be used for non-intrusive load monitoring (NILM) which can decompose the energy consumption data into individual load level [7-11]. This information helps the consumers to make sound energy saving decisions and also to participate in utility demand response programs [12, 13]. The grid monitoring is one of the features of the SMs [14-20]. This feature enables to share their cost with other applications such as power quality (PQ) monitoring. The utilities need to get advance warnings of the PQ problems, but special PQ analysers are too expensive to be used in large numbers in the distribution grid [14-16]. In this case, the SMs can be used in order to avoid using of a large number of expensive PQ analysers, thus reducing the cost of PQ monitoring [14-16]. The grid frequency is a fundamental parameter for PQ monitoring [19-21]. It is also an important operational parameter for distributed generation (DG) and microgrid. The grid frequency can be considerably affected when the power supplied by the DG is significant in comparison 1 / 17
with the rated power of the grid at the point of common coupling, thus may affect the stability of the grid [22-24]. For this reason, many international grid codes are introduced, where a range of frequency variation is specified within which the DG should stay connected with the grid while ensuring stable operation [25, 26]. The IEC standard 61727 describes that a photovoltaic system has to be disconnected from the grid when the grid frequency exceeds ±1 Hz of the rated frequency [27, 28]. In the case of a microgrid, the frequency is required to be monitored and controlled in order to maintain the active power balance [28]. The frequency control of a microgrid is also important during the transitions between grid-connected and islanding modes, where a high deviation of frequency can occur. The IEEE standard 1547 defines that the frequency of a microgrid cannot differ from the grid frequency more than 0.1% during the reconnection with the grid [28, 29]. The frequency estimation by using the SMs demands sparing some of the processing power and memory at the software implementation level since they will be installed once over their lifespan [14-16]. In this case, low bandwidth sensors can be used to reduce hardware costs and spare microprocessors’ memory [14-16]. Consequently, computationally efficient digital signal processing (DSP) techniques are required, which will need simple hardware implementations and will contribute to the economical realization of the smart grid vision for the SMs. The grid voltage fundamental frequency can be estimated by using various DSP techniques such as the discrete-Fourier Transform (DFT) [30-34], Kalman filter (KF) [35, 36], zero crossing detection (ZCD) [37, 38], phase-locked loop (PLL) [3942], frequency-locked loop (FLL) [43-45], finite-impulse-response (FIR) filter [28, 46-48], least-squares (LS) [49, 50] and Newton-type algorithm (NTA) [51-56]. The DFT is the basic technique for spectral analysis of a stationary waveform but shows spectral leakage property during non-periodic cases [30, 31]. The spectral leakage information can also be used to estimate the frequency [30]. However, a large size moving window is required to avoid the interference caused by lower order harmonics. In this case, a smart DFT can provide improved estimation of frequency, however, is not suitable for a high number of harmonics [31]. A recursive DFT can be used with the decomposition of single-phase system into orthogonal components (RDFT-OC) to estimate the frequency [32-34]. The use of high-order window based low-pass filter (LPF) may increase the computational burden of the RDFT-OC technique. The KF is a computationally demanding technique to provide instantaneous estimation of the frequency [35, 36]. The performance and stability of the KF also depend on the proper tuning of the parameters. The ZCD is a simple technique to estimate the frequency [37, 38]. However, half fundamental time period is required to update the estimation. The ZCD technique may also provide inaccurate results due to the presence of multiple zero crossings introduced by noise [37, 38]. The PLL and FLL are simple techniques to implement and can provide instantaneous estimation of the frequency [39, 40, 43]. A virtual orthogonal voltage system is required for the single-phase PLL and FLL, unlike the three-phase systems where the orthogonal voltage system is provided by the Clarke Transform [40, 43]. A trade-off between good dynamics and estimation accuracy is also required when tuning the parameters of the PLL and FLL [41, 42, 44]. The PLL also presents a large overshoot/undershoot in the frequency estimation during phase jumps under grid faults [57]. A frequency estimation technique relying on three consecutive samples of voltage waveform requires the implementation of computationally complex high-order FIR filter [28, 46]. A high-order FIR differentiation filter (DF) can also be used to estimate the frequency from the phase angle obtained by a demodulation method [47, 48]. The LS technique to estimate the frequency may suffer from matrix singularities and may also provide inaccurate results for a small size window [49, 50]. A nonlinear NTA or a hybrid technique based on NTA and LS (NTA-LS) can also be used to estimate the fundamental frequency [51-56]. The NTA has a good convergence property and the duration of convergence is no longer than the window size [51]. However, the computational effort of the NTA increases due to the consideration of DC offset as an estimation variable since it may be introduced by the measurement sensor, grid
2 / 17
faults, or may be intrinsically present in the grid voltage [53-56]. Moreover, the NTA requires matrix inversion and matrix multiplication operations, which are computationally demanding for real-time implementation. The objective of this paper is to propose a NTA technique based on a recursive DF (NTA-DF) for the estimation of singlephase grid voltage fundamental frequency. The proposed NTA-DF technique avoids matrix inversion operation, reduces the dimensions of the estimation variables, is computationally efficient and also shows less sensitivity to harmonics when compared with the NTA-LS one [56]. The NTA-DF technique can also reject the negative effects caused by DC offset, harmonics, notches and spikes. The rest of the paper is organized as follows. The NTA-DF technique is described in Section II. Section III contains the simulation performance of the NTA-DF technique. Real-time experimental performance comparison of the NTA-DF and NTALS techniques are presented in Section IV. Finally, the conclusions are summarized in Section V. II. PROPOSED FREQUENCY ESTIMATION TECHNIQUE The block diagram of the NTA-DF technique for single-phase grid voltage fundamental frequency estimation is shown in Fig. 1, where v is the grid voltage, n is the sampling instant, v1 is the fundamental voltage component, 1 (n) (n)nTs 1 is the instantaneous phase angle including initial phase angle (1 ) corresponding to fundamental angular frequency deviation (Δω=2πΔf), Δf is the fundamental frequency deviation, Ts is the sampling period, f0 is the nominal fundamental frequency and fˆ is the estimated value of actual fundamental frequency (f). As it can be seen, the DC offset is rejected from the grid voltage using a band-pass filter (BPF). The NTA is then used to obtain the phase angle, which is differentiated using the DF to obtain the frequency deviation and added with the nominal value to get the actual frequency.
v ( n)
DC Offset Rejection using BPF
v1 (n)
Frequency Phase Angle f (n) 1 ( n) Estimation Estimation using DF using NTA f
fˆ (n)
0
Fig. 1. Block diagram of the proposed single-phase grid voltage fundamental frequency estimation technique. A. DC Offset Rejection A second-order infinite-impulse-response (IIR) BPF, as given by (1), is used to reject the DC offset from the grid voltage, where fc is the centre frequency [42]. H1 z
0.5(1 z 2 ) 1 cos(2 f c Ts ) z 1
(1)
The Bode plot of H1(z) for fc=50 Hz and 1.6 kHz sampling frequency is shown in Fig. 2. As it can be noticed, the BPF can remove the DC offset from the grid voltage. It also gives unity amplitude and 0° phase shift at frequency fc. Moreover, it can attenuate high frequency disturbances present in the grid voltage. The implementation of the BPF is shown in Fig. 3. In the technique, the BPF is tuned at grid voltage nominal fundamental frequency i.e. fc=50 Hz. It introduces a leading/lagging phase delay when the actual frequency is smaller/higher than the nominal value, as can be seen from Fig. 2. When the frequency drift is constant, the phase delay produces zero steady-state error in the frequency estimation by differentiation operation. The estimated frequency contains an error due to the time-varying phase delay introduced by the BPF under continuous variation of frequency. However, the grid frequency varies slowly due to the large inertia of the rotating shafts
3 / 17
Magnitude (abs) Phase (deg)
1
f c =50
0.5
0 90 45 0 -45 -90 0 50 100
200
300 400 500 Frequency (Hz)
600
700
800
Fig. 2. Bode plot of the BPF, as given by (1).
In
0.5
Out
cos(2πf cTs )
z 2
z 1
Fig. 3. Implementation of the BPF, as given by (1). of power generators and the estimated frequency error is small, thus can be neglected. The fundamental voltage amplitude is also attenuated by the BPF due to the deviation of frequency. However, the attenuation of the fundamental voltage amplitude does not affect the frequency estimation, as it is estimated from the phase angle. The output of the BPF can be approximated by v1 n A1 n sin 0 nTs 1 n n
(2)
where A1 is the fundamental voltage amplitude, ω0=2πf0 is the nominal fundamental angular frequency and ε is a zero mean random noise. B. Phase Angle Estimation Based on the NTA [56], equation (2) can be expressed by v1 n p X n n
(3)
where p is the estimation function and Xn is the estimation vector, and are expressed by (4) and (5), respectively. p X n A1 n sin 0 nTs 1 n X n [ A1 n 1 n ]*
(4) (5)
where * denotes transpose operation. The estimation error of the NTA can be expressed by en p X n v1 n
(6)
An error vector is also defined as given by F X n en
en 1 021 *
(7)
where 02×1 is a 2×1 zeros vector. For the estimation vector Xn+1 at the (n+1) sampling instant, there is an unknown estimation correction vector (ΔXn) such that
4 / 17
F X n 1 F X n X n 021
(8)
where X n A1 n
1 n
*
The following linear relation can be obtained using the Taylor series expansion of F(Xn+ΔXn) in the close neighbourhood of Xn. F X n X n F X n J n X n
(9)
where Jn is a Jacobian matrix and can be defined as en A n 1 Jn en 1 A1 n 1
en
1 n an en 1 an 1 1 n 1
bn bn 1
(10)
where an sin 0 nTs 1 n bn A1 n cos 0 nTs 1 n
The following relation can be obtained from (8) and (9). J n X n F X n
(11)
Therefore, ΔXn can be obtained from (11) and is given by [56]
Based on the matrix properties
J
* n
Jn
1
X n J n* J n
and
J * n
J n1 J n*
1
1
J n* F X n
1
J n* = identity matrix,
(12)
J
* n
Jn
1
1 J n* can be simplified to J n .
Consequently, (12) can be expressed as X n J n1 F X n
bn 1 en bn en 1 1 an bn 1 an 1bn an en 1 an 1 en
(13)
Expression (13) helps to avoid matrix multiplication and inversion operations required for the NTA, thus reduces computational burden for real-time implementation. However, expression (13) has to satisfy the following condition. an bn 1 an 1bn 0
(14)
Based on assumption A1(n)=A1(n-1), the following condition is obtained from (14). A1 n sin (n)Ts 0
(15)
where ω=ω0+Δω is the actual fundamental angular frequency. Therefore, the proposed NTA can be used when A1 (n) 0. This condition is also obtained in [56] for removing the matrix singularities of the NTA. To avoid possible matrix singularities in
5 / 17
cases of abrupt changes,
J J * n
1
n
in (12) can be replaced by a scalar value when A1(n) is equal or close to zero [56]. The
optimum value of this scalar is 0.2 [56]. For this case, the estimation correction vector in the proposed NTA can be expressed by a e an 1 en 1 X n 0.2 n n bn en bn 1 en 1
(16)
X n 1 X n X n
(17)
Therefore, the estimation vector can be updated by
C. Frequency Estimation The fundamental angular frequency deviation can be estimated by using a differentiation operation as given by n
1 n 1 n 1
(18)
Ts
However, the frequency estimation using (18) is not suitable when the phase angle contains high frequency disturbances. Based on (18), Δω at the n, (n-1),···,(n-N/2+1) sampling instants can be obtained from a window size of N/2 samples of phase angle and is given by 1 n 1 n N /2
1 n 1 1 n N /2 1 N / 2 n 1 Ts N /2 1 n N /2+1 1 n N 1 N / 2 n N /2+1 Ts N /2 N / 2 n
Ts N /2
(19)
The average angular frequency at the n sampling instant over a window size, Tw=N·Ts, of N samples of phase angle can be obtained from (19) and is given by n
N / 2 n N / 2 n 1
N / 2 n N /2 1
N /2 4 1 n 1 n 1 N 2 Ts
(20) 1 n N /2 1 1 n N /2 + 1 n N /2 1 +
+ 1 n N 1
By replacing n with n-1, expression (20) can be written as n 1
4 1 n 1 1 n 2 N 2 Ts
1 n N /2 1 (n N /2 1)+ 1 (n N /2 2)+
+ 1 (n N )
(21)
The following relation is obtained by subtracting (21) from (20). n (n 1)+
4 1 n 2 1 n N /2 1 n N N 2 Ts
(22)
The above recursive expression can be used to estimate the time-varying fundamental frequency from the phase angle over a window size equal to Tw. However, irrespective of the window size, only three samples of phase angle are used for frequency estimation, thus the computational effort is constant. By replacing Δω with 2πΔf, the transfer function of (22) can be written as 6 / 17
H2 z
f z
1 z
2 N 2 Ts
1 2 z N / 2 z N 1 z 1
(23)
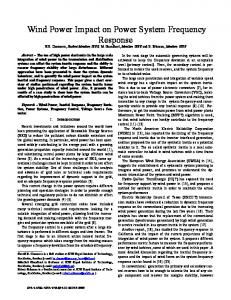
The magnitude responses of H2(z) and the ideal DF with respect to the frequency are shown in Fig. 4. As it can be seen, the magnitude response of the ideal DF is a ramp with a slope equal to one. However, the ideal DF cannot reject harmonics present in the instantaneous phase angle. Moreover, the ideal DF amplifies the harmonic signal with a gain equal to the corresponding harmonic frequency. On the other hand, H2(z) behaves like an ideal DF at low frequency, but with high frequency disturbance rejection capability. Even harmonics can be rejected from the estimated frequency when the window size is one fundamental period. Odd and even harmonics including the fundamental oscillations can also be removed when the window size is two fundamental periods. The DF can reject the oscillations at integer multiples of frequency of 2/Tw. The high frequency disturbance rejection capability is also improved when the window size is increased. However, if the window size is fixed and the frequency is time-varying, the estimated frequency may contain ripple under harmonics. In this case, a low-pass filter (LPF) can be cascaded with the DF for better attenuation of ripple from the estimated frequency at the expense of a slower dynamic response. A computationally efficient IIR LPF can be used for this purpose. Ideal DF Tw 20ms Tw 40ms Tw 60ms Tw 80ms
Magnitude (abs)
100 80 60 40 20 0 0
50
100
150
Frequency (Hz)
200
250
300
Fig. 4. Magnitude response of the transfer function H2(z), as given by (23). The implementation of the NTA-DF technique is shown in Fig. 5. As it can be seen, a 2nd order IIR BPF, NTA, DF and 2 nd order IIR LPF are cascaded in series to estimate the fundamental frequency. Expressions (13), (16) and (17) are implemented in the NTA block, as shown Fig. 5. In contrast with the NTA-DF, the NTA-LS technique presented in [56] uses a 6th order IIR BPF, NTA and LS. The NTA is used to obtain the DC offset, fundamental voltage amplitude and phase angle, where J n is a 3×3 matrix and ΔXn is obtained by matrix multiplication and inversion operations. A moving window LS principle is then applied to estimate the frequency from the phase angle. The computational burden of the LS is increased with the increasing size of the window and vice versa. When compared with the NTA-LS technique [56], the proposed NTA reduces matrix dimensions and avoids matrix inversion operation. The DF also requires less computational burden as compared to the LS. Therefore, based on a same sampling frequency, the NTA-DF technique requires less computational effort for real-time implementation on a
z 1
en 1
A1 (n)
p( X n )
sin
0 nTs
z N /2
2
z N /2
z 1
N 2Ts
2
2nd order v1 (n) IIR BPF
v ( n)
p( X n ) en
Newton Search Update
digital signal processor when compared with the NTA-LS one.
f (n)
2nd order IIR LPF
fˆ (n)
f0
1 ( n)
Differentiation Filter
Newton-Type Algorithm
Fig. 5. Proposed NTA-DF technique to estimate the single-phase grid voltage fundamental frequency. 7 / 17
D. Standard Requirements for Frequency Variation Several standards are reported in the technical literature which defines the deviation range of the grid voltage fundamental frequency. According to the European standard EN-50160 [58], under normal operating conditions the fundamental frequency shall be within a range of 50 Hz -6/+4 % (i.e. 47 Hz to 52 Hz) during 100 % of the time, for systems with synchronous connection to an interconnected system. The IEEE standard C37.118.1 [59] specifies the frequency ranges of 50 Hz ± 2 Hz and 50 Hz ± 5 Hz for P and M class phasor measurement units (PMUs), respectively. On the other hand, the IEC standard 61000-430 [60] defines that the testing fundamental frequency can be varied from 42.5 Hz to 57.5 Hz for the 50 Hz system. The IEC standard 61000-4-7 [61] considers ten fundamental cycles (0.2s) to complete the phasor estimation tasks for the 50 Hz system. Moreover, according to the IEC standard 61000-4-7, the maximum acceptable relative error of the fundamental frequency estimation is 0.03%, where the percentage of the relative error can be defined by (24) and
Relative Error (%)=
Actual Value - Estimated Value Actual Value
indicates absolute value.
×100%
(24)
III. SIMULATION RESULTS The simulation performance of the NTA-DF technique in MATLAB/Simulink is documented in this section. The sampling frequency is chosen as 1.6 kHz, since the minimum sampling frequency, to capture the microscopic features of the load signature for NILM in SMs, can be used as 1.2-2.0 kHz [10, 11]. The window size of the recursive DF and the cut-off frequency of a 2nd order IIR LPF are chosen as 40 ms and 15 Hz, respectively. The estimation of the fundamental frequency steps of ±7.5 Hz (50 Hz ±7.5 Hz) by using the NTA-DF technique is shown in Fig. 6, where the grid voltage contains 1.0 p.u. fundamental voltage amplitude and harmonics, as given in Table I. The harmonics, as given in Table I, introduce 14.58% total harmonic distortion (THD) and are used based on the definition for the second level test class in IEC standard 61000-4-13 [56, 62]. As it can be seen from Fig. 6, the settling time of the NTA-DF technique for frequency step estimation is around 3.5 fundamental cycles and is lower than 0.2 s, which is the maximum phasor estimation time specified by the IEC standard 61000-4-7. NTA - DF Actual
50
(a)
Fundamental Frequency (Hz)
49 48 47 46 45 44 43 42 1.98 58
2
2.02
2.04
2.06
2.08
2.1
2.12
2.14
2.16
(b)
Fundamental Frequency (Hz)
57 56
NTA - DF Actual
55 54 53 52 51 50 1.98
2
2.02
2.04
2.06
2.08
2.1
2.12
2.14
2.16
Time (s)
Fig. 6. Frequency step estimation under harmonics, as given in Table I. (a) -7.5 Hz (50 Hz to 42.5 Hz). (b) +7.5 Hz (50 Hz to 57.5 Hz).
8 / 17
TABLE I HARMONICS AS A PERCENTAGE OF FUNDAMENTAL COMPONENT BASED ON SECOND LEVEL TEST CLASS IN IEC STANDARD 61000-4-13 Harmonics 2
nd
3
3.0 %
rd
4
8.0 %
THD
th
5
1.5%
th
7
9.0 %
th
14.58%
7.5 %
The steady-state error of the estimated fundamental frequency by using the NTA-DF technique is shown in Fig. 7, where the grid voltage contains 1.0 p.u. fundamental voltage amplitude, harmonics, as given in Table I, and the fundamental frequency is varied from 42.5 Hz to 57.5 Hz. As it can be noticed, the NTA-DF technique can provide accurate estimation of nominal fundamental frequency. However, the estimation error increases as the deviation of fundamental frequency from its nominal value increases. Nevertheless, the steady-state relative error of the estimated fundamental frequency range of 42.5 Hz to 57.5 Hz under 14.58% THD remains inside the acceptable range (less than 0.03%) specified by the IEC standard 61000-4-7. 0.03
Error (Hz) Relative Error (%)
0.01
0.02
0.005
0.01
0 42
44
46
48
50
52
54
Relative Frequency Error (%)
Frequency Error (Hz)
0.015
0 58
56
Fundamental Frequency (Hz)
Fig. 7. Frequency estimation error under harmonics, as given in Table I. The performance of the NTA-DF technique under Gaussian noise is shown in Fig. 8(b). In this case, the Gaussian noise, as shown in Fig. 8(a), with mean=0 and variance=0.001 is added with the grid voltage fundamental component with 1.0 p.u. amplitude. As it can be seen from Fig. 8(b), the performance of the technique is affected by this type of noise and presents ripple in the estimation of fundamental frequency. The low frequencies and interharmonic components of the noise affect the frequency estimation as the DF is tuned for rejecting integer multiples of 50 Hz. However, the IIR LPF, as shown in Fig. 5, can reject the interharmonic at higher frequencies, but not the low frequency components present in the estimated fundamental
Gaussian Noise (p.u.)
(a)
frequency. 0.1 0.05 0 -0.05 -0.1
(b) Fundamental Frequency (Hz)
2 50.2
2.05
2.1
2.15
2.2
2.25
2.3
2.35
2.4
NTA - DF Actual
50.1 50 49.9 49.8 2
2.05
2.1
2.15
2.2
2.25
2.3
2.35
2.4
Time (s)
Fig. 8. Performance of the proposed technique under Gaussian noise condition. (a) Gaussian noise with mean=0 and variance=0.001. (b) Fundamental frequency. 9 / 17
IV. REAL-TIME EXPERIMENTAL RESULTS The performance of the NTA-DF is compared with the NTA-LS technique on a real-time experimental setup. The parameters of both techniques are given in Table II. The settling time of the NTA-LS technique is around 13 fundamental cycles as reported in [56], however, is tuned in this paper to provide similar dynamics when compared with the NTA-DF one. The laboratory setup for experiments, as shown in Fig. 9, consists of hardware and software parts. The hardware part contains a programmable AC power supply, a voltage sensor, a dSPACE1103 (DS1103) control board and a personal computer (PC). The programmable AC power supply is used to generate the single-phase grid voltage (vLN, where the subscript LN indicates line-toneutral) under different conditions such as DC offset, harmonics, frequency drifts, amplitude variations, notches and spikes. The voltage sensor measures the generated grid voltage and sends it to the 16 bit analog-to-digital converter of the DS1103 control board. On the other hand, the software part of the experimental setup consists of MATLAB/Simulink, DS1103 Real-Time Interface and Control Desk Interface. The Simulink models of the NTA-DF and NTA-LS techniques are compiled and uploaded to the DS1103 control board using the automatic code generation. The Control Desk Interface running on the PC is used to set the parameters in real-time and also to monitor the estimated values. TABLE II PARAMETERS OF THE NTA-DF AND NTA-LS TECHNIQUES NTA-DF
NTA-LS
IIR BPF: fc =50 Hz and order=2. DF:
IIR BPF: fc =50 Hz, order = 6 and
Tw =40 ms. IIR LPF: order=2 and cut-
bandwidth = 20 Hz. LS: Tw = 40 ms.
off frequency=15 Hz. Ts=1/1600 s.
Ts=1/1600 s.
~ Electrical Grid
vLN
∕∕∕ Programmable Power Supply
Voltage Sensor
dSPACE 1103
Personal Computer
Fig. 9. Laboratory setup for real-time experiment. The performance of the NTA-DF and NTA-LS techniques is compared under following real-time case studies: i.
Steady-state with DC offset and harmonics (Case-1)
ii.
Frequency step and harmonics (Case-2)
iii.
Frequency sweep and harmonics (Case-3)
iv.
Voltage sag and harmonics (Case-4)
v.
Voltage flicker and harmonics (Case-5)
vi.
Phase jump and harmonics (Case-6)
vii.
Notches, spikes and harmonics (Case-7)
The grid voltage fundamental component in all the above case studies is distorted by harmonics, as given in Table I. Case-1: Steady-State with DC Offset and Harmonics A steady-state grid voltage waveform is distorted by 5% DC offset and harmonics, as given in Table I. The grid voltage waveform and the steady-state estimation of the fundamental frequency using the NAT-DF and NTA-LS techniques are shown
10 / 17
in Fig. 10. As it can be noticed, both techniques can provide accurate estimation of fundamental frequency under DC offset and harmonics in steady-state operation. (a) Grid Voltage Waveform (p.u.)
1 0.5 0 -0.5 -1
(b) Fundamental Frequency (Hz)
2 50.01
2.01
2.02
2.03
2.04
NTA - DF
2.05
2.06 Actual
NTA - LS
50.005 50 49.995 49.99 2
2.01
2.02
2.03
2.04
2.05
2.06
Time (s)
Fig. 10. Case-1: Steady-state with DC offset (5%) and harmonics. (a) Grid voltage waveform. (b) Actual and estimated fundamental frequency. Case-2: Frequency Step and Harmonics In this case, the performance of the NTA-DF and NTA-LS techniques is compared for a worst case scenario of grid frequency variation. A frequency step of -7.5 Hz is considered in a grid voltage distorted by harmonics, as given in Table I. Fig. 11 shows the estimation of the frequency step by using the NTA-DF and NTA-LS techniques. As it can be noticed, the NTA-DF technique takes around 3.5 fundamental cycles as a settling time for tracking the frequency step and is similar to the simulation result presented in Fig. 6. Moreover, the NTA-DF technique presents less ripple at steady-state in the estimation of 42.5 Hz when compared with the NTA-LS one, as can be seen from the magnified plot in Fig. 11. The steady-state relative error of the estimated frequency of 42.5 Hz obtained by using the NTA-DF and NTA-LS techniques are 0.0242% and 0.1045%, respectively. As it can be seen, the proposed NTA-DF technique meets the relative error criteria (less than 0.03%) specified by the IEC standard 61000-4-7. NTA - DF
50
Fundamental Frequency (Hz)
49
Actual
NTA - LS
42.52
48 42.5
47 46
42.48 2.96
45
2.98
3
44 43 42 2.4
2.5
2.6
2.7
Time (s)
2.8
2.9
3
Fig. 11. Case-2: Frequency step (50 Hz to 42.5 Hz) and harmonics. Case-3: Frequency Sweep and Harmonics For this case, the grid voltage contains frequency sweep and harmonics, as given in Table I. The frequency sweep is performed at +10 Hz/s up to 55 Hz. The estimation of frequency sweep by using the NTA-DF and NTA-LS techniques is shown in Fig. 12. As it can be noticed, both techniques can track the frequency sweep. However, it can be noticed from the magnified
11 / 17
plot in Fig. 12 that the NTA-DF technique shows less sensitivity to harmonics at steady-state for the estimation of 55 Hz as compared to the NTA-LS one. The steady-state relative error of the estimated fundamental frequency of 55 Hz obtained by using the NTA-DF and NTA-LS techniques are 0.0045% and 0.0331%, respectively. As it can be noticed, the NTA-DF technique can estimate the fundamental frequency of 55 Hz with a relative error less than 0.03%, which is the maximum accepted error threshold specified by the IEC standard 61000-4-7. 56
NTA - DF
Actual
NTA - LS
Fundamental Frequency (Hz)
55 54 53
55.01
52
55
51
54.99 8.46
8.48
8.5
50 7.7
7.8
7.9
8
8.1
8.2
8.3
8.4
8.5
Time (s)
Fig. 12. Case-3: Frequency sweep (+10 Hz/s: 50 Hz to 55 Hz) and harmonics. Case-4: Voltage Sag and Harmonics A grid voltage waveform containing 50% voltage sag and harmonics, as given in Table I, is shown in Fig. 13(a). The performance of the NTA-DF and NTA-LS techniques during voltage sag is shown in Fig. 13(b). As it can be noticed, both techniques are affected by voltage sag. However, the NTA-DF technique presents less undershoot/overshoot and converges
(a) Grid Voltage Waveform (p.u.)
more quickly to the actual value during voltage sag when compared with the NTA-LS one. 1 0.5 0 -0.5 -1
(b) Fundamental Frequency (Hz)
2.5 51
2.55
2.6
2.65
2.7
2.75
2.8
NTA - DF
2.85
2.9
NTA - LS
2.95
3
Actual
50.5 50 49.5 49 2.5
2.55
2.6
2.65
2.7
2.75
2.8
2.85
2.9
2.95
3
Time (s)
Fig. 13. Case-4: Voltage sag (50%) and harmonics. (a) Grid voltage waveform. (b) Actual and estimated fundamental frequency. Case-5: Voltage Flicker and Harmonics In this case, the grid voltage is distorted by 2.5 Hz and ±0.1p.u. triangular voltage flicker and harmonics, as given in Table I. The distorted grid voltage waveform is shown in Fig. 14(a). The fundamental frequency estimation by using the NTA-DF and NTA-LS techniques under voltage flicker and harmonics is presented in Fig. 14(b). As it can be observed, the performance of both techniques is affected by voltage flicker. However, the proposed NTA-DF technique is less affected as compared to the NTA-LS one. In this case, the maximum relative error of the estimated fundamental frequency using the NTA-DF and NTA-LS techniques are 0.0332% and 0.1574%, respectively. It has also been observed from other tests using different voltage flicker
12 / 17
frequencies that the maximum relative error of the estimated fundamental frequency using both techniques increases with the
(a) Grid Voltage Waveform (p.u.)
increase of the voltage flicker frequency and vice versa. 1 0.5 0 -0.5 -1
(b) Fundamental Frequency (Hz)
2.2 50.1
2.3
2.4
2.5
2.6
2.7
2.8
2.9
3
3.1
3.2
NTA - DF NTA - LS Actual
50.05 50 49.95 49.9 2.2
2.3
2.4
2.5
2.6
2.7
2.8
2.9
3
3.1
3.2
Time (s)
Fig. 14. Case-5: Voltage flicker (±10%) and harmonics. (a) Grid voltage waveform. (b) Actual and estimated fundamental frequency. Case-6: Phase Jump and Harmonics The grid voltage waveform, as shown in Fig. 15(a), contains a -30° phase jump and harmonics, as given in Table I. The fundamental frequency estimation is shown in Fig. 15(b). As it can be seen, the performance of both NTA-DF and NTA-LS
(a) Grid Voltage Waveform (p.u.)
techniques is affected by phase jump. 1 0.5 0 -0.5 -1
(b) Fundamental Frequency (Hz)
3 51
3.05
3.1
3.15
3.2
3.25
3.3
3.35
3.4
50 NTA - DF NTA - LS Actual
49 48 47 3
3.05
3.1
3.15
3.2
3.25
3.3
3.35
3.4
Time (s)
Fig. 15. Case-6: Phase jump (-30°) and harmonics. (a) Grid voltage waveform. (b) Actual and estimated fundamental frequency. Case-7: Notches, Spikes and Harmonics The grid voltage waveform, as shown in Fig. 16(a), contains notches, spikes and harmonics, as given in Table I. The estimation of fundamental frequency by using the NTA-DF and NTA-LS techniques is shown in Fig. 16(b). As it can be noticed, both techniques can provide accurate estimation of fundamental frequency during voltage notches and spikes. Computational Time Turnaround time is one of the measures for computational performance comparison and it can be defined as the time delay between the submission of a task for processing and the return of the complete output. In the DS1103 control board platform, the NTA-DF and NTA-LS techniques take 2.49 μs and 3.45 μs turnaround time, respectively, for providing the real-time frequency estimation. Thus, the NTA-DF technique takes 27.83% less time when compared with the NTA-LS one. 13 / 17
(a) Grid Voltage Waveform (p.u.)
1 0.5 0 -0.5 -1
(b) Fundamental Frequency (Hz)
1 50.01
1.01
1.02
1.03
1.04
1.05
1.06
NTA - DF
1.07
1.08
NTA - LS
1.09
1.1
Actual
50.005 50 49.995 49.99 1
1.01
1.02
1.03
1.04
1.05
1.06
1.07
1.08
1.09
1.1
Time (s)
Fig. 16. Case-7: Notches, spikes and harmonics. (a) Grid voltage waveform. (b) Actual and estimated fundamental frequency. V. CONCLUSIONS A single-phase grid voltage fundamental frequency estimation technique has been proposed in this paper. The technique relies on a Newton-type algorithm and a recursive differentiation filter. The proposed technique reduces matrix dimensions, avoids matrix inversion operation, is computationally efficient and also shows less sensitivity to harmonics when compared with the Newton-type algorithm and least-squares technique. The technique can reject the negative effects caused by DC offset, harmonics, notches and spikes. It can also provide the estimation of a wide range of frequency variation and also meets the estimation error criteria specified by the standard. The presented experimental results have confirmed the effectiveness of the proposed technique for real-time frequency estimation. REFERENCES [1]
S. M. Amin and B. F. Wollenberg, "Toward a smart grid: Power delivery for the 21st century," IEEE Power and Energy Mag., vol. 3, no. 5, pp. 34-41, Sept./Oct. 2005.
[2]
F. Rahimi and A. Ipakchi, "Demand response as a market resource under the smart grid paradigm," IEEE Trans. Smart Grid, vol. 1, no. 1, pp. 82-88, June 2010.
[3]
L. Husheng, G. Shuping, L. Lifeng, H. Zhu, R. C. Qiu, and Y. Depeng, "Efficient and secure wireless communications for advanced metering infrastructure in smart grids," IEEE Trans. Smart Grid, vol. 3, no. 3, pp. 1540-1551, Sept. 2012.
[4]
M. A. Rahman, E. Al-shaer, and P. Bera, "A noninvasive threat analyzer for advanced metering infrastructure in smart grid," IEEE Trans. Smart Grid, vol. 4, no. 1, pp. 273-287, Mar. 2013.
[5]
A. Albert and R. Rajagopal, "Smart meter driven segmentation: What your consumption says about you," IEEE Trans. Power Sys., vol. 28, no. 4, pp. 4019-4030, Nov. 2013.
[6]
P. Seunghyun, K. Hanjoo, M. Hichan, H. Jun, and Y. Sungroh, "Concurrent simulation platform for energy-aware smart metering systems," IEEE Trans. Consumer Elect., vol. 56, no. 3, pp. 1918-1926, Aug. 2010.
[7]
D. Ming, P. C. M. Meira, X. Wilsun, and W. Freitas, "An event window based load monitoring technique for smart meters," IEEE Trans. Smart Grid, vol. 3, no. 2, pp. 787-796, June 2012.
[8]
B. Stephen and S. J. Galloway, "Domestic load characterization through smart meter advance stratification," IEEE Trans. Smart Grid, vol. 3, no. 3, pp. 1571-1572, Sept. 2012.
[9]
M. Dong, P. C. M. Meira, W. Xu, and C. Y. Chung, "Non-intrusive signature extraction for major residential loads," IEEE Trans. Smart Grid, vol. 4, no. 3, pp. 1421-1430, Sept. 2013.
14 / 17
[10] F. Sultanem, "Using appliance signatures for monitoring residential loads at meter panel level," IEEE Trans. Power Del., vol. 6, no. 4, pp. 1380-1385, Oct. 1991. [11] M. Zeifman and K. Roth, "Nonintrusive appliance load monitoring: Review and outlook," IEEE Trans. Consumer Elect., vol. 57, no. 1, pp. 76-84, Feb. 2011. [12] W. Chen, X. Wang, J. Petersen, R. Tyagi, and J. Black, "Optimal scheduling of demand response events for electric utilities," IEEE Trans. Smart Grid, vol. 4, no. 4, pp. 2309-2319, Dec. 2013. [13] Z. Baharlouei, M. Hashemi, H. Narimani, and H. Mohsenian-Rad, "Achieving optimality and fairness in autonomous demand response: Benchmarks and billing mechanisms," IEEE Trans. Smart Grid, vol. 4, no. 2, pp. 968-975, June 2013. [14] P. Koponen, R. Seesvuori, and R. Bostman, "Adding power quality monitoring to a smart kWh meter," IET Power Engg. Journal, vol. 10, no. 4, pp. 159-163, Aug. 1996. [15] H. Saari, P. Koponen, E. Tahvanainen, and T. Lindholm, "Remote reading and data management system for kWh meters with power quality monitoring," IET Power Engg. Journal, vol. 10, no. 4, pp. 164-168, Aug. 1996. [16] I. Sadinezhad and V. G. Agelidis, "Slow sampling on-line harmonics/interharmonics estimation technique for smart meters," Elsevier Electric Power Sys. Resear., vol. 81, pp. 1643–1653, 2011. [17] IEC Smart Grid Standardization Roadmap, SMB Smart Grid Strategic Group (SG3), June 2010. [18] K. D. McBee and M. G. Simoes, "Utilizing a smart grid monitoring system to improve voltage quality of customers," IEEE Trans. Smart Grid, vol. 3, no. 2, pp. 738-743, June 2012. [19] Y. Xia, S. C. Douglas, and D. P. Mandic, "Adaptive frequency estimation in smart grid applications: Exploiting noncircularity and widely linear adaptive estimators," IEEE Signal Proc. Mag., vol. 29, no. 5, pp. 44-54, Sept. 2012. [20] K. Samarakoon, J. Ekanayake, and N. Jenkins, "Investigation of domestic load control to provide primary frequency response using smart meters," IEEE Trans. Smart Grid, vol. 3, no. 1, pp. 282-292, Mar. 2012. [21] S. T. Mak, "Smart meters serving as synchro-sensors for Smart Distribution Grid applications," in Proc. IEEE Power & Energy Soc. Gen. Meet., 2011, pp. 1-3. [22] S. Eftekharnejad, V. Vittal, G. T. Heydt, B. Keel, and J. Loehr, "Impact of increased penetration of photovoltaic generation on power systems," IEEE Trans. Power Sys., vol. 28, no. 2, pp. 893-901, May 2013. [23] P. J. Douglass, R. Garcia-Valle, P. Nyeng, J. Ostergaard, and M. Togeby, "Smart demand for frequency regulation: Experimental results," IEEE Trans. Smart Grid, vol. 4, no. 3, pp. 1713-1720, Sept. 2013. [24] R. Teodorescu, M. Liserre, and P. Rodríguez, "Grid converters for photovoltaic and wind power systems," John Wiley & Sons, Ltd, Chichester, UK, 2011. [25] S.-T. Kim, B.-K. Kang, S.-H. Bae, and J.-W. Park, "Application of SMES and grid code compliance to wind/photovoltaic generation system," IEEE Trans. Applied Supercond., vol. 23, no. 3, June 2013. [26] Y. Bae, T.-K. Vu, and R.-Y. Kim, "Implemental control strategy for grid stabilization of grid-connected PV system based on German grid code in symmetrical low-to-medium voltage network," IEEE Trans. Energy Conv., vol. 28, no. 3, pp. 619631, Sept. 2013. [27] IEC Standard 61727, "Photovoltaic (PV) systems-Characteristics of the utility interface," 2004. [28] P. Roncero-Sanchez, X. del Toro Garcia, A. P. Torres, and V. Feliu, "Robust frequency-estimation method for distorted and imbalanced three-phase systems using discrete filters," IEEE Trans. Power Elect., vol. 26, no. 4, pp. 1089-1101, Apr. 2011. [29] IEEE Standard 1547, "IEEE standard for interconnecting distributed resources with electric power systems," 2003.
15 / 17
[30] E. Lavopa, P. Zanchetta, M. Sumner, and F. Cupertino, "Real-time estimation of fundamental frequency and harmonics for active shunt power filters in aircraft electrical systems," IEEE Trans. Ind. Elect., vol. 56, no. 8, pp. 2875-2884, Aug. 2009. [31] J.-Z. Yang and C.-W. Liu, "A precise calculation of power system frequency," IEEE Trans. Power Del., vol. 16, no. 3, pp. 361-366, July 2001. [32] I. Sadinezhad and V. G. Agelidis, "Frequency adaptive least-squares-Kalman technique for real-time voltage envelope and flicker estimation," IEEE Trans. Ind. Elect., vol. 59, no. 8, pp. 3330-3341, Aug. 2012. [33] I. Kamwa, M. Leclerc, and D. McNabb, "Performance of demodulation-based frequency measurement algorithms used in typical PMUs," IEEE Trans. Power Del., vol. 19, no. 2, pp. 505-514, Apr. 2004. [34] I. Kamwa, S. R. Samantaray, and G. Joos, "Wide frequency range adaptive phasor and frequency PMU algorithms," IEEE Trans. Smart Grid, vol. 5, no. 2, pp. 569-579, Mar. 2014. [35] P. K. Dash, R. K. Jena, G. Panda, and A. Routray, "An extended complex Kalman filter for frequency measurement of distorted signals," IEEE Trans. Instrum. Measur., vol. 49, no. 4, pp. 746-753, Aug. 2000. [36] C.-H. Huang, C.-H. Lee, K.-J. Shih, and Y.-J. Wang, "A robust technique for frequency estimation of distorted signals in power systems," IEEE Trans. Instrum. Meas., vol. 59, no. 8, pp. 2026-2036, Aug. 2010. [37] O. Vainio, S. J. Ovaska, and M. Polla, "Adaptive filtering using multiplicative general parameters for zero-crossing detection," IEEE Trans. Ind. Elect., vol. 50, no. 6, pp. 1340-1342, Dec. 2003. [38] V. Friedman, "A zero crossing algorithm for the estimation of the frequency of a single sinusoid in white noise," IEEE Trans. Signal Proc., vol. 42, no. 6, pp. 1565-1569, June 1994. [39] I. Carugati, P. Donato, S. Maestri, D. Carrica, and M. Benedetti, "Frequency adaptive PLL for polluted single-phase grids," IEEE Trans. Power Elect., vol. 27, no. 5, pp. 2396-2404, May 2012. [40] M. Ciobotaru, V. G. Agelidis, R. Teodorescu, and F. Blaabjerg, "Accurate and less-disturbing active antiislanding method based on PLL for grid-connected converters," IEEE Trans. Power Elect., vol. 25, no. 6, pp. 1576-1584, June 2010. [41] M. Karimi-Ghartemani, S. A. Khajehoddin, P. K. Jain, and A. Bakhshai, "Derivation and design of in-loop filters in phaselocked loop systems," IEEE Trans. Instrum. Meas., vol. 61, no. 4, pp. 930-940, Apr. 2012. [42] J. R. de Carvalho, C. A. Duque, M. V. Ribeiro, A. S. Cerqueira, T. L. Baldwin, and P. F. Ribeiro, "A PLL-based multirate structure for time-varying power systems harmonic/interharmonic estimation," IEEE Trans. Power Del., vol. 24, no. 4, pp. 1789-1800, Oct. 2009. [43] P. Rodriguez, A. Luna, M. Ciobotaru, R. Teodorescu, and F. Blaabjerg, "Advanced grid synchronization system for power converters under unbalanced and distorted operating conditions," in Proc. 32nd Ann. Conf. IEEE Ind. Elect. (IECON), 2006, pp. 5173-5178. [44] P. Rodriguez, A. Luna, I. Candela, R. Mujal, R. Teodorescu, and F. Blaabjerg, "Multiresonant frequency-locked loop for grid synchronization of power converters under distorted grid conditions," IEEE Trans. Ind. Elect., vol. 58, no. 1, pp. 127138, Jan. 2011. [45] P. Rodriguez, A. Luna, R. S. Munoz-Aguilar, I. Etxeberria-Otadui, R. Teodorescu, and F. Blaabjerg, "A stationary reference frame grid synchronization system for three-phase grid-connected power converters under adverse grid conditions," IEEE Trans. Power Elect., vol. 27, no. 1, pp. 99-112, Jan. 2012. [46] M. D. Kusljevic, J. J. Tomic, and L. D. Jovanovic, "Frequency estimation of three-phase power system using weightedleast-square algorithm and adaptive FIR filtering," IEEE Trans. Instrum. Measur., vol. 59, no. 2, pp. 322-329, Feb. 2010.
16 / 17
[47] R. Zivanovic, "An adaptive differentiation filter for tracking instantaneous frequency in power systems," IEEE Trans. Power Del., vol. 22, no. 2, pp. 765-771, Apr. 2007. [48] M. S. Reza, M. Ciobotaru, and V. G. Agelidis, "Robust estimation of real-time single-phase grid voltage frequency under distorted grid conditions," in Proc. of IEEE ECCE Asia Down Under, 2013, pp. 948-954. [49] R. Chudamani, K. Vasudevan, and C. S. Ramalingam, "Real-time estimation of power system frequency using nonlinear least squares," IEEE Trans. Power Del., vol. 24, no. 3, pp. 1021-1028, July 2009. [50] A. Abdollahi and F. Matinfar, "Frequency estimation: A least-squares new approach," IEEE Trans. Power Del., vol. 26, no. 2, pp. 790-798, Apr. 2011. [51] V. V. Terzija and D. Markovic, "Symmetrical components estimation through nonrecursive Newton-type numerical algorithm," IEEE Trans. Power Del., vol. 18, no. 2, pp. 359-363, Apr. 2003. [52] V. V. Terzija and M. Akke, "Synchronous and asynchronous generators frequency and harmonics behavior after a sudden load rejection," IEEE Trans. Power Systems, vol. 18, no. 2, pp. 730-736, May 2003. [53] V. V. Terzija, N. B. Djuric, and B. D. Kovacevic, "Voltage phasor and local system frequency estimation using Newton type algorithm," IEEE Trans. Power Del., vol. 9, no. 3, pp. 1368-1374, July 1994. [54] V. Terzija and V. Stanojevic, "Power quality indicators estimation using robust Newton-type algorithm," IEE Proc. Gen, Transm. Dist., vol. 151, no. 4, pp. 477-485, 2004. [55] V. V. Terzija, V. Stanojevic, M. Popov, and L. Van der Sluis, "Digital metering of power components according to IEEE standard 1459-2000 using the Newton-type algorithm," IEEE Trans. Instrum. Measur., vol. 56, no. 6, pp. 2717-2724, Dec. 2007. [56] I. Sadinezhad and V. G. Agelidis, "Slow sampling online optimization approach to estimate power system frequency," IEEE Trans. Smart Grid, vol. 2, no. 2, pp. 265-277, June 2011. [57] M. K. Ghartemani, S. A. Khajehoddin, P. K. Jain, and A. Bakhshai, "Problems of startup and phase jumps in PLL systems," IEEE Trans. Power Elect., vol. 27, no. 4, pp. 1830-1838, Apr. 2012. [58] European Standard EN-50160, "Voltage characteristics of electricity supplied by public distribution systems," 1999. [59] IEEE Standard C37.118.1, "IEEE standard for synchrophasor measurements for power systems," 2011. [60] IEC Standard 61000-4-30, "Testing and measurement techniques—Power quality measurement methods," 2003. [61] IEC Standard 61000-4-7, "Testing and measurement techniques-General guide on harmonics and interharmonics measurements and instrumentation, for power supply systems and equipment connected thereto," 2002. [62] IEC Standard 61000-4-13, "Testing and measurement techniques-Harmonics and interharmonics including mains signaling at AC power port, low frequency immunity test," 2002.
17 / 17