Greenhouse Gas Calculator Development . .... GHG Calculator Development . ..... unreliable, and the default fertiliser application quantities are not automatically.
Project Report No. 435 Part 1 July 2008 Price: £4.50
Facilitating carbon (GHG) accreditation schemes for biofuels: feedstock production by
Jeremy Woods 1, Gareth Brown 2, Alfred Gathorne-Hardy2, Roger Sylvester-Bradley3, Daniel Kindred3 and Nigel Mortimer4
1
2
Porter Alliance, Imperial College London, Prince Consort Road, South Kensington Campus London SW7 2BP
Centre for Environmental Policy, Imperial College London, Prince Consort Road, South Kensington Campus London SW7 2BP 3
ADAS Boxworth, Boxworth, Cambridge, CB23 4NN
4
North Energy Associates, Watson’s Chambers, 5-15 Market Place, Sheffield S1 2GH HGCA Project No. MD-0607-0033
The Home-Grown Cereals Authority (HGCA) has provided funding for this project but has not conducted the research or written this report. While the authors have worked on the best information available to them, neither HGCA nor the authors shall in any event be liable for any loss, damage or injury howsoever suffered directly or indirectly in relation to the report or the research on which it is based.
Reference herein to trade names and proprietary products without stating that they are protected does not imply that they may be regarded as unprotected and thus free for general use. No endorsement of named products is intended nor is it any criticism implied of other alternative, but unnamed, products.
Table of Contents Executive Summary .................................................................................................................. i 1
Introduction....................................................................................................................... 1
2
Greenhouse Gas Calculator Development....................................................................... 3
3
4
5
2.1
Basic approach and methodology ............................................................................ 3
2.2
Underlying emission factors ..................................................................................... 5
2.3
Wheat-to-ethanol Calculations ................................................................................. 6
2.4
Oilseed rape-to-biodiesel (rape methyl ester) Calculations .................................... 10
Developing Farm Audit Sheets....................................................................................... 16 3.1
Overview of approach ............................................................................................ 16
3.2
Audit Questions ...................................................................................................... 17
3.3
Results ................................................................................................................... 21
3.4
Conclusions ............................................................................................................ 25
Potential future developments ........................................................................................ 26 4.1
Crop breeding ......................................................................................................... 26
4.2
Premium schemes .................................................................................................. 28
Conclusions and Future Research Requirements.......................................................... 31 5.1
Main conclusions .................................................................................................... 32
5.2
GHG Calculator Development ................................................................................ 33
5.3
Farm Audit Developments ...................................................................................... 34
5.4
Reducing and managing uncertainties ................................................................... 35
5.5
Identified research requirements ............................................................................ 37
5.6
Conclusions on future developments ..................................................................... 38
References ………………………………………………………………………………………......39
Executive Summary Agriculture and transport contribute around one third of global greenhouse gas emissions and both their share and gross emissions continues to grow. The growing share of emissions from transport coupled to its increasing dependence on oil, have provided powerful drivers for biofuel production growth over the last few years. However, biofuels remain contentious, not least because the GHG-abatement benefits are widely contested. The research reported here shows that very substantial reductions in greenhouse gas (GHG) emissions are possible from socalled conventional bioethanol and biodiesel fuels manufactured from UK-produced feedstocks (wheat grain and oil seed rape) when substituting for mineral petrol and diesel. Due to land constraints in the UK, providing a substantial share of the UK’s transport fuels from indigenously supplied biofuels may not be possible. However, UK farmers can demonstrate how efficient, modern agriculture can deliver very low GHG emitting biofuels enabling them to be competitive in an emerging global market that rewards such low GHG options and satisfying Renewable Transport Fuel Obligation (RTFO) requirements. Furthermore these standards could serve as a template for crop production in general. The work outlined below has also shown that it is possible to develop and apply the robust and transparent monitoring and calculation methodologies needed to derive credible GHG balances for those biofuels. An integrated bioethanol and biodiesel GHG calculator has been produced using standardised methodologies and this is now being coupled with on-farm audits. The aim is to provide estimates of GHG emissions for individual batches of UK-biofuel feedstocks and to enable farmers to understand and manage those factors which are most sensitive to the GHG emissions. Although further work is required, particularly on indirect impacts, it is clear that the provision of the relevant data by farmers is not overly burdensome or costly and that it can be used to provide sufficiently accurate information to reflect local conditions and management practices. Based on the evidence-base derived from the farm audits and detailed life-cycle assessment studies from which the GHG calculator has been developed, we calculate that it is possible to produce bioethanol and biodiesel in ways that can result in substantially lower GHG emissions than their fossil fuel surrogates: ⎯ For wheat to ethanol, reductions of between 10 and 95% are calculated using standard UK-average agricultural factors and a range of conversion plant configuration options (including those powered by gas-fired and/or straw and co-product-fired combined heat and power (CHP) systems). ⎯ For rape to biodiesel, reductions of between 18 and 39% are calculated. Note that the options considered here do not include biodiesel plants powered by CHP. The GHG calculator highlights the main areas that farmers need to focus on to deliver low carbon feedstocks for biofuel production, in particular the need to manage nitrogen fertiliser inputs by optimising requirements per unit of output whilst maintaining high yields. Thus:
i
⎯ Feedstock production accounts for between 50 to over 80% of the total GHG emissions of the biofuel supply chains covered, and is therefore the dominant source of emissions in a biofuel supply chain. ⎯ For biodiesel from rape, nitrogen inputs account for over 90% of the on-farm GHG emissions. For ethanol from wheat, nitrogen use accounts for 80% of the on-farm emissions; nitrous oxide (N2O) alone accounts for over 60% of those farm-based GHG emissions. Nitrogen management choices for farmers include sourcing fertiliser from manufacturing plants with nitrous oxide abatement which can reduce feedstockbased emissions by 25-30% (for ammonium nitrate) and selection of varieties which have lower nitrogen requirements and are inherently more suited to biofuel production e.g. low protein / high starch wheat. In contrast to nitrogen fertiliser-related emissions, on-farm fuel, pesticide and seed supply-based emissions account for about 20% of the total farm-emissions and some gains could be made here, for instance, by minimising cultivation operations. Other areas which could have a significant impact on farm emissions are land–use history, soil type and drying operations. It is important to note that substantial uncertainties exist in calculating the GHG emissions arising from land-based biological production systems. For biofuels, these uncertainties result from both the complexity of potential supply chains and in the scientific understanding of some of the mechanisms that result in the production of greenhouse gases. This uncertainty is not unique to biofuel production and applies to all forms of land use including for food, materials and timber production. A major report, explaining and clarifying the nature and extent of the uncertainties surrounding the calculation of biofuel GHG balances has been produced in parallel to this report (Kindred et al, 2008). Much of the reduction potential in GHG emissions from UK-biofuels results from the way energy is produced and used in the biofuel conversion plants. The most substantial reductions in emissions result where co-products are used to produce heat and surplus electricity. However, much work is still to be done to clarify the GHG impacts of alternative uses of co- and by-products, particularly when used as animal feed. Despite this uncertainty, as energy use and GHG emission efficiencies are raised in the conversion plants, pressure will mount on farmers to deliver lower GHG-emission feedstocks. Agriculture, therefore, has a critical role to play in ensuring that biofuels can provide a robust tool for climate change mitigation. However, to be credible, there is an urgent need for simple, practical and verifiable tools that allow farmers to focus on the main components of biofuel supply chains over which they have control. The work carried out in this project has delivered a standardised, transparent and clear methodology for calculating both farm and whole-chain biofuel supply GHG balances. It has developed an integrated GHG calculator for bioethanol from wheat and biodiesel from rape and a new electronic questionnaire for farm audits. By carrying out these activities, a major step towards on-farm GHG certification has been taken and near-term future developments should lead to a simple, robust and transparent audit questionnaire for direct use in biofuel feedstock assurance and certification. The UK currently has a lead in the development and implementation of these tools but many other countries are also developing similar approaches. In order to remain competitive, continued support for the development and implementation of low GHG emitting biofuel provision strategies is required.
ii
HGCA – Biofuel Assurance Report
1
Introduction
As the science underpinning man’s influence on climate change becomes more certain, the opportunities and threats for agriculture in the UK have become apparent. Earlier research work funded by the HGCA and by other agencies began the process of: 1. Developing confidence that annual crops could be used to produce biofuels which, under the right circumstances, result in significant reductions in greenhouse gas (GHG) emissions when used to substitute fossil fuels in transport. 2. Identifying and reducing the range in the uncertainties associated with the calculation of claimed climate change mitigation benefits of biofuels. 3. Developing the tools necessary to show individual farmers how their own farming practices affect, and can be changed to reduce, the GHG emissions associated with biofuel feedstock production.
The project The main objectives of this project were to: i.
Scope the potential for technological improvement of biofuel feedstock production in terms of GHG emissions.
ii.
Scope the uncertainties surrounding the quantification of on-farm factors affecting GHG emissions from wheat and OSR for biofuel production.
iii.
Develop methods for converting farm audit information into estimates of GHG emissions.
iv.
Recommend the best approaches for dealing with issues reviewed in (ii) for carbon accreditation schemes and highlight future research requirements.
v.
Inform the RTFO process and further development of carbon reporting and accreditation.
In order to achieve these objectives the project activities were divided into four discrete but linked tasks led by the individual partners in the project. These activities have resulted in five main outputs as follows: 1. A revised GHG calculator (Excel based spreadsheet) which provides a standardised methodology and tool for calculating the life-cycle GHG emissions from: a. UK-based wheat to ethanol b. UK-based rape to biodiesel The new version of the GHG calculator was demonstrated at Cereals 2007 and is available on the HGCA website: http://www.hgca.com/bioFuelCalc. This work has been an essential part of meeting objective ‘ii’ above, but also ‘iv’ and ‘v’. 2. This report which includes: a. A detailed evaluation of the ‘uncertainties’ which currently fuel the controversy surrounding biofuel implementation and their role as a -1-
HGCA – Biofuel Assurance Report
practical tool for GHG mitigation at the national and global scales. Developing the methodologies to firstly reduce, and secondly manage these uncertainties is a core part of this research and is critical to the development of a sustainable and publicly acceptable biofuel industry. The outcomes of the evaluation of uncertainty have therefore played a role in meeting all the objectives of the project, particularly objective ‘i’ and ‘ii’. b. An evaluation of the 2 years of farm audits carried out as a ‘bolt-on’ to ACCS and recommendations for future improvements and implementation strategies. The development of practical and simple farm audit questionnaires and monitoring schemes has provided a number of recommendations for objectives ‘iii’, ‘iv’ and ‘v’. The work has also played a role in meeting objectives ‘i’ and ‘ii’. 3. Recommendations for new research work to address the uncertainties and bottlenecks identified and to develop the practical steps necessary to move towards on-farm GHG reporting. 4. A major display at Cereals 2008 demonstrating the new version of the GHG calculator. 5. Close and continuing development.
technical interaction with RTFO methodology
This report outlines the UK’s current state-of-the-art in the process of assisting it’s agricultural sector to play a major role in meeting and mitigating the climate change challenge from the perspective of indigenous biofuel feedstock production. It explains the development of the methodologies and tools necessary to calculate and report with confidence on the GHG emissions of those biofuel feedstocks. Ultimately, the methodology outlined requires the tight integration of the GHG calculator tool and individual farm/field audits1 (both developed through this project and a previous HGCA project- Billins et al., 2005). A final, but critical purpose of the work reported here, is to provide clear explanations of the main issues involved in such biofuel feedstock provision, GHG emissions estimates, the uncertainties involved and the likely pathways towards resolving these issues. Understanding how to manage and reduce the uncertainties in GHG balance calculations for bio-products, including biofuels, will be critical to obtaining credible and therefore publically accepted, GHG reduction factors for biofuels. The analysis of, and options to overcome or mitigate, those uncertainties is extremely complex and diverse, and is covered in detail in a separate report produced as part of this project (Kindred et al, 2008). Delivering verifiable supplies of low GHG- emitting biofuel feedstocks requires farmlevel monitoring and accounting procedures and tools. The farm auditing and GHG calculator tools presented here provide the basis for such monitoring and accounting and can be used by farmers to understand and manage their greenhouse gas emissions. Substantial reductions are possible, particularly through understanding and optimising nitrogen inputs.
1
These audits have been designed as a bolt-on to ACCS and carried out by CMi over two years
-2-
HGCA – Biofuel Assurance Report
2
Greenhouse Gas Calculator Development
The original HGCA Greenhouse Gas calculator described a wheat-to-bioethanol supply chain (Billins et al., 2005) This section describes the new developments in the calculator: •
A rapeseed-to-biodiesel chain has now been incorporated and modifications made to ensure that the calculator uses a standardised approach to allow cross-comparisons between the different chains.
•
Identified improvements in greenhouse gas calculation methodology and modified default values have been incorporated into the calculator
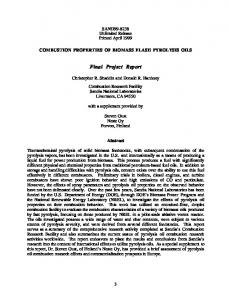
An upgraded Biofuels Greenhouse Gas Calculator for analysis of wheat-to-ethanol or oilseed rape-to-biodiesel production chains (Figure 1) is one of the main project outputs.
Figure 1: Biofuels Greenhouse Gas Calculator start sheet
2.1
Basic approach and methodology
The Biofuels GHG calculator is a spreadsheet-based tool for calculating the GHG emissions resulting from the production and use of wheat-based bioethanol or rapeseed biodiesel in the United Kingdom. It uses input data describing the entire production chain for any given batch of these biofuels, calculates the GHG emissions associated with that batch and compares the emissions with those produced from the production and use of an equivalent quantity of petrol or diesel. It is based on standard life-cycle analysis (LCA) principles, using user input or default data to produce inventories of inputs, outputs and GHG emissions for all supply chain stages from farming to delivery of produced fuel for use in vehicles. The resulting well-to-
-3-
HGCA – Biofuel Assurance Report
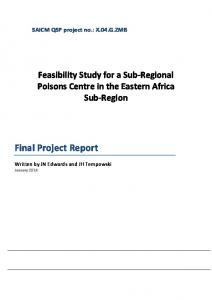
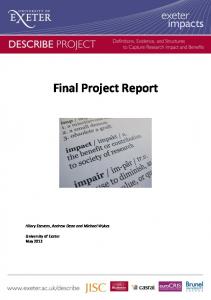
tank (WTT) emission figures allow appropriate comparisons between different biofuels and between biofuels and fossil fuels. The original bioethanol calculator was developed using default factors, assumptions and methodological choices agreed upon in an expert consensus study carried out for the Low Carbon Vehicle Partnership in 2004 (LowCVP, 2004). This basis is largely maintained in the bioethanol section of the new Biofuels Calculator. However, additions and improvements have been made to the calculator as recommended in Kindred, et al., (2008) The biodiesel section of the Biofuels Calculator uses basic data and assumptions primarily from two studies by a leading European Life Cycle Assessment group and partner in this project, North Energy Associates (Mortimer and Elsayed, 2006c and Mortimer, et al., 2003). For each WTT calculation, the calculator guides the user through a set of steps in a life cycle inventory, before presenting the results and allowing for examination of the detailed calculations. Each step of the calculations is presented on a separate page (in contrast to the previous Bioethanol Calculator), so that users may more easily focus on those steps of most interest to them and simply accept defaults for those steps of less interest or over which they have little control. Thus a farmer can focus on analysing the GHG impacts of farm level choices (Figure 2), while simply accepting suggested defaults for fuel production plant and other supply chain parameters.
Figure 2: Wheat farming data input sheet
-4-
HGCA – Biofuel Assurance Report
2.2
Underlying emission factors
Greenhouse gas emission calculations consider emissions of carbon dioxide (CO2), methane (CH4) and nitrous oxide (N2O), and global warming potentials used are the IPCC 100-year factors (Table 3). Based on these global warming potentials, total GHG emissions are expressed in units of kilograms of carbon dioxide equivalent (kg CO2eq).
Table 1: 100-year global warming potentials
Gas Global Warming Potential
CO2
CH4
N2O
1
23
296
For calculations of greenhouse gas emissions resulting from energy use in the production and distribution of biofuels, the calculator uses representative emission factors for fuels, electricity and transport as shown in the following sections. 2.2.1.1
Fossil Fuels and Electricity
For all consumption of fossil fuels and electricity from the grid, the GHG emission factors shown in Table 1 are used (LowCVP, 2004). Table 2: GHG emissions factors for fossil fuels and electricity GHG Emissions (kg CO2eq/GJ) Diesel
87
Gasoline
86
Natural Gas (EU-mix)
61
Grid Electricity (UK-mix)
160
2.2.1.2
Transport
Calculations of GHG emissions resulting from transport of biofuel feedstock and finished product are based on the GHG emissions factors shown in Table 3. Table 3: GHG emissions factors for freight transport
Transport Mode
GHG Emissions Factor (kgCO2eq/t.km)
Road
0.081
Rail
0.027
Sea
0.007
The road transport mode option assumes that fossil diesel is used. The GHG emissions factor is based on diesel consumption for road freight of 0.936 MJ/t.km (JEC, 2007) and the GHG emissions factor for diesel burning of 87 kg CO2eq/GJ as given in Table 2. The diesel consumption for road freight includes an allowance for -5-
HGCA – Biofuel Assurance Report
an empty return trip after delivery of feedstock or fuel over the specified one-way distance. Emissions factors for rail and sea are based on JEC, 2007.
2.3
Wheat-to-ethanol Calculations
The basic approach and methodology of the wheat-to-ethanol calculations in the Biofuels GHG Calculator have not changed substantially from those of the original Bioethanol GHG Calculator (Billins et al., 2005). Rather, detailed considerations of areas of uncertainty and of the Calculator’s applicability to future accreditation systems have led to adjustments to some default values and refinements in the methodologies for calculating some production chain emissions, as well as inclusion of some additional data input fields in the Calculator. The methodologies and assumptions of the wheat-to-ethanol calculations in the updated Calculator are described below.
2.3.1 Basis of Calculations The Calculator sums the GHG emissions directly or indirectly attributable to the inputs and processes involved in the different stages of a specified wheat-to-ethanol production chain. From this total, it subtracts credits for GHG emissions avoided as a result of the bioethanol co-products substituting for other GHG-generating products and processes. Thus, the method of substitution continues to be used for attributing all the GHG emissions from the ethanol production chain to all the co-products from that production chain. It has been proposed that the Calculator should use allocation by co-product price (Kindred, et.al. 2008), but this has not yet been adopted in the Calculator. To quantify the lifecycle GHG benefits from bioethanol production and use compared with petrol production and use, the Calculator compares the lifecycle GHG emission figures for a given quantity of ethanol with those from a quantity of petrol having equal energy content. 2.3.1.1
Agricultural Inputs
The GHG emissions factors used for agricultural inputs are given in Table 4. The factors for fertilisers, seeds and pesticides are those from the original LowCVP consensus study used for the Bioethanol GHG Calculator and considered to be representative figures for inputs to UK farming (LowCVP, 2004). Lime inputs are now included in the Biofuels GHG Calculator with the emissions factor being taken from Mortimer, 2003. Table 4: GHG emission factors for fertilisers, seeds and pesticides Agricultural Input
GHG Emissions (kg CO2eq/kg applied)
Nitrogen fertiliser (as N)
6.69
Phosphate fertiliser (as P)
0.71
Potash fertiliser (as K)
0.46
Lime
1.80
-6-
HGCA – Biofuel Assurance Report
Pesticides (as active ingredient)
5.41
Seed material
0.87
The nitrogen fertiliser emission factors are based on ammonium nitrate, the most commonly used nitrogen fertiliser in the UK (DEFRA, 2007). Once transparent and reliable figures for urea and other nitrogen fertilisers are available, these will be incorporated in the Calculator. Pesticides include all insecticides, herbicides and fungicides and are reported as kg of active substance. 2.3.1.2
Effects of Straw Removal
The link between straw removal or incorporation and default fertiliser inputs has been removed from the calculator. The assumptions about the impacts of straw removal on fertiliser requirements as included in the previous Calculator are now considered unreliable, and the default fertiliser application quantities are not automatically adjusted on the basis of straw removal or incorporation. Selection of either of the option buttons for “straw ploughed in” or “straw removed” provides information to help describe the farming practices employed, but does not affect the calculations. It may be appropriate to use this information in calculations of N2O emissions from crop residues and derived impacts on soil organic matter, although this would also require data on the fraction of total straw returned, and the quantification of impacts of straw removal on soil organic matter over a number of rotations. 2.3.1.3
Credits for Distillers Dried Grains and Solubles (DDGS)
DDGS has value as an animal feed, and may also be used as a fuel for co-firing in coal power stations. The Calculator allows for a choice between these two options for the use of DDGS co-product. It then calculates credits for GHG emissions avoided through displacement of equivalent amounts of animal feed production elsewhere or electricity generation as per UK grid. In calculations of animal feed credits, the animal feed product that is substituted by DDGS is soya bean meal imported from the USA. Each kilogram of DDGS is considered to substitute for 0.78 kg of soya bean meal, on the basis of relative protein content. Production in the USA and transport to the UK of each kilogram of soya bean meal result in emissions of 0.46 kg CO2eq (Transport from US production site to UK port includes travel distances of 50 km on roads, 250 km by river and 5000 km by sea). For DDGS used as fuel in co-firing for electricity production, a credit of 934 kg CO2eq per tonne of DDGS is applied. This is based on the assumptions that: •
DDGS (10% moisture) has a lower heating value (LHV) of 18.2 GJ/t.
•
DDGS is converted to electricity at the UK average rate of 0.325 GJ electricity output per GJ DDGS used.
•
DDGS is transported 150 km by road to a power plant
•
The DDGS-derived electricity generated substitutes for average UK ‘grid-mix electricity generation with GHG emissions of 160 kg CO2eq/GJe (Table 2).
-7-
HGCA – Biofuel Assurance Report
2.3.1.4
Credits for surplus electricity generation
Any surplus electricity produced by an ethanol plant (that is, any electricity that is generated but not used by the plant) is assumed to displace generation of an equal amount of grid-supplied electricity with GHG emissions equal to the UK electricity generation average of 160 kg CO2eq/GJe, and this value is used to calculate credits for those ethanol production chains which include generation of surplus electricity. 2.3.1.5
Set-aside credit
In the Calculator, all wheat for ethanol production is assumed to be grown on rotational set-aside, and a credit of 922 MJ/ha (equivalent to 25.8 l/ha of diesel fuel, from LowCVP, 2004) is applied for avoidance of maintenance of set-aside land. No credit is given for N2O emissions. When wheat growing replaces land use other than set-aside, the set-aside credit does not apply and the emissions associated with the alternative reference land use need to be calculated.
2.3.2 Default Bioethanol Production Chains In order to illustrate typically expected inputs, yields and resultant GHG emissions of different bioethanol production chains, all production chain sub-sections in the Calculator have a “Set Default Values” button that allows for setting of all data values and process characteristics to representative values. The default values used for the wheat-to-ethanol production chain are described below. 2.3.2.1
Basic wheat-to-ethanol pathway
The values adopted by the LCVP study for the basic non-energy inputs and yields of the different processes in the bioethanol production chain are shown in Figure 3. 2.3.2.2
Farming Inputs and Yields
For calculation of default GHG emissions from the farming component of the bioethanol production chain, the values in Table 5 are used (ibid.). Table 5: Default farming inputs and yields
Inputs
Straw ploughed back
Diesel fuel, l/ha
141
K fertiliser (as K), kg/ha
46
P fertiliser (as P), kg/ha
41
N fertiliser (as N), kg/ha
185
Pesticides (as active ingredient), 2 kg/ha Seed material, kg/ha
185
Yields Wheat grain, t/ha
8.0
Wheat Straw, t/ha
3.3
-8-
HGCA – Biofuel Assurance Report
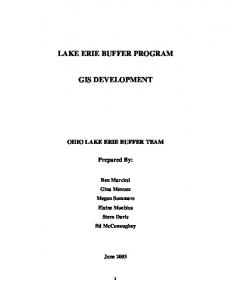
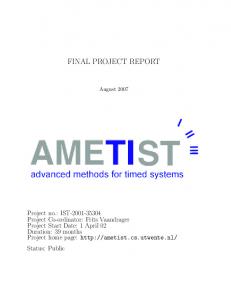
0.081 t Seed
Wheat production and supply 1.42 t straw
CULTIVATION AND HARVESTING 0.436 ha 3.49 t w heat (17% moisture content)
DRYING AND STORAGE 3.37 t dry w heat grain (14% moisture content)
TRANSPORT (road)
Ethanol production MILLING 10 t w ater
1.243 t CO2
HYDROLYSIS AND FERMENTATION
10 t alcohol (10% ethanol) + 1.14 t solids
DISTILLATION
DRYING
1.058 t distillate
1.14 t DDGS 9.942 t w aste w ater
(94.5% ethanol)
DEHYDRATION
1 t bioethanol
Figure 3: Basic assumptions for default wheat to ethanol pathways (LowCVP, 2004) 2.3.2.3
Drying and Storage
For the default case, wheat grain is assumed to be harvested at 17% moisture and dried to 14% moisture before delivery to the ethanol plant. The drying and storage of the wheat consumes 9.3 litres of diesel fuel and 11.7 kWh of electricity per tonne of dried grain produced. Further work is required to express diesel and electricity requirements on a %mc content removed per t grain basis, using defaults for different drying systems. 2.3.2.4
Transport to Processing
In all default production chains, dried wheat grain is assumed to be transported by road in diesel-fuelled trucks over an average distance of 50 km from the farm to ethanol plant.
-9-
HGCA – Biofuel Assurance Report
2.3.2.5
Processing
The default processing plant yields 374 litres of anhydrous ethanol per tonne of dried wheat grain (14% moisture) delivered to the plant. Additionally, 1.14 tonne of DDGS is produced for every tonne of anhydrous ethanol produced. The entire production process at the plant requires 9.75 GJ of heat and 1.45 GJ (403 kWh) of electricity per tonne of anhydrous ethanol produced. The first energy supply option in the calculator simply generates the necessary heat using a natural gas-fired boiler and imports the necessary electricity from the grid. The other options use combined heat and power (CHP) equipment sized to match the heat requirements of the plant, and produce varying amounts of surplus electricity. The option details are derived from the LowCVP study, which used typical operating characteristics and actual data from similar equipment currently in operation to determine the fuel inputs and energy outputs of suitably sized combined heat and power generation systems. These default fuel inputs and surplus electricity outputs of the five energy supply options included in the Calculator are summarised in Table 6. Table 6: Default fuel inputs and surplus electricity outputs Fuel Inputs and Surplus Electricity Outputs
NG boiler + grid
NG boiler + steam turbine
NG GT+ steam gen+ steam turbine
Natural gas consumption, GJ/t eth Imported electricity, kWh/t ethanol Surplus electricity, kWh/t ethanol Straw fuel consumption, kg/l ethan
11.8 403 0 0
14.4 0 396 0
27.2 0 2525 0
NG GT+ fired steam gen+ steam turbine 18.2 0 1389 0
Straw boiler + steam turbine 0 0 575 1.13
Note: ‘GT’ = gas turbine. ‘NG’ = natural gas
For the straw-burning CHP option, the default characteristics involve the assumption that the quantity of straw available for fuel is equal to the total straw co-produced with the wheat grain being converted into ethanol. Therefore, 1.424 t of straw is burnt per tonne of ethanol produced (Figure 3) equating to 1.13 kg straw/l ethanol (Table 6). It is also assumed that the straw is transported by road in diesel-fuelled trucks an average distance of 50 km from the farm to power plant. 2.3.2.6
Transport to End Use
In all default production chains, ethanol is assumed to be transported by road in diesel-fuelled trucks over an average one way distance of 150 km from ethanol plant to fuel blending/distribution site.
2.4
Oilseed rape-to-biodiesel Calculations
(rape
methyl
ester)
The oilseed rape-to-biodiesel production chains in the Biofuels GHG Calculator are based mainly on production chains described in two recent studies by North Energy Associates (Mortimer and Elsayed, 2006c and Mortimer, et al., 2003). As with the wheat-to-bioethanol calculations, analyses of areas of uncertainty and of the Calculator’s applicability to future accreditation systems have informed the methodology and default characteristics adopted for the rape methyl ester calculations. Those methodologies and default characteristics are described below.
- 10 -
HGCA – Biofuel Assurance Report
2.4.1 Basis of Calculations Greenhouse gas emissions resulting from a given oilseed rape-to-biodiesel production chain are calculated by summing the total direct and indirect emissions from all sections of that production chain and subtracting credits for GHG emissions avoided as a result of the biodiesel co-products substituting for other GHGgenerating products and processes. The two studies which provided most of the basic data for the development of the rape methyl ester calculator did not use this substitution method for attributing total emissions to all co-products, but instead used allocation by price. It was therefore necessary to extract the raw data from these studies and develop a new life cycle inventory for the calculator. Because both of the North Energy studies presented their methodologies and background data in very transparent ways, it was relatively easy to extract the necessary data on inputs, outputs, efficiencies and other characteristics of the different steps in the oilseed rape-to-biodiesel production chain, and to use these to develop new life cycle inventories. However, a substitution-based LCA required assessments of the likely displacement impacts of the biodiesel co-products, and determination of life-cycle emissions of the products displaced. 2.4.1.1
Agricultural Inputs
The GHG emissions factors used for agricultural inputs are given in Table 7. The factors for fertilisers and pesticides are taken from LowCVP (2004) and those for seeds and lime from Mortimer et al (2003). Table 7: GHG emission factors for fertilisers, seeds and pesticides Agricultural Input
GHG Emissions (kg CO2eq/kg)
Nitrogen fertiliser (as N)
6.69
Phosphate fertiliser (as P)
0.71
Potash fertiliser (as K)
0.46
Lime
1.80
Pesticides (as active ingredient)
5.37
Seed material
0.61
The nitrogen fertiliser emission factors are based on ammonium nitrate, the most commonly used nitrogen fertiliser in the UK (DEFRA, 2007). Once transparent and reliable figures for urea and other nitrogen fertilisers are available, these will be in the Calculator. Pesticides include all insecticides, herbicides and fungicides and are reported as kg of active substance. 2.4.1.2
Effects of Straw Removal
In the calculator, selection of either of the option buttons for “straw ploughed in” or “straw removed” provides information to help describe the farming practices employed, but currently has no effect on the calculations. It may be appropriate to use this information in calculations of N2O emissions from crop residue, although this
- 11 -
HGCA – Biofuel Assurance Report
would also require data on the fraction of total straw returned, and would strictly require quantification of impacts of straw removal on soil organic matter. 2.4.1.3
Credits for rape meal
Rape meal has value as an animal feed, and may also be used as a fuel for co-firing in coal power stations. The Calculator allows for a choice between these two options for the use of rape meal co-product and then calculates credits for GHG emissions avoided through displacement of equivalent amounts of animal feed production elsewhere or electricity generation as per UK-grid. Imported soya bean meal from the USA is chosen as the animal feed product that is substituted by rape meal in calculations of animal feed credits. Each kilogram of rape meal is considered to substitute for 0.90 kg of soya bean meal, on the basis of relative protein content. Production in the USA and transport to the UK of each kilogram of soya bean meal result in emissions of 0.46 kg CO2eq. For rape meal used as fuel in co-firing for electricity production, a credit of 825 kg CO2eq per tonne of rape meal is applied. This is based on the assumptions that: •
Rape meal is assumed to have a lower heating value (LHV) of 16.1 GJ/t
•
Rape meal is converted to electricity at the UK average rate of 0.325 GJ of electricity output per GJ of primary energy input.
•
Rape meal is transported 150 km by road to a power plant
•
The electricity generated from rape meal substitutes for other electricity generation with GHG emissions equal to the UK average of 160 kg CO2eq/GJe (Table 2).
2.4.1.4
Credits for glycerine
The Calculator allows for credits to be assigned for the production of glycerine as a co-product of esterification. The credits depend on the destination of the glycerine. Glycerine has a large number of uses in the pharmaceutical, food and other markets. Therefore, when it is sold as a raw material in the chemical markets, it is difficult to assign a destination. Determining the substitution impacts of glycerine (as well as whether they even exist) is therefore difficult. Nevertheless, the Calculator provides three choices for glycerine destination and its resultant impacts on GHG credit calculations. These utilisation options have not yet been fully characterised in the academic literature , but are seen as possible scenarios: •
Glycerine used as a bulk chemical, displacing production of propylene glycol. A credit of -6.16 gCO2eq/MJ biodiesel is assigned for displacing production of propylene glycol, and a cost of 2.63 gCO2eq/MJ biodiesel is added for purification of the crude glycerine co-product. This equates to a net credit of -1299 kgCO2eq/t crude glycerine. These GHG credits and costs are based on analyses reported in JEC, 2007.
•
Glycerine used as animal feed, replacing wheat feed. A credit of -0.84 gCO2eq/MJ biodiesel is assigned for displacing production of wheat grain, and a cost of 2.63 gCO2eq/MJ biodiesel is added for purification of the crude glycerine co-product. This equates to a net GHG cost of 659 kgCO2eq/t crude glycerine. This analysis is also based on JEC, 2007.
- 12 -
HGCA – Biofuel Assurance Report
•
Glycerine co-fired in power plant. This involves GHG emissions of 13 kgCO2eq/t glycerine for transporting the glycerine 150km to a power plant and includes further direct emissions during burning in the power plant. At the time of writing, no reliable data was available on GHG emissions from glycerine combustion, so the equivalent value for rape meal burning, 38 kgCO2eq/t (from Mortimer and Elsayed, 2006c), was used.
2.4.1.5
Credits for potassium sulphate
Potassium sulphate is another co-product of some biodiesel plants. Potassium sulphate may be used as a fertiliser, displacing potassium sulphate fertiliser. In order to calculate the credits to be assigned for production of potassium sulphate, a life cycle inventory was carried out for production of potassium sulphate fertiliser in Europe via the Mannheim process using potassium chloride and sulphuric acid. The credit was calculated as 457 kgCO2eq/t potassium sulphate produced. 2.4.1.6
Set-aside credit
In the Calculator, all oilseed rape for biodiesel production is assumed to be grown on rotational set-aside, and a credit of 922 MJ/ha (equivalent to 26 l/ha of diesel fuel) is applied for avoidance of maintenance of set-aside land. When oilseed rape farming replaces land use other than set-aside, the set-aside credit does not apply and the emissions associated with the alternative reference land use need to be calculated.
2.4.2 Default Biodiesel Production Chains In order to illustrate typically expected inputs, yields and resultant GHG emissions of different biodiesel production chains, all production chain sub-sections in the Calculator have a “Set Default Values” button that allows for setting of all data values and process characteristics to representative values. The default values used for the oilseed rape-to-biodiesel production chain are described below. 2.4.2.1
Basic oilseed rape-to-biodiesel pathway
The basic non-energy inputs and yields of the different processes in the biodiesel production chain are shown in Figure 4. 2.4.2.2
Farming Inputs and Yields
For calculation of default GHG emissions from the farming component of the biodiesel production chain, the values in Table 8 are used. Table 8: Default farming inputs and yields
Inputs
Defaults
Diesel fuel, l/ha
67
K fertiliser (as K), kg/ha
40
P fertiliser (as P), kg/ha
22
N fertiliser (as N), kg/ha
196
Pesticides (as active ingredient), 2.8
- 13 -
HGCA – Biofuel Assurance Report
kg/ha Seed material, kg/ha
5
Yields Rapeseed, t/ha
3.1
Straw, t/ha
3.0
2.4.2.3
Drying and Storage
For the default case, rapeseed is assumed to be harvested at 13% moisture and dried to 9% moisture before delivery to the crushing plant. The drying and storage of the rapeseed consumes 3.8 litres of diesel fuel and 5 kWh of electricity per tonne of dried oilseed. 2.4.2.4
Oilseed Transport
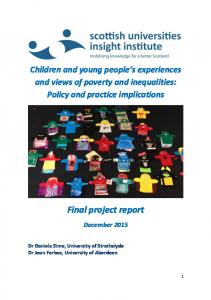
In all default production chains, rapeseed is assumed to be transported by road in diesel-fuelled trucks over an average distance of 50 km from the farm to a central drying facility. 0.005 t Seed
CULTIVATION AND HARVESTING 0.788 ha
2.44 t straw
2.520 t oilseed rape (13% moisture content)
TRANSPORT (road)
DRYING AND STORAGE 2.410 t dried oilseed (9% moisture content)
OIL EXTRACTION 1.29 t rape meal 1.000 t crude rapeseed oil
ESTERIFICATION 0.040 t K2 SO4
0.100 t crude glycerine 1.000 t biodiesel
STORAGE AND DISTRIBUTION
1.000 t biodiesel
- 14 -
HGCA – Biofuel Assurance Report
Figure 4: Basic assumptions for default rape to biodiesel pathways (Mortimer and Elsayed, 2006)
2.4.2.5
Oil Extraction
The default oil extraction plant yields 0.41t of crude rapeseed oil per tonne of dried rapeseed. Additionally, 0.54t of rape meal is produced per tonne of dried rapeseed. The oil extraction process requires 2.78 GJ of heat and 0.46 GJ of electricity per tonne of crude rapeseed oil produced. The calculator does not provide for different energy supply options in the esterification plant as it does for the bioethanol plant. This is because an analysis of a range of such options at relevant scales has not yet been carried out. Thus, the only energy supply considered is one using a natural gasfired boiler to generate the necessary heat and imported electricity from the grid. 2.4.2.6
Esterification
The default esterification plant yields 1.0t of biodiesel per tonne of crude rapeseed oil. Additionally, 0.10t of glycerine and 0.04t of potassium sulphate are produced for every tonne of biodiesel produced. The entire production process at the plant requires 2.85 GJ of heat and 0.33 GJ of electricity per tonne of biodiesel produced. The calculator does not provide for different energy supply options in the esterification plant as it does for the bioethanol plant. This is because an analysis of a range of such options at relevant scales has not yet been carried out. Thus, the only energy supply considered is one using a natural gas-fired boiler to generate the necessary heat and imported electricity from the grid. 2.4.2.7
Transport to End Use
In all default production chains, biodiesel is assumed to be transported by road in diesel-fuelled trucks over an average one way distance of 150 km from biodiesel plant to fuel blending/distribution site.
- 15 -
HGCA – Biofuel Assurance Report
3
Developing Farm Audit Sheets
Farm audits have been developed as a possible ‘bolt-on’ to the ACCS audits with the aim of allowing the GHG emissions associated with the feedstock production for biofuels to be calculated at the farm-level. To date, two years of audits have been carried out by CMi using questionnaires developed in collaboration with Imperial College London. The following sections provide an overview of the rationale and key findings from the farm audits.
3.1
Overview of approach
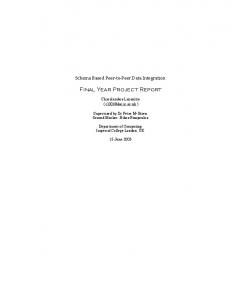
In March and April 2007, CMi carried out approximately 100 farm surveys on wheat and OSR production in locations throughout England which were administered in conjunction with ACCS audits. The audits covered production data for the 2005/06 season. These audits follow on from those carried out the previous year which obtained data from the 2004/05 season. Fifty-seven surveys were collected in 2006, and included spring and winter sown wheat and OSR. A significant change for the 2007 audit was the development and use of an electronic version of the questionnaire (Figure 5). This is an important development, as it is planned that future audit data will be inputted automatically to the Greenhouse Gas Calculator, improving the accuracy and efficiency of obtaining GHG emission levels from individual farms/fields.
Figure 5: Farm audit sheet
- 16 -
HGCA – Biofuel Assurance Report
3.2
Audit Questions
The farm audits ask a number of questions about the farming conditions and operations involved in production of biofuel crops on particular fields or farms. It is important to note that the current audit sheet is not necessarily the final version. For this stage of the project it was decided to ask a broad, but practical range of questions. The questions were developed in order to assess the practicability of this approach to farm-level GHG emission calculations and to choose the areas that are most sensitive to farm management practices and therefore amenable to change should carbon management become a cost-effective option in the future. When choosing the specific questions, a balanced approach has been developed between the desire to obtain the ‘ideal’ information required to calculate a detailed GHG emissions factor and the limits of what information is reasonably likely to be available from farmers.
3.2.1 Cultivations
Figure 6: Cultivation input section of audit sheet
These have both direct and indirect impacts on GHG emissions. Direct emissions from diesel use are approximately 10% of on-farm emissions. The main energy expenditure associated with soil cultivations is determined by the physical mass of soil moved, so diesel use is expected to be independent of engine size. For a specific field the energy demanded for cultivations is dependent on many factors including recent weather and soil type, but the only easily available data to collect is the soil type, as discussed later. The different operations also have indirect GHG emission
- 17 -
HGCA – Biofuel Assurance Report
implications, for example ploughing increases the rate of SOC (Soil Organic Carbon) oxidation compared to minimum tillage, suggesting that minimum tillage reduces GHG emissions. Yet ploughing every four years or so in the rotation to control grass weeds is thought to release the majority of C stored during the minimum tillage years. This is discussed in detail in Kindred et al (2008). The effects of ploughing on N2O emissions are even less well understood, and due to the high levels of uncertainties surrounding these factors they are not presently used in the GHG calculator.
3.2.2 Soil type A critical change in the 2007 surveys (for 2006 yields) was a more detailed question about soil type. Previously this had been asked as an open ended question, and the answers varied widely and could not be compared. To solve this problem farmers were asked to assess their soils according to the 7 types listed in RB209 (Table 9). This categorisation was chosen rather than the more traditional soil analysis to provide a single method of easily identifiable and comparable soil types. This information is useful because it may enable a more precise, batch-specific calculation of two factors which have so far only been calculated on a regional basis or by using uncertain default factors: 1. On-farm N2O emissions 2. Cultivation energy requirements. Table 9: The 7 different soil types used in the farm audits. Originally from RB209
Soil type 1 2 3 4 5
6
7
- 18 -
HGCA – Biofuel Assurance Report
3.2.3 Fertiliser usage There are three important factors affecting GHG emissions from agricultural fertiliser use – the embodied GHG emissions of the products, the field GHG emissions, and diesel use in application. The emission from diesel is a small fraction compared to the other two factors, which are discussed in detail in Kindred, et al (2008). The audits ask not only the total quantity of each fertiliser applied, but also the type and timing of application, as these have important GHG implications for the embodied and in-field emissions respectively.
Figure 7: Fertiliser input section of audit sheet
3.2.4 Pesticide usage There are two GHG implications of pesticide use, the embodied energy of the products, and the diesel required in their application. Diesel use is calculated through the number of applications. The embodied energy is harder to calculate. There is a poor data set for the embodied energy contained in different pesticides, most of the literature relies on or extrapolates from a single piece of dated research. Using averages for different pesticide groups (already a large generalisation), calculations show that pesticides equal a very small percentage (less than 1%) of the on-farm emissions. Due to the unreliability of the original data together with low GHG emissions levels associated with pesticide use, pesticides are ignored from these calculations as their emissions are well within the range of uncertainty. The number of passes that the sprayer makes is used to calculate the diesel used. Detailed pesticide data is still recorded for two reasons – if better information becomes available then this data can be retrospectively used, and the data could be useful for bio-fuel sustainability certification.
- 19 -
HGCA – Biofuel Assurance Report
3.2.5 Grain Nitrogen This is recorded as a potential future source of information on the efficiency of N uptake by the plant, and indirectly the level of N application. As yet this is underresearched (see Section 4.2.2.1 for discussion).
3.2.6 Grain drying Grain may be taken off the field at a variety of moisture levels, but must be reduced to 14% or 9% moisture for wheat and OSR respectively for safe storage. Moisture reduction can occur through a variety of mechanisms, but most commonly used are continuous flow, on floor and batch driers. The amount of energy required depends on the drying method, process and percentage of moisture to be removed. More detailed research in this area would be useful.
Figure 8: Audit sheet inputs for feedstock harvesting, drying and transport
The full audit sheet is available at http://www.hgca.com
- 20 -
HGCA – Biofuel Assurance Report
3.3
Results
Table 10: A selection of farm audit data results
Wheat Mean
OSR Standard
Mean
Standard deviation
Deviation Feedstock yield*(t/ha)
8.9
1.24
3.55
0.762
N (kg/ha)
193.7
33.6
191.8
34.7
P(kg/ha)
41.6
n/a
42.5
n/a
K(kg/ha)
36.3
n/a
42.2
n/a
Manure applications
5
n/a
9
n/a
Moisture content (%) after 14.7 drying
4.8
8.59
3.121
Moisture removed (%)
1.6
1.6
1.2
1.8
Distance to dryer (km)
2.6
4.6
2.28
2.23
* After drying to storage moisture content
Figure 9 shows the average GHG emissions associated with different agricultural actions for the production of wheat. We have addressed the farm audit data based on the most important factors, namely fertilisers and cultivations.
The Greenhouse Gas Emissions associated with a hectare of Wheat N fertiliser P fertiliser K fertiliser Cultivations Drying and storage Other including pesticides,
Figure 9: importance of different factors in determining the emissions associated with wheat (from Mortimer, 2003)
3.3.1 Fertiliser use Fertiliser use is the most significant GHG contribution to the production of biofuel crops, accounting for around 90% of emissions. Of all the fertilisers N is by far the most important, accounting for 96% of fertiliser GHG emissions in the 2007 data - 21 -
HGCA – Biofuel Assurance Report
(95% in 2006), compared to just 1% and 2% for P and K respectively. The relationship between fertiliser applied and the emission of N2O is complicated, with factors depending on soil type, agricultural practices (including cropping) and local weather and climate, but in these calculations we will assume a direct relationship using IPCC data. Nitrogen use From the 80 farm surveys carried out by CMi on wheat and rape production, covering the 2005/06 season, N fertiliser additions for wheat ranged from 90 – 283kg/ha, with an average of 194kg/ha (compared to 80 – 300 kg/ha, mean 186kg/ha in 2004/05 data). As Figures 10 and 11 show, there is no obvious relationship between N applications and soil type except in the organic soils, soil type 6. Organic soils received about a third less N than other soils (p