Open access e-Journal
Earth Science India,
eISSN: 0974 – 8350 Vol. 4(IV), October, 2011, pp. 188 - 200 http://www.earthscienceindia.info/
Prediction of Rainfall Using Support Vector Machine and Relevance Vector Machine Pijush Samui1, Venkata Ravibabu Mandla2, Arun Krishna2 and Tarun Teja2 1 Centre for Disaster Mitigation and Management 2 School of Mechanical and Building Sciences, Center for Energy and Environment VIT University, Vellore-632 014, TN, India Email:
[email protected]
Abstract This article adopts Support Vector Machine (SVM) and Relevance Vector Machine (RVM) for prediction of rainfall in Vellore (India). SVM is firmly based on the theory of statistical learning theory. RVM is a probabilistic basis model. SVM and RVM use air temperature (T), sunshine, humidity and wind speed (Va) as input variables. This article uses SVM and RVM as a regression technique. Equations have been also developed for prediction of rainfall. The developed RVM gives variance of the predicted rainfall. This study shows the RVM is more robust model than the SVM. Key Words: Rain-fall; SVM; RVM; Vellore district
Introduction Rain is one of nature’s greatest gifts and in third world countries like India; the entire agriculture depends upon rain. It is generally accepted that rainfall is unpredictable. However, there are certain periodicities in its long-term behavior (Nicholson and Entekhabi, 1986). Most of the deviations in the periodicity are related to solar cycles; variations in ocean currents and wind directions; sea surface temperature anomalies, etc. (Bhalme and Mooley, 1981; Ramage, 1971; Ananthakrishnan and Parthasarathy, 1984). Water resources assessment is defined by UNESCO and WMO (1988) as the process of assessing the source, scope, reliability, quantity and quality of water resources for the purposes of water resources utilization and management. Water resources assessment, which is important for water resources planning, is usually conducted using information that has been collected over a long period of time (over 20 years) and by normalizing historic series of observe driver discharges using water use data and water balance equations (Miloradov and Marjanovic,1998). Real-time water resources assessment can be defined as a rapid assessment of the water resources generated in a rainfall event or in a past period from a particular day of the year to the current rainfall event. Applications of synthetic rainfall data may then be made in such diverse fields as flood modelling and urban drainage (Moretti and Montanari, 2004; Brath et al., 2006; Dawson et al., 2006; Hall et al., 2006), pesticide fate modelling (Nolan et al., in press), landslide modelling (Bathurst et al., 2005), desertification vulnerability (Bathurst and Bovolo, 2004), water resource assessment (Fowler et al., 2005) and flood risk assessment 188
Open access e-Journal
Earth Science India,
eISSN: 0974 – 8350 Vol. 4(IV), October, 2011, pp. 188 - 200 http://www.earthscienceindia.info/
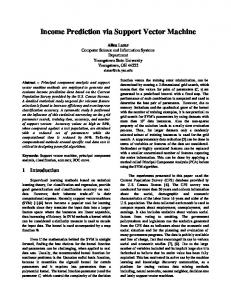
(Kilsby et al., 2000). Rainfall prediction has been the subject of extensive research in the recent past (Annamalai, 1995; Krishnakumar, 1994; Parthasarathy and Sontakke, 1988a; Parthasarathy et al., 1988b; Prasad and Singh, 1992; Navone and Ceccatto, 1994). Application of neural networks for rainfall analysis and prediction is not new (Amin Talei et al., 2010, Nayak et al., 2006), Navone and Ceccatto, 1994; Sunyounget et al., 1998). Navone and Ceccatto (1994) gave a brief introduction to neural networks and its application to predicting Indian monsoon rainfall in particular. They compared their results with conventional methods and showed that neural network based methods are able to produce reasonably accurate predictions compared to linear models popularly used for this purpose. In this paper, we present support vector machine (SVM) and relevance vector machine (RVM) for studying and predicting the long-term variations in rainfall phenomena based on past observations. To illustrate the method, we have used the rainfall of Vellore town in Tamil Nadu State, India as an example. An hourly rain-fall flow data is been collected by Automatic Weather Station (AWS) at VIT-University campus (ISRO119 located at latitude: 120 91’N and longitude: 790 14’E measured at different ground levels) Vellore (Fig. 1).
Fig. 1: Location map of study area. 189
Open access e-Journal
Earth Science India,
eISSN: 0974 – 8350 Vol. 4(IV), October, 2011, pp. 188 - 200 http://www.earthscienceindia.info/
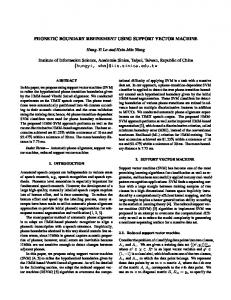
Details of SVM This study adopts SVM as a regression technique for prediction of rainfall. εinsensitive loss function has used in this analysis. The expression of ε-insensitive loss function is given below: L ε (y ) = 0 for f (x ) − y < ε otherwise L ε (y ) = f (x ) − y − ε Where x is input and y is output.
(1)
This defines an ε tube (Fig. 2) so that if the predicted value is within the tube the loss is zero, while if the predicted point is outside the tube, the loss is the magnitude of the difference between the predicted value and the radius, ε, of the tube. Suppose f(x) takes the following form:
f (x ) = (w.x ) + b w ∈ R n ,
b∈r
(2)
Where, w = is an adjustable weight vector, b = scalar threshold, Rn=n dimensional vector space and r=one dimensional vector space. Then, we have to solve the following optimization problem: 1 2 Minimize: w 2
( ) + b ) − y ≤ ε , i = 1, 2,...,l i
Subjected to: y − w.x + b ≤ ε , i = 1, 2,...,l i i
( w.x i
(3)
In the case where the constraints are infeasible, we introduce slack variables ξi and ξ* (see Fig. 2) in optimization problem (3). The above optimization problem (3) can be i written in the following way: l 1 2 Minimize: w + C ∑ ξ + ξ * i 2 i=1 i
(
)
Subjected to: y − w.x + b ≤ ε + ξ , i = 1, 2,...,l i i i * w.x + b − y ≤ ε + ξ , i = 1, 2,...,l i i i * ξ ≥ 0 and ξ ≥ 0 , i = 1, 2,...,l (4) i i The constant called capacity factor 0