Prediction of Software Defects using Twin Support Vector Machine Sonali Agarwal Assistant Professor
Divya Tomar Research Scholar
Siddhant M.tech Student
Indian Institute of Information Technology, Allahabad, India
[email protected]
Indian Institute of Information Technology, Allahabad, India
[email protected]
Indian Institute of Information Technology, Allahabad, India
[email protected]
thinking outside the box for developing efficient software by reducing the efforts to be put in to develop and deliver a defect free product. This research paper supports the idea of software defect prediction. Software defects have to be handled and the foremost way of controlling and handling these defects could be done by efficient measure of predictions. Software defect prediction ensures the developer and also the client/end user for a better quality of product, one much reliable and efficient in nature which comes from a extensive prediction methods, similar to our method of using Twin Support Vector Machine(which we discuss in detail in the subsequent section). Prediction of software defects accentuates over a more practical and cost effective ways of eradication of defects.
Abstract—Considering the current scenario, the crucial need for software developer is the generous enhancement in the quality of the software product we deliver to the end user. Lifecycle models, development methodologies and tools have been extensively used for the same but the prime concern remains is the software defects that hinders our desire for good quality software. A lot of research work has been done on defect reduction, defect identification and defect prediction to solve this problem. This research work focus on defect prediction, a fairly new filed to work on. Artificial intelligence and data mining are the most popular methods researchers have been using recently. This research aims to use the Twin Support Vector Machine (TSVM) for predicting the number of defects in a new version of software product. This model gives a nearly perfect efficiency which compared to other models is far better. Twin Support Vector Machine based software defects prediction model using Gaussian kernel function obtains better performance as compare to earlier proposed approaches of software defect prediction. By predicting the defects in the new version, we thereby attempt to take a step to solve the problem of maintaining the high software quality. This proposed model directly shows its impact on the testing phase of the software product by simply plummeting the overall cost and efforts put in.
Defect Prediction though a very young research domain has evolved a lot in a matter of few years and now it is clearly established that it has grown into a major field recently. With the advancement of technology and with the pace research is going, we are able to classify the defect prediction models in two sorts, namely models in data mining technique and models in artificial intelligence domain. This Research work involves the use of data mining techniques. There had been a lot of data mining techniques available for disentangling the problem of defects and bugs in software. Bayesian Belief Network (BBNs) or the BPNN method or clustering or Bayesian Model is used for predicting the defects in software modules [3]. Support Vector Machine (SVM) has been the most preferred method for its high accuracy in prediction. One of the issues with conventional SVM is to solve a quadratic programming problem, which is highly complex. Jayadeva et al. proposed a novel Twin Support Vector Machine for binary classification to enhance the computational speed [4]. Rather than solving one complex Quadratic Programming Problem (QPP), TSVM solves two smaller QPPs and determines two non-parallel hyper-planes. TSVM finds two non-parallel hyper-planes for linear separable training dataset, where each hyper-plane is closely represents its affinity to one class and distant from other class. Similar to SVM, TSVM also used kernel function to separate non-linear training dataset. Kernel functions are used to maps the inseparable training datasets into high-dimensional feature space to make their separation easy [5]. In TSVM, also various types of kernel functions such
Keywords—Twin Support Vector Machine, Software defects prediction, CM1 dataset, Software defect.
I.
INTRODUCTION
A defect in software modules, an error in the programming logic or coding, is responsible for incorrect output or poor quality of the software product which further increase development and maintenance cost. Software defects have proved to be a dominant factor in high cost of software [1][2]. Like Software Requirement Specification (SRS) acts as the contract between a client and developer similarly a software defect acts as the “material breach” of contact/agreement which varies on magnitude of impact by these defects, i.e., a customer due to presence of defects can demand fix of problem or in worst case ask to cancel the agreement. Often the only real guarantee is that mistakes tends to occur always and will cause defects in our software. Testing the software heavily after development has been the prime measure for jettisoning defects till very recent times. Defect prediction and measure to remove defects based on these predictions has been a new approach, of
978-1-4799-2981-8/14/$31.00 ©2014 IEEE 128
as linear, polynomial, sigmoid, Gaussian, Fourier etc. are available. This research work develops a predictive model to predict the defect in software module using Twin Support Vector Machine and analyze its performance using Linear, Polynomial and Gaussian kernel function. This research work methodology includes a benchmarking study and analysis of publically available dataset, provided by PROMISE Repository [14]. The paper is organized in 7 sections. Related research works are presented in section II. The section III gives an overview of Twin Support Vector Machine and section IV explains the proposed methodology. Various performance measure parameters for software defect predictive model are described in the section V. Section VI deals with the experiment results and section VII discusses about conclusion of this research. II.
RELATED WORK
Defect prediction though is a new field of research but there has been a long work going on to measure the defect. Halstead’s theory [6] and McCabe’s Cyclomatic Complexity [7] are the most popularly known techniques. Recently Data Mining, Clustering and Regression based tactics have been used to predict the defects. One of the measures to control software quality was suggested by finding the defect density [8] and using aggregation and data analysis techniques. Karim and Mahmoud used Support Vector Machine to predict defect prone software modules. This research work compared the predictive performance of Support Vector Machine for four NASA dataset against eight machine learning models [3]. Another research work predicted the defect in software modules using Fuzzy Support Vector Regression. Fuzzification input was used to handle the imbalance software metrics dataset [9]. Kaur and Pallavi also discussed about utilization of various data mining techniques such as association, clustering and classification for the prediction of software defect in their research work [10]. Ghouti and Jamimi in their work on fault prediction [11] focus their study on estimating the fault prediction model suggested which runs on SVM and Probabilistic Neural Network (PNN). The research work used the public datasets available at PROMISE Repository. Thus their experiment exemplifies that PNN is a better approach for prediction performance estimation for any size of datasets. There was also a motivating work done by Singh and Chaturvedi [12] who proposed entropy based prediction mechanism using a prevalent technique of Support Vector Regression (SVR). This research work also used the same approach used by Ghouti and Jamimi, of comparison of results by experimenting on different models and ascertaining the one with most adeptness. An interesting work had been proposed in a research paper authored by Can et al., where SVM and Particle Swarm Optimization (PSO) models have been used to put forward a new model of prediction called PSVM [13]. The fascinating part in this scheme was that the model worked on non-linear computing capacities of SVM and parameters optimization techniques of PSO. P-SVM showed encouraging results as it turned out to be a better choice quantitatively when compared to the results from the
models like Back Propagation Neural Network model, SVM model and Genetic Algorithm based SVM model. All these research works represents versatile applicability of SVM for implementation of prediction model and this becomes our crucial motivator to work on the defect prediction using Twin Support Vector Machine though we in consequent sections prove that our work inclines to give better than other existing methods. III.
TWIN SUPPORT VECTOR MACHINE
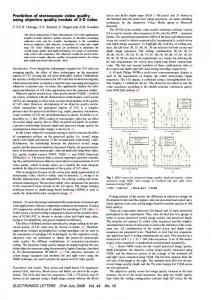
Jayadeva et al. proposed a novel Twin Support Vector Machine a solution of binary classification to enhance the computational speed [4].Twin Support Vector Machine is one of most advanced machine learning approach for pattern classification. The aim of TSVM is to find two non-parallel planes to classify the data sample of different classes in such a way that each hyper-plane is closely represents its affinity to one class and distant from other class. So, TSVM solves two smaller size quadratic problems rather than single larger size quadratic problem as in traditional SVM [4]. The main purpose of TSVM is to improve the high computational complexity of SVM. Figure 1 indicates the classification of dataset into two classes using TSVM. Class 1 and Class 2 are separated by using two non-parallel planes. It is shown clearly in the figure that plane 1 is closer to the data samples of Class 1 and farther from Class 2. In the same way, plane 2 belongs to Class 2 and fairly apart from Class 1.
Fig 1. Binary Classification using TSVM
Consider ‘m’ data samples of positive class and ‘n’ data samples of negative class. R represents training sample of ‘k’ R is a matrix that represents the data dimension. Let X R is a matrix that samples of positive class and X represents the data samples of negative class.Two non-parallel hyper-planes in R are given below: 0 and x T w +b 0 (1) x T w +b The primal problem for Linear Twin Support Vector Machine is given as: X w e b c eT ξ min w , b , ξ ξ e ,ξ 0 s.t. X w e b (2) T X w e b c e η min w , b , η
2014 International Conference on Information Systems and Computer Networks
129
s.t
X w
η
e b
e ,η
0
(3)
where ξ and η are slack variables and e1 and e2 are the two vectors with all values ones of suitable dimensions. c1 and c2 are penalty parameters. The above two quadratic equation are used for constructing the Twin Support Machine classifier. Lagrangian of equation 3 is given as: L w , b , ξ, α, β X w e b c eT ξ +αT X w e b βT ξ ξ e (4) Where α and β are the vectors of Lagrangian multipliers. Karush-Kuhn-Tucker conditions of above equation are given below: L XT α 0 X w e b (5) L L
eT X w c eT
βT
eT α
e b αT
X w e b ξ αT X w e b α 0, β 0 Combining equation 5 and 6: w XT X e T b e
0
(6)
0
(7)
ξ e
e ,ξ 0 0, βT ξ=0
XT α eT
0
(8) (9) (10) (11)
w (12). b Equation 11 is re-written after replacing with equation equation12: BTα 0 (13) AT Au u AT A B T α (14) Sometimes it may be not possible to calculate inverse of AT A. So, to avoid this situation use regularization term δI, where I is an identity matrix of appropriate dimensions. So, after modifying equation 14 we get: AT A δI B T α (15) u And in the same way B T B δI AT γ (16) u TSVM classifier constructs two non-parallel hyper-planes for each class. After solving equation 15 and 16 we obtained weight and bias which further utilized to generate two nonparallel hyper-planes as per equation 1. Class ‘i’ is allocated to a data sample according to the following formula: Class i= min|x T w b | for i 1,2 (17) Let A= X e
and B= X e
u
The distance of a data point is calculated from each of two non-parallel hyper-planes, the point is classified to the class corresponding to the hyper-plane to which the distance of the point is lesser. For non-Linear problem: TSVM uses kernel function for the classification of data samples which are not separable by linear boundaries. Kernel function maps the data samples from input space to high dimensional feature space so that their separation becomes easier [5]. The following are the optimization problem of TSVM for non-linear data samples: min u , b , ξ
K X , DT u
e b
c eT ξ
(18)
ξ e ,ξ 0 s.t. K X , DT u e b and K X , DT u e b c eT η (19) min u , b , η η e ,η 0 s.t. K X , DT u e b Where D= X X T , and K is any appropriate kernel function. Following are the kernel generated surfaces instead of planes: b 0 and K(x T , DT )u b 0 (20) K(x T , DT )u Lagrangian function of above equation is as follows: L u , b , ξ, α, β K X , DT u e b c eT ξ+αT K X , DT u ξ e (21) βT ξ e b After solving above equation we achieve: u P T P QT α (22) z b And in the same way: u QT Q P T α (23) z b T T Where P = [K X , D e ] and Q = [K X , D e ] (24) After solving equation 22 and 23, TSVM classifier constructs two kernel generated surfaces one for each class using equation 20.New data points are classified according to the following equation: (25) Class i= min|K x T , DT u b | for i 1,2 The distance of a data point is calculated from each of two non-parallel hyper-planes, the point is classified to the class corresponding to the hyper-plane to which the distance of the point is lesser. This research work used following kernel function: L is a Linear kernel function and given as: L(x , x ) = x T x P is a Polynomial kernel function and given as: P x , x 1 xT x G is a Gaussian kernel function and represents as: G= exp IV.
PROPOSED METHODOLOGY
This research work performed the experiment on the publicly accessible CM1 PROMISE software engineering repository dataset [14]. CM1 (software prediction) dataset is a NASA spacecraft instruments that is written in procedural language (C) and very popular dataset for testing of a prediction model. This dataset contains the information such as Line of Code, Design Complexity, Cyclomatic Complexity, Essential Complexity, Effort Measures, comments and various other attributes that are useful for predicting either a software has defects or not . The details about the dataset are given in table 1. TABLE I. DETAILS OF DATASET S.No. 1
Attribute loc
2
v(g)
3 4
ev (g) iv (g)
2014 International Conference on Information Systems and Computer Networks
Description It counts the line of code in software module Measure McCabe Cyclomatic Complexity McCabe Essential Complexity McCabe Design Complexity
Type Numeric Numeric Numeric Numeric
130
5
n
6 7 8 9 10 11 12 13
v l d i e b t locode
14 15 16
locomment loblank locodeandc omment uniq_op uniq_opnd total_op total_opnd branchcount defects
17 18 19 20 21 22
Total number of operators and operands Volume Program length Measure difficulty Measure Intelligence Measure Effort Effort estimate Time Estimator Number of lines in software module Number of comments Number of blank lines Number of codes and comments Unique operators Unique operands Total operators Total operands Number of branch count Class that describes Software module has defects or not
Numeric Numeric Numeric Numeric Numeric Numeric Numeric Numeric Numeric Numeric Numeric Numeric Numeric Numeric Numeric Numeric Numeric Discrete (False or True)
There are several research papers available illustrating the use of predictive model for prediction of defects in software modules. The motivation of this research work is to develop an efficient predictive model which could able to minimize the computation complexities present in previous approaches and provide an efficient classification technique with more accuracy. This research work proposed a predictive model for software defect prediction using Twin Support Vector Machine. The dataset represents the classes by False and True. ‘False’ indicates that software modules has not reported defects, while ‘True’ represents software modules has reported one or more defects. In our experiment, we replace false and true entries by 1 and -1 respectively. The steps of TSVM based predictive model are as follows: Step 1: Load the CM1 data and apply pre-processing technique. Step 2: Initialize the input parameters such as Kernel (Polynomial, Gaussian), ‘σ’,‘d’, Penalty parameters c1 and c2. Define P and Q matrix using equation 24. Step 3: Calculate Lagrangian parameters α and β and then calculate z and z using equation 22 and 23. Step 4: Determine two non-parallel line using equation 20. Step 5: Predict for new software module either it is defect free or not by using equation 25. Step 6: Test the Model and analyze the model accuracy for different kernel function.
Defective Not Defective
Actual Class
TABLE II. CONFUSION MATRIX Predicted Class Defective
False Positive (FP) True Positive (TP)
In this paper, we evaluate the performance of predictive model using Accuracy, Specificity Sensitivity, Precision and F-Measure parameters [15]. Following are the details of various parameters considered for performance evaluation: a. Accuracy: Accuracy of the software defect prediction model is estimated by the ratio of correctly predicted software modules either as defective or not to the total number of software modules. It is also known as correct classification rate of predictive model. Accuracy= (TP+TN)/(TP+FP+FN+TN) b. Sensitivity: Sensitivity is evaluated by the percentage of defect free software modules that are recognized accurately. It is also known as true positive rate and formulated as: Sensitivity= TP/ (TP+FN) c. Specificity: Specificity is calculated by the percentage of defective software modules that are recognized correctly by the predictive model. It is also known as true negative rate and formulated as: Specificity= TN/ (TN+FP) d. Precision: Precision of the software defect predictive model is calculated by the ratio of defect free software module predicted correctly to the total predicted defect free software module. It is also known as correctness. Precision= TP/(TP+FP) e. F-Measure: F-measure of predictive model is calculated by the harmonic mean of two significant performance deriving parameters such as sensitivity and precision. F-Measure=(2*Sensitivity*Precision)/(Sensitivity + Precision) VI. EXPERIMENTAL RESULTS AND ANALYSIS We performed the experiment using Linear, Gaussian and Polynomial kernel function. Table 3 represents the confusion matrix of proposed predictive model: TABLE III. CONFUSION MATRIX OF PREDICTIVE MODEL Actual Class Predictive Class No (-1) Yes (1) Gaussian
No (-1) Yes (1) Actual Class
Polynomial No (-1) Yes (1) Actual Class
V. PERFORMANCE MEASURES OF PREDICTION This research paper measures the performance of 2-class predictive model of software defect prediction using confusion matrix. Confusion Matrix stores the details of actual and predicted class (estimated by the classifier) in tabular form as shown in table 2.
True Negative (TN) False Negative (FN)
Linear
No (-1) Yes (1)
48 1 Predictive Class No (1) 77 45 Predictive Class No (-1) 66 24
1 173 Yes (1) 30 159 Yes (1) 41 180
Performance comparison of software defect prediction model based on Twin Support Vector Machine using various parameters is shown in table 4.
Not Defective
2014 International Conference on Information Systems and Computer Networks
131
TABLE IV. PERFORMANCE COMPARISON OF PREDICTIVE MODEL Kernel Performance Measure Parameters Function Accuracy Sensitivity Specificity Precision FMeasur e 79.10% 88.24% 61.68% 81.45% 84.70% Linear 77.94% 71.96% 84.12% 80.91% Polynomial 75.88% 99.10% 99.43% 97.46% 99.43% 99.43% Gaussian
Figure 2 shows the different performance parameter comparison of predictive model using Linear, Polynomial and Gaussian kernel function. Figure indicates that Predictive model with Gaussian kernel function achieved better performance as compare to other methods. 120.00% 100.00% 80.00% 60.00% 40.00% 20.00% 0.00%
Linear Polynomial Gaussian
VII. CONCLUSION The presence of defects in a software module affect the quality of software product which further responsible for high development and maintenance costs, poor customer satisfaction and also cause failures in software products. Software defect prediction ensures the developer and also the client/end user for a better quality of product. In this paper, we predict the defects in a software modules using Twin Support Vector Machine which is an effective prediction approach in both data mining and machine learning. This research work analyzes the performance of proposed software defect prediction model using Accuracy, Sensitivity, Specificity, Precision and F-Measure for different kernel function. Twin Support Vector Machine based software defects prediction model using Gaussian kernel function obtains better performance as compare to earlier proposed approaches of software defect prediction.
F-Measure
Precision
Specificity
Sensitivity
Accuracy
REFERENCE
Performance Measure Parameters Fig. 2 Result comparison of predictive model using different kernel function
In this paper, we also analyzed the performance of proposed predictive model of software defect prediction with other prediction model proposed earlier for the PROMISE CM1 data. Table 5 indicates the performance comparison of proposed model with earlier existing classifiers for PROMISE CM1 Dataset. TABLE V. PERFORMANCE COMPARISON OF PROPOSED MODEL WITH EARLIER PREDICTIVE MODEL FOR PROMISE CM1 DATASET Reference Method Accuracy This study TSVM 99.10% SVM 90.69% LR 90.17% Karim O. Elish, and KNN 83.27% Mahmoud O. Elish [3] MLP 89.32% RBF 89.91% BBN 76.83% NB 86.74% RF 88.62% DT 89.82% Hamdi and Ghouti [11] SVM 90.16% PNN 93.17%
[1]. Fenton, N. E., & Pfleeger, S. L., Software metrics: a rigorous and practical approach. PWS Publishing Co., 1998. [2]. Koru, A., Liu, H., Building effective defect-prediction models in practice. IEEE Software, 23–29, 2005. [3]. Karim O. Elish and Mahmoud O. Elish, “Predicting defect-prone software modules using support vector machines”, The Journal of Systems and Software 81 (2008) 649–660. [4]. Jayadeva R, Khemchandani R, Chandra S, Twin Support vector Machine for pattern classification. IEEE Trans Pattern Anal Mach Intell 29(5):905-910, 2007. [5]. K.R. Muller & S Mika, An Introduction to Kernel-Based Learning algorithms,” IEEE Trans on Neural Networks, 12(2), pp.199-222, 2001. [6]. M. Halstead, Elements of Software Science. Elsevier, 1997. [7]. T. McCabe, A complexity measure, IEEE Transaction on Software Engineering, vol.2, no.4,pp 308-320,1976 [8]. Syed A. Shah, M. Morisio and M. Torchiano, An overview of Software Defect Density: A Scoping Study, IEEE, 19th Asia- Pacific Software Engineering Conference, 2012. [9]. Zhen Yan, Xinyu Chen, and Ping Guo,Software Defect Prediction Using Fuzzy Support Vector Regression”, Springer-Verlag Berlin Heidelberg 2010. [10]. Puneet Jai Kaur and Pallavi, Data Mining Techniques for Software Defect Prediction, International Journal of Software and Web Sciences (IJSWS), ISSN (Online): 2279-0071, 2013. [11]. H. A. Al-Jamimi and L. Ghouti, Efficient prediction of software fault proneness modules using support vertor machines and probabilistic neural networks”, IEEE, 5th Malaysian Conference in Software Engineering(MySEC), 2011. [12]. V.B. Singh and K.K. Chaturvedi, Entropy based bug prediction using support vector regression”, IEEE, 2012. [13]. H. Can, X. Jianchun, Z.R.L. Juelong, Y. Quiliang and X. Liqiang, A new model for software defect prediction using particle swarm optimization and support vector machine, IEEE, 2013. [14]. CM1 dataset.http://promise.site.uottawa.ca/SERepository/datasetspage.html. Accessed : 10th September 2013. [15]. Witten, I., Frank, E., 2005. Data Mining: Practical Machine Learning Tools and Techniques, second ed. Morgan Kaufmann, San Francisco.
2014 International Conference on Information Systems and Computer Networks
132