AN EXTENDED EVALUATION FRAMEWORK FOR NEURAL NETWORK PUBLICATIONS IN SALES FORECASTING Sven F. Crone
Dieter B. Preßmar
Lancaster University Management School Lancaster, LA1 4YX United Kingdom
[email protected]
University of Hamburg VMP 5, 20146 Hamburg Germany
[email protected]
ABSTRACT
While artificial neural networks (NN) promise superior performance in forecasting theory, they are not an established method in business practice. The vast degrees of freedom in modeling NNs have lead to countless publications on heuristic approaches to simplify modeling, training, network selection and evaluation. However, not all studies have conducted experiments with the same scientific rigor, limiting their relevance to further NN research and practice. Consequently, we propose a systematic evaluation to identify successful heuristics and derive sound guidelines to NN modeling from publications. As each forecasting domain of predictive classification or regression imposes different heuristics on specific datasets, a literature review is conducted, identifying 47 publications within the homogeneous business domain of sales forecasting and demand planning out of 4790 publications within the domain of NN forecasting. The identified publications are evaluated through a framework regarding their validity in experiment design and reliability through documentation, in order to identify and promote preeminent publications, derive recommendations for future experiments and identify gaps in current research and practice. KEYWORDS Neural networks, Forecasting, Prediction, Literature review, Evaluation Framework 1.
Introduction
Artificial Neural networks (NN) have achieved state-of-theart performance in non-linear prediction, classification and clustering in management science [1-3]. In forecasting, theoretical research on NN receives unabated interest, leading to successful applications in time series as well as causal modelling across various problem domains, including sales forecasting and demand planning [4-7]. NNs promise attractive features to business forecasting, being a data driven learning machine, permitting universal approximation [8] of arbitrary linear or nonlinear functions from examples without a priori assumptions on the model structure, often outperforming the conventional statistical approaches of ARIMA- or exponential smoothing methods. Despite their theoretical capabilities, NN are not an established forecasting
method in business practice. Scepticism on NN persist through mathematical complexity and missing transparency, in addition to inconsistent research findings and pessimistic reports on their performance [9, 10], in part due to a trialand-error modelling process [11]. NNs offer vast degrees of freedom in the modelling process, requiring a multitude of interdependent decisions on parameter-settings to assure valid and reliable performance. Since a complete enumeration of all parameter combinations often induces prohibitively high computation time, various heuristic modelling approaches, empirical guidelines, rules of thumb and simple tricks have been proposed, suggesting alternative approaches to determine the architecture, guide the training process and select appropriate models to minimize the objective function [10, 12-15], each with varying success. Unfortunately, no single heuristic has demonstrated its ability to deliver valid and reliable forecasts on arbitrary datasets. Consequently, the task of modelling NNs for a particular prediction problem is considered as much an art as a science [9, 10]. In addition, each heuristic should be evaluated specifically within its application domain in order to derive robust recommendations for valid and reliable predictions. However, not all experiments have been conducted with the same scientific rigor, often questioning results and performance along with the heuristic proposed. Following, we propose an evaluation framework for publications on NN in business forecasting, to allow a distinction between superior publications prepared with necessary scientific rigor in experiment design, execution and documentation from less objective results. The framework aims to evaluate the validity and reliability of a publication through the degree of documentation and it adherence to essential prerequisites to produce valid results. We focus our analysis on point-predictions of customer demand or sales as needed in all operational systems dedicated to demand planning, inventory management or advanced planning in industry, wholesale and retail. The framework is applied to 47 publications on sales forecasting, identified from a systematic literature review and evaluation of 4790 papers in the general domain of forecasting with NNs, in order to evaluate and identify publications with limited scientific rigor leading to suboptimal recommendations and heuristics. Following a description of the Literature review in section 2, we develop our evaluation framework regarding the
reliability and validity of each publication. Section 4 assesses the individual publications within the evaluation framework. Conclusions are given in section 5. 2.
Literature Review
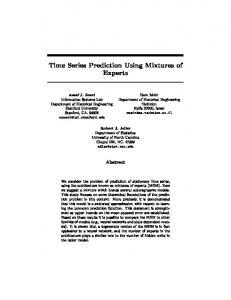
A selection of Literature reviews of NNs have been published, focussing on business applications [16-20], particular application domains [21-28] and recently forecasting [11, 29]. Following Adya and Collopy’s survey and evaluation, we seek to extend an earlier review of the ISI web of science [30] with a revised search phrase and across additional catalogues for citations of the recent years, searching a total of 39.3 million publication records. Our extended keyword search on neural networks in forecasting 1 yielded 2905 journal publications (conducted 10/2005) 2 . In addition, we extended our search to the ISI proceedings catalogue, yielding 1885 publications. Fig.1 gives an overview of 4790 publications on NN in forecasting by year. 600
50 Total Proceedings Total Journals Sales Forecast
500
45 40 35
[citations]
400
30 300
25 20
200
15 10
100
5
2005
2004
2003
2002
2001
2000
1999
1998
1997
1996
1995
1994
1993
1992
1991
1990
1989
1988
1987
0
0 [year]
Fig.1: ISI citation analysis on neural networks for forecasting by year, the solid bar indicating journal publications, the dashed bars proceedings and the chequered bars publications in the domain of sales forecasting, numbers for 2005 are extrapolated for 4th quarter
These numbers indicate an unabated interest and continuous increase of publications on theoretical developments and practical applications of NN for forecasting across a wide range of disciplines, including earth and meteorological sciences, biological sciences, medicine and pharmaceuticals, engineering, physics and business applications. However, significant differences exist in modelling suitable architectures within each business forecasting domain, depending on the forecasting objective, application, modelling and dataset. Firstly, a variety of NN publications focus on nominal predictors for classification tasks, which require and benefit different modelling heuristics of little use to derive metric point predictions in regression type sales forecasting. In addition, sales forecasting often implies noisy time series with only a few years of monthly or weekly observations, due to structural breaks from launches, relaunches, new product introductions, listing and delistings as opposed to long time series with a high signal-to-noise ratio often found in engineering, physics or artificial time series. As specific heuristics have been developed for distinct application domains, particular applications and sets of time
series, we limit our analysis to publications to the sub-domain of sales forecasting and demand planning, in order to derive robust recommendations for valid and reliable experiments. As a keyword search within the results does not ensure a valid separation of publications, we manually evaluated and eliminated all publications related to non-business applications, nominal predictors for classifications, e.g. in data mining for credit scoring, and metric predictors not related to forecasting of unit sales, e.g. of marketing response rates, market shares, index prices or probability of class memberships. Within the subset of relevant business forecasting publications, we eliminated non-sales oriented applications, such as electrical load forecasting, financial market prediction and alternative application domains in order to derive homogeneous recommendations. From this core subset, we identified additional studies through a bottom-up follow up of references and structured searches by author name using IEEE Xlpore, ScienceDirect, EBSCO, Citeseer, Proquest, OCLC and ABI/Inform, with overlapping and additional information to ISI. Our search yielded a total of 171 publications on time series or causal point predictions in business forecasting, in the categories of general publications on point predictions including examples from business, sales, marketing, production and finance. In the domain of sales forecasting, only 47 publications focussed on sales forecasting of discrete products or services [4, 6, 7, 31-74], excluding publications of the authors from further analysis. This limited number of publications dedicated to the use of NN in business forecasting for demand planning verifies previous studies [11] and explains the large attention the sparse publications in the field receive. For example, the International Journal of Forecasting ranked publications on NN as the second and fourth most requested papers in 2001 and 2002 [75], and since then ranked two NN papers consistently in the top 15 of their quarterly bestseller list. 3.
Evaluation framework
Following, we propose an extended evaluation framework for the application of NN in business forecasting based upon to allow a distinction between superior publications prepared with necessary scientific rigor in experiment design, execution and documentation from less objective results. We extend original research by Adya and Collopy [11] and an earlier study [30] by integrating principles from the extensive experiences on systematic method evaluations through competitions in the business forecasting domain [76-78]. The derived framework may serve a variety of purposes. Firstly, the systematic evaluation of previous publications on NN for sales forecasting identifies those publications with superior quality in order to enhance progress in NN applications on their findings and to extract mutual best practice from the group of leading modelling approaches. Also, it may direct further research into the systematic reevaluation, confirmation and refinement of superior
heuristics and the re-publication of prominent but biased studies, to prevent further reuse of suboptimal designs, e.g. [79-81]. In addition, it may help to identify gaps in current research and practice through dedicated research on common or neglected problems. Moreover, users of NNs with limited experience could use the experiment design of those studies identified as superior as a guideline for their individual modeling process, avoiding common mistakes based upon suboptimal and misleading publications. Finally, the framework may serve as a guideline for robust experimental designs based on “forecasting principles” for data preprocessing, architecture selection, training and documentation of NN experiments [76]. The framework aims to evaluate the validity and reliability of a publication in two dimensions: an objective degree of reliability through documentation and a more subjective degree of validity based upon the application of verified empirical knowledge. We construct a scoring model, awarding points for reliable documentation and consideration of rules to ensure validity, to derive a classification matrix of reliable versus unreliable and valid versus invalid publications. The dimensions are described below in detail. We extend an earlier framework of a simple, unweighted scoring model by introducing a weighting scheme derived from expert feedback on the relative importance of individual issues gathered at round-table discussions. In addition, we allow for a set of fundamental flaws seriously questioning the validity of the experiment and the publication as a whole. Most notably, this refers to the frequently observed lack of or inadequate use of out-of-sample data, i.e. during parameterization through early stopping, for identifying appropriate network structures or selecting a single best topology. If the appropriate use out ex ante evaluation is not adhered to or not documented, the experimental results are seriously questionable and should be discarded. The studies not meeting these knock-out (KO) criteria will be specially marked and effectively dropped from the evaluation. 3.1. Degree of reliability through documentation In order to disseminate experiences and knowledge on modeling NNs for business forecasting the experiments must be reliable. To assure reliability, published experiments should allow their unbiased interpretation, reevaluation, reconstruction and consequently consistent results in resimulation through sufficient documentation. Following, we consider reliability to be the degree, to which independent experiments using the same network, datasets, parameters and modeling heuristics lead to consistent results limiting measurement or documentation errors. This necessitates a sufficient documentation of all free parameters and heuristics applied in model building, training and application. We developed 5 categories with 30 unweighted criteria to sufficiently characterize an NN forecasting experiment: 1) Data Selection and Preprocessing a) Data type & origin documented
b) Uni- (time series) or multivariate data (causal) c) Removal of trend and/or seasonality from data* d) Scaling of Data* e) Amount of observations used for training f) Amount of observations used for validation g) Amount of observations used for testing 2) Network Architecture a) Number of input units used for all architectures b) Number of hidden units used for all architectures c) Number of output units used for all architectures d) Number of layers of nodes used from in- to output e) Transfer function used in hidden layers f) Output function used in output layer g) Shortcut connections (inputÆ output layer) used* h) Iterative t+1 or multiple-step-ahead forecasts i) Architecture (in-hidden-out) of best network 3) Network Training a) number of lagged & explanatory variables b) Number of iterations / epochs of data presentation c) Training method used for parameterization d) Objective / error function used for minimization e) (Early) stopping criteria used in training * f) Number of re-initializations for successive training g) Size of learning rate h) Size of momentum term 4) Network Architecture Selection a) Method used to find optimal network * b) Method to find the “optimum” number of input units c) Heuristic to determine ratio input to hidden units* 5) Network Evaluation a) Training Error and/or Validation error b) Test error for generalization c) Robustness of errors through initializations Each criterion is attributed one point if reported and documented. For attributes allowing alternatives or choices, e.g. in preprocessing data through optional scaling or trendremoval, a criterion is marked with * and a point is accredited if a method was used and the name or description of the method used was given as well as stating that no scaling had taken place, with no point given if scaling was not mentioned at all. During evaluation, no assumptions of implicit modeling are made; e.g. if an author reports using the backpropagation learning algorithm, we do not presume use of a logistic transfer function as originally proposed by [82]. In order to gain all points, the learning rule used and the transfer function must be reported separately. The maximum score achievable is 30 points for complete documentation of the experiments. 3.2. Degree of validity through experiment design As a second criterion, we attempted to determine the degree of validity of the experimental setup and results for the field of business forecasting in sales and demand planning. We consider a publication as valid based upon its adherence to empirical rules firmly established in NN modeling as well as
c) Systematic evaluation of different NN topologies (4p.) Different NN topologies instead of a single, arbitrarily chosen architecture should be evaluated, as the NN design significantly impacts its performance. Evaluating and selecting the “best” NN architecture represents one of the dominant problems in modeling. d) Convergence of NN model (3p.) The NN needs to demonstrate robust minimization of the objective function over the training set and the validation set to show that it has continuously learned the underlying generator in the data. [11] and to identify overparameterization [35, 86]. e) Stability of NN results (2p.) The criterion of stability evaluates the robustness of the trained model through evaluation on different test datasets from re- or multiple sampling [11]. f) Use of sufficient observations in testing (1p.) Even for stationary time series training and evaluation of the ex-post performance on less than 100 observations questions the statistical validity and reliability due to the high sampling variability from noise in real data series [11]. While data availability may render this infeasible on real datasets, the experimental design needs to set aside sufficient test data, i.e. multiple seasons motivated by the time series structure or from the application problem.
business forecasting, such as the comparison to alternative forecasting methods. All criteria are weighted based upon expert evaluation at a conference round table discussion, and may therefore be subjectively biased. As deriving a metric weighting scheme appeared infeasible, we ranked each criterion. The use of hold-out data for the final evaluation is well established in both forecasting and NN domains, and constitutes a third category of KO criteria to reflect its importance on the overall experimental validity. We derive 3 categories of 12 criteria, allowing a maximum of 42 points. 1) Validity of Forecasting Experiment Setup a) Comparison of NNs with established methods (6p.) Relative performance between competing NN models must be evaluated against benchmark methods such as the naïve (random walk) and standard statistical methods established in the empirical domain, such as exponential smoothing or ARIMA methods [11]. b) Use of alternative non-quadratic error measures (5p.) Different error measures induce different biases in evaluation forecasting performance. Consequently, various error measures should be used for evaluation, while quadratic error measures should be avoided [83]. c) Evaluation of multiple time origins (4p.) Due to the variance in data, different models may be selected depending on the chosen time origin to split training, validation and test dataset. Consequently, performance must be evaluated and across different time origins [83]. d) Use of real time series data (3p.) In order to evaluate the performance of methods or heuristics in real world problems we need to evaluate performance on representative time series. Synthetic data does not always ensure equivalent complexities or properties as generated by real markets. e) Evaluation of adequate forecasting horizons (2p.) In case of an empirical problem requiring a forecasting horizon of more than a t+1 forecast, the forecasting performance should be evaluated by an iterative t+1 forecast based upon previous predictions or a simultaneous multiple step ahead forecast t+1,…,t+n. f) Public availability of data material (1p.) If the data is not publicly available, even if rescaled to adhere to privacy regulations, a verification of the results is impossible. Therefore, an evaluation of heuristics on public data may further its validity. 2) Validity of Neural Network Experiment Setup a) Scaling of data prior to NN training (6p.) Scaling input data towards the upper and lower bound of the transfer function is essential to facilitate convergence in training [7, 84, 85]. b) Use of multiple initializations for each NN model (5p.) In order to account for local search methods in training, each NN model must be initialized, trained and evaluated at least 10 times with randomized starting weights in order to allow robust network selection.
3) Validity of the overall Experimental Results a) Out-of-sample evaluation of NN performance (KO) Data must be split up in distinct sets for parameterization and ex ante testing, requiring three datasets of which only training and validation data may be used for early stopping and model selection [11]. The set-aside or hold-out test dataset may not be used for any decisions within the modeling process, to avoid biases. Despite lack of empirical rules the training set should consist of no less than 50% of the data [29, 35]. b) Generalization of NN model (KO) The NN needs to demonstrate robust minimization on the hold-out test data in addition to convergence, to demonstrate lack of overfitting and its ability to extrapolate values outside the learned datasets [11]. The criteria selected for the degree of validity impose certain subjectivity to our scoring model. However, most criteria represent proven or established recommendations. 4.
Application of the Evaluation framework
We applied the evaluation framework developed above to the 47 publications on sales forecasting using NNs. The results proved disappointing. Only 19% of the publicationsachieved a high score of 61-70% reliability, with half the publications achieving less or equal than 50% reliability. On the other hand, only 1 publication (2%) achieved less than 30% reliability, showing a large number of partially documented experiments. This confirms a common criticism in NN
modeling that most authors do not document their studies well enough, prohibiting a remodeling of experiments or successful NN architectures in similar problems. Table 1 gives an overview of the frequencies encountered.
publications with a high degree of documentation also took common recommendations and best practices in modeling into account. Consequently, the best publications [31, 87, 88] may be preferred as an introduction for sales forecasting problems and to derive modeling recommendations.
Tab. 1: Degree of reliability by class and frequency. 30
Class Frequency Cumulative % 60% 8 25,00% 50% 7 46,88% 30% 6 65,63% 70% 6 84,38% 40% 4 96,88% 20% 1 100,00% 0% 0 100,00% 10% 0 100,00% 80% 0 100,00% 90% 0 100,00% 100% 0 100,00%
28 26 24 22
Degree of reliability
Summery - Degree of documentation Class Frequency Cumulative % 0% 0 0,00% 10% 0 0,00% 20% 1 3,13% 30% 6 21,88% 40% 4 34,38% 50% 7 56,25% 60% 8 81,25% 70% 6 100,00% 80% 0 100,00% 90% 0 100,00% 100% 0 100,00%
20 18 16 14 12 10 8 6 4
Analyzing the degree of validity we find similar results. Over 80% of all publications did not reach half of the potential score. Even worse, only 4 publications achieved more than 60% of all points, questioning the scientific rigor applied in modeling NN for sales forecasting in general. The results are displayed in Table 2. Tab 2: Degree of validity by class and frequency Summery - Degree of validity Class Frequency Cumulative % 0% 0 0,00% 10% 0 0,00% 20% 2 6,25% 30% 9 34,38% 40% 8 59,38% 50% 8 84,38% 60% 5 100,00% 70% 0 100,00% 80% 0 100,00% 90% 0 100,00% 100% 0 100,00%
Class Frequency Cumulative % 30% 9 28,13% 40% 8 53,13% 50% 8 78,13% 60% 5 93,75% 20% 2 100,00% 0% 0 100,00% 10% 0 100,00% 70% 0 100,00% 80% 0 100,00% 90% 0 100,00% 100% 0 100,00%
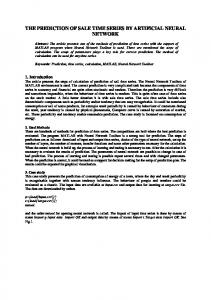
In combining both evaluations, we derive a portfolio matrix to determine the overall quality of publications in NN for sales forecasting, as displayed in fig. 3. The individual quadrants indicate publications of particular validity and reliability. It must be observed, that highly reliable studies of invalid results in the upper left quadrant may not contribute to acquired knowledge, unless its experiments are extended towards a more valid setup. In contrast, studies in the lower right quadrant display a highly valid experimental setup, yet lack reliability from sparse documentation of the studies. While this may be attributed to space restrictions or less technical focus of the journal or conference, it hinders the replicability of studies. However, these shortcomings could be amended through ex post documentation, i.e. providing setups and appendices on the web or through personal enquiry, and therefore show more promise to contribute to ongoing research. The publications in the upper right quadrant identify a category of “must read” publications. In addition to the findings above, a correlation between reliable and valid publications becomes evident, identifying that those
2 0 0 2 4 6 8 10 12 14 16 18 20 22 24 26 28 30 32 34 36 38 40 42 44
Degree of validity
Fig.2: Portfolio Analysis of the evaluation framework, with triangles denoting studies which identified ex ante testing and dots identifying studies without explicit use or mentioning of out-of-sample evaluation and
In addition to the findings mentioned above, a correlation between reliable and valid publications becomes evident, identifying that those publications with a high degree of documentation also took common recommendations and best practices in modeling into account. Consequently, the best publications [31, 87, 88] may be preferred as an introduction for sales forecasting problems and to derive modeling recommendations. Some of our findings seem particularly worth mentioning. Most surprisingly and alarmingly, only 10 publications (22%) reported the essential splitting of data into training, validation and test set for their experiments, significantly questioning their validity. Publications with a high level of validity seem more prone to respect this most important rule in modeling, regardless of time of publication [68, 69], although more recent studies tend to explicitly document this more often. The percentages given refer only to the number of publications who did report the criteria in question. Most publications focus on standard network architectures: all authors (100%) used at least one three-layered multilayer perceptron in one of their experiments, with 37 publications (84%) applying the standard backpropagation learning rule and 41 authors (94%) using only 1 output unit and one-stepahead forecasts. In internal processing, 41 authors (93%) preferred the sigmoid transfer function in hidden nodes with 50% of the authors using the sigmoid function as an output function, 42% using the linear function and 8% applying the hyperbolic tangent. Interestingly, although 42 authors (96%) constructed and compared more than one NN topology, only 18 (41%) reported their best network topology, questioning the relevance of the published results for others. In 35 publications (81%) the NN results were compared to other forecasting methods as a benchmark, such as naïve,
ARIMA or regression models, with NNs outperforming the other methods in 40 publications (92%). However, dominance of NNs over conventional methods may not be derived from this, especially as 2 of the 6 best studies in reliability and validity show only mixed results. Considering preprocessing of data, only 20 (47%) of the publications reported scaled data, with only 13 publications (30%) removing trend and seasonality, 26 (60%) removing trend and/or seasonality for some experiments and 4 (10%) stating that trend and seasonality were not removed on purpose. 17 authors (40%) reported that the data used is publicly available. Most authors evaluated their predictions by only one error measure, with no error measure dominating for the ex-post evaluation. The mean-squared error, mean square percentage error, rooted mean square error, mean absolute error, mean absolute percentage error and other error measures were used, despite obvious shortcomings of using only one error measure, and especially squared error measures, despite a substantial discussion in the business forecasting domain. Most disappointingly, no publication reported the NNs ability to generalize and only 3 (6%) reported that their results were stable without documenting to what extent. While it is not surprising, that most NN research originating in the disciplines of Physics, Engineering and biological Neuroscience are unaware of basic principles in Business Forecasting [76], leading to questionable publications, most publications in the domain of sales forecasting itself seem to omit research findings from the application domain. 5.
Conclusion
We developed an evaluation framework to evaluate the overall quality of publications in the field of business forecasting with an evaluation in the domain of sales forecasting for demand planning. Our analysis demonstrates that most publications lack the necessary degree of documentation as well as scientific rigor to allow valid and reliable analysis of competing NN architectures, learning schemes and heuristics. The majority of the relevant publications do not allow a re-simulation from the published experiment design, questioning their findings. In addition, most publications show a lack of validity, not following necessary policies when modeling and implementing NNs. Combining the findings of reliability and validity, a correlation of the degree of rigor used in documentation with the degree of validity becomes evident, hinting that some authors follow a scientific approach to publishing NN experiments while others endanger the progress in research and application of NNs for forecasting through suboptimal experiments. As a large proportion of publications on sales forecasting seem to disregard established practices and recommendations within their domain, this rather disturbing ‘state-of-the-art” in NN forecasting indicates the need for more attention and further research to the matter.
For further research, we seek to extend our current analysis to incorporate a more valid weighting scheme for criterion validity and reliability, using conjoint analysis at an upcoming conference special session. In analyzing the results, we need to distinguish further between conference and journal publications. In addition, we seek to relate the achieved score in validity and reliability to the publishing institution and media, possibly indicating differences in scientific rigor between journals of different rank and conferences of different esteem. For future publications, we recommend an emphasis on documenting models, processes, experiment design and results as well as taking knowledge from the domain of NN modeling and business forecasting into consideration. We hope that our framework may contribute as a guide to future experiment designs, disseminate knowledge between the domains and to pinpoint publications with high validity and reliability for future applications and research. 6.
References
[1] L. C. Jain and V. Vemuri, Industrial applications of neural networks. (Boca Raton: CRC Press, 1999.) [2] B. Kappen and S. Gielen, Neural networks: best practice in Europe: proceedings of the Stichting Neurale Netwerken Conference 1997, Amsterdam, the Netherlands, 22 May 1997. (Singapore; River Edge, N.J.: World Scientific, 1997.) [3] P. J. G. Lisboa, B. Edisbury, and A. Vellido, Business applications of neural networks: the state-of-the-art of realworld applications. (Singapore; River Edge, 2000.) [4] F. M. Thiesing, Analyse und Prognose von Zeitreihen mit neuronalen Netzen. (Aachen: Shaker, 1998.) [5] F. M. Thiesing and O. Vornberger, Forecasting Sales Using Neural Networks Computational Intelligence, Proc. of Proceedings International Conference, 5th Fuzzy Days, Dortmund, Germany, 1997.321-328 [6] F. M. Thiesing and O. Vornberger, Sales forecasting using neural networks, Proc. of Neural Networks,1997., International Conference on, 1997.2125-2128 vol.4 [7] Z. Tang and P. A. Fishwick, Feed-forward Neural Networks as Models for Time Series Forecasting, ORSA Journal on Computing, vol. 5, pp. 374-386, 1993. [8] K. Hornik, M. Stinchcombe, and H. White, Multilayer Feedforward Networks are Universal Approximators, Neural Networks, vol. 2, pp. 359 - 366, 1989. [9] C. Chatfield, Neural Networks - Forecasting Breakthrough or Passing Fad, IJF vol. 9, pp. 1-3, 1993. [10] G. Zhang, B. E. Patuwo, and M. Y. Hu, Forecasting with artificial neural networks: The state of the art, International Journal of Forecasting, vol. 14, pp. 35-62, 1998. [11] M. Adya and F. Collopy, How effective are neural networks at forecasting and prediction? A review and evaluation, Journal of Forecasting, vol. 17, pp. 481-495, 1998. [12] A. Lapedes, R. Farber, and Los Alamos National Laboratory., Nonlinear signal processing using neural networks prediction and system modelling. Los Alamos, NM: Los Alamos, 1987. [13] A. S. Weigend, Predicting Sunspots and Exchange Rates with connectionist Networks, in Nonlinear modeling & forecasting, M. Casdagli and S. Eubank, Eds. New York, 1992, pp. 395-432.
[14] C. de Groot and D. Wurtz, Analysis of univariate time series with connectionist nets: A case study of two classical examples, Neurocomputing, vol. 3, pp. 177-192, 1991. [15] G. E. P. Box and G. M. Jenkins, Time series analysis; forecasting and control. (San Francisco: Holden-Day, 1970.) [16] K. Krycha, A comparison of standard methods with a neural network approach to forecast univariate time series. (Wien: Institut für Höhere Studien, 1992.) [17] B. K. Wong, T. A. Bodnovich, and Y. Selvi, Neural network applications in business: A review and analysis of the literature, Decision Support Systems, vol. 19, pp. 301-320, 1997. [18] B. K. Wong, V. S. Lai, and J. Lam, A bibliography of neural network business applications research: 1994-1998, Computers & Operations Research, vol. 27, pp. 1045-1076, 2000. [19] B. Widrow, D. E. Rumelhart, and M. A. Lehr, Neural Networks: Applications in Industry, Business, and Science, Communications- Acm, vol. 37, pp. 93, 1994. [20] R. Sharda, Neural Networks for the Ms Or Analyst - An Application Bibliography, Interfaces, vol. 24, pp. 116-130, 1994. [21] M. Dougherty, A Review Of Neural Networks Applied To Transport, Transportation Research Part C-Emerging Technologies, vol. 3, pp. 247-260, 1995. [22] H. S. Hippert, C. E. Pedreira, and R. C. Souza, Neural networks for short-term load forecasting: A review and evaluation, Ieee Transactions On Power Systems, vol. 16, pp. 44-55, 2001. [23] S. A. Kalogirou, Artificial neural networks in renewable energy systems applications: a review, Renewable & Sustainable Energy Reviews, vol. 5, pp. 373-401, 2001. [24] H. R. Maier and G. C. Dandy, Neural networks for the prediction and forecasting of water resources variables: a review of modelling issues and applications, Environmental Modelling & Software, vol. 15, pp. 101-124, 2000. [25] V. S. S. Vankayala and N. D. Rao, Neural Networks And Their Applications To Power-Systems - A Bibliographical Survey, Electric Power Systems Research, vol. 28, pp. 67-79, 1993. [26] B. K. Wong and Y. Selvi, Neural network applications in finance: A review and analysis of literature (1990-1996), Information & Management, vol. 34, pp. 129-139, 1998. [27] F. Zorriassatine and J. D. T. Tannock, A review of neural networks for statistical process control, Journal Of Intelligent Manufacturing, vol. 9, pp. 209-224, 1998. [28] H. Wei, K. K. Lai, Y. Nakamori, and S. Y. Wang, Forecasting foreign exchange rates with artificial neural networks: A review, International Journal Of Information Technology & Decision Making, vol. 3, pp. 145-165, 2004. [29] G. Zhang, B. Eddy Patuwo, and M. Y. Hu, Forecasting with artificial neural networks: The state of the art, International Journal of Forecasting, vol. 14, pp. 35-62, 1998. [30] S. F. Crone and P. C. Graffeille, An evaluation framework for publications on artificial neural networks in sales forecasting, Proc. of ICAI '04, Athens, 2004.221-227 [31] K. P. G. Alekseev and J. M. Seixas, Forecasting the air transport demand for passengers with neural modelling, Proc. ofVII Brazilian Symposium on Neural Networks, 2002.86-91 [32] I. Alon, M. Qi, and R. J. Sadowski, Forecasting aggregate retail sales: a comparison of artificial neural networks and traditional methods, Journal of Retailing and Consumer Services, vol. 8, pp. 147-156, 2001. [33] A. P. Ansuj, M. E. Camargo, R. Radharamanan, and D. G. Petry, Sales forecasting using time series and neural nets, Computers & Industrial Engineering, vol. 31, pp. 421-424, 1996.
[34] N. Baba and H. Suto, Utilization of artificial neural networks and GAs for constructing an intelligent sales prediction system, Proc. of 2000 IJCNN, IEEE-INNS-ENNS International Joint Conference on Neural Networks, 2000.565-570 vol.6 [35] K. Backhaus, B. Erichson, W. Plinke, and R. Weiber, Multivariate Analysemethoden, vol. 10. (Berlin, 2003.) [36] C.-W. Chua and G. P. Zhang, A comparative study of linear and nonlinear models for aggregate retail sales forecasting, IJPE, vol. 86, pp. 217–231, 2003. [37] J. Faraway and C. Chatfield, Time series forecasting with neural networks: A case study, in Research report 95-06 of the statistics group. University of Bath, 1995, pp. 1-21. [38] J. Faraway and C. Chatfield, Time series forecasting with neural networks: A comparative study using the airline data, Applied statistics, vol. 47, pp. 20, 1998. [39] H. Hippner, Langfristige Absatzprognosen mit Neuronalen Netzen in der Automobilindustrie, in Betriebswirtschaftliche Anwendungen des Soft Computing, J. Biethahn, A. Hönerloh, J. Kuhl, M.-C. Leisewitz, V. Nissen, and M. Tietze, Eds. Wiesbaden, 1998, pp. 81-96. [40] I. Jagielska, A neural network model for sales forecasting, Proc. of 1993 Artificial Neural Networks and Expert Systems, New Zealand, 1993.284-287 [41] J. J. Jiang, M. S. Zhong, and G. Klein, Marketing category forecasting: An alternative of BVAR - Artificial neural networks, Decision Sciences, vol. 31, pp. 789-812, 2000. [42] T. Kolarik and G. Rudorfer, Time Series Forecasting Using Neural Networks, Proc. of Proceedings of the international conference on APL, Antwerp, Belgium, 1994.86-94 [43] J. H. L. Kong and G. P. M. D. Martin, A backpropagation neural network for sales forecasting, Proc. of 1995 ICNN, IEEE International Conference on Neural Networks, 1995.1007-1011 [44] R. J. Kuo, P. Wu, and C. P. Wang, An intelligent sales forecasting system through integration of artificial neural networks and fuzzy neural networks with fuzzy weight elimination, Neural Networks, vol. 15, pp. 909-925, 2002. [45] R. J. Kuo and K. C. Xue, A decision support system for sales forecasting through fuzzy neural networks with asymmetric weights, Decision Support Systems, vol. 24, pp. 105-126, 1998. [46] R. J. Kuo and K. C. Xue, Fuzzy neural networks with application to sales forecasting, Fuzzy Sets and Systems, vol. 108, pp. 123-143, 1999. [47] J. T. Luxhoj, J. O. Riis, and B. Stensballe, A hybrid econometric-neural network modeling approach for sales forecasting, International Journal of Production Economics, vol. 43, pp. 175-192, 1996. [48] K. Nam and T. Schaefer, Forecasting international airline passenger traffic using neural networks, 1995.) [49] K. Nam, J. Yi, and V. R. Prybutok, Predicting airline passenger volume, The Journal of Business Forecasting Methods & Systems, vol. 16, pp. 14-16, 1997. [50] H. L. Poh and T. Jasic, Forecasting and analysis of marketing data using neural networks: a case of advertising and promotion impact, Proc. of Artificial Intelligence for Applications, 1995. Proceedings., 11th Conference on, 1995.224-230 [51] T. Ragg, W. Menzel, W. Baum, and M. Wigbers, Bayesian learning for sales rate prediction for thousands of retailers, Neurocomputing, vol. 43, pp. 127-144, 2002. [52] F. M. Thiesing, U. Middelberg, and O. Vornberger, Parallel Back-Propagation for Sales Prediction on Transputer Systems, Proc. of Proceedings World Transputer Congress '95, Harrogate, UK, 1995.318-331
[58] S. Thornassey, M. Happiette, and J. M. Castelain, Three complementary sales forecasting models for textile distributors, Proc. of Systems, Man and Cybernetics, 2002 IEEE International Conference on, 2002.5 pp. vol.6 [59] D. H. F. Yip, E. L. Hines, and W. W. H. Yu, Application of artificial neural networks in sales forecasting, Proc. of Neural Networks,1997., n, 1997.2121-2124 vol.4 [60] M. Yohda, M. Saito-Arita, A. Okada, R. Suzuki, and Y. Kakemoto, Demand forecasting by the neural network with discrete Fourier transform, 2002. ICDM 2002. Proceedings. 2002 IEEE International Conference on, 2002.779-782 [61] L. A. Sztandera, C. Frank, A. Garg, and A. Raheja, Statistical and neural network forecasts of apparel sales, in Intelligent Information Processing And Web Mining, Advances In Soft Computing. Heidelberg: Physica, 2003, pp. 321-329. [62] E. Ong and A. Flitman, Using neural networks for sales forecasting: A comparison of methods, in Progress In Connectionist-Based Information Systems, Vols 1 And 2. Singapore: Springer Singapore Pte Ltd, 1998, pp. 1305-1308. [63] P. C. Chang, Y. W. Wang, and C. Y. Tsai, Evolving neural network for printed circuit board sales forecasting, Expert Systems With Applications, vol. 29, pp. 83-92, 2005. [64] A. Kotsialos, M. Papageorgiou, and A. Poulimenos, Long-term sales forecasting using Holt-Winters and neural network methods, Journal Of Forecasting, vol. 24, pp. 353-368, 2005. [65] R. J. Kuo, A sales forecasting system based on fuzzy neural network with initial weights generated by genetic algorithm, EJOR, vol. 129, pp. 496-517, 2001. [66] R. J. Kuo and K. C. Xue, An intelligent sales forecasting system through integration of artificial neural network and fuzzy neural network, Computers In Industry, vol. 37, pp. 1-15, 1998. [67] B. Muller, Neural networks as a means of precise day-to-day sales prediction for milk products, Kieler Milchwirtschaftliche Forschungsberichte, vol. 49, pp. 85-94, 1997. [68] T. Hill, M. Oconnor, and W. Remus, Neural network models for time series forecasts, Management Science, vol. 42, pp. 1082-1092, 1996. [69] K. P. Liao and R. Fildes, The accuracy of a procedural approach to specifying feedforward neural networks for forecasting, Computers & OR, vol. 32, pp. 2151-2169, 2005. [70] G. P. Zhang and M. Qi, Neural network forecasting for seasonal and trend time series, European Journal Of Operational Research, vol. 160, pp. 501-514, 2005. [71] S. F. Crone, Training artificial neural networks for time series prediction using asymmetric cost functions, in Iconip'02: Proceedings Of The 9th International Conference On Neural Information Processing - Computational Intelligence For The E-Age. Singapore: Nanyang Univ, 2002, pp. 2374-2380. [72] S. F. Crone, A business forecasting competition approach to modeling artificial neural networks for time series prediction, in Ic-Ai '04 & Mlmta'04, Vol 1 And 2, Proceedings. Athens: C S R E A Press, 2004, pp. 207-213. [73] F. M. Thiesing and O. Vornberger, Forecasting Sales Using Neural Networks Computational Intelligence, Proc. of 5th International Conference, Dortmund, Germany, 1997.321-328 [74] F. M. Thiesing and O. Vornberger, Sales forecasting using neural networks, Proc. of 1997 International Conference on Neural Networks, 1997.2125-2128 vol.4 [75] Elsevier, Top requested papers of the International Journal of Forecasting, vol. 2003. online www, http://www.elsevier.com/homepage/sae/econworld/econbase/int for/frame.htm: Elsevier, 2003.
[76] J. S. Armstrong, Principles of forecasting: a handbook for researchers and practitioners, in International series in operations research & management science; 30. Boston; London: Kluwer Academic, 2001, pp. xii, 849. [77] R. Fildes, M. Hibon, S. Makridakis, and N. Meade, Generalising about univariate forecasting methods: further empirical evidence, International Journal of Forecasting, vol. 14, pp. 339-358, 1998. [78] S. Makridakis and M. Hibon, The M3-Competition: results, conclusions and implications, International Journal of Forecasting, vol. 16, pp. 451-476, 2000. [79] T. Hill, M. O'Connor, and W. Remus, Neural network models for time series forecasts, Management Science, vol. 42, pp. 1082-1092, 1996. [80] J. Faraway and C. Chatfield, Time series forecasting with neural networks: A comparative study using the airline data, Journal of the Royal Statistical Society Series C-Applied Statistics, vol. 47, pp. 231-250, 1998. [81] W. Remus and M. O'Connor, Neural networks for time-series forecasting, in Principles of forecasting: a handbook for researchers and practitioners, J. S. Armstrong, Ed. Boston; London: Kluwer Academic, 2001, pp. 245-258. [82] D. E. Rumelhart, J. L. McClelland, and University of California San Diego. PDP Research Group., Parallel distributed processing: explorations in the microstructure of cognition. (Cambridge, Mass.: MIT Press, 1986.) [83] L. J. Tashman, Out-of-sample tests of forecasting accuracy: an analysis and review, International Journal of Forecasting, vol. 16, pp. 437-450, 2000. [84] I. Kaastra and M. Boyd, Designing a neural network for forecasting financial and economic time series, Neurocomputing, vol. 10, pp. 215-236, 1996. [85] H. R. Maier and G. C. Dandy, Neural networks for the prediction and forecasting of water resources variables: a review of modelling issues and applications, Environmental Modelling and Software, vol. 15, pp. 101-124, 2000. [86] Z. Tang, C. De Almeida, and P. A. Fishwick, Time series forecasting using neural networks vs. Box-Jenkins methodology, Simulations, vol. 57, pp. 303-310, 1991. [87] J. Faraway and C. Chatfietd, Time series forecasting with neural networks: A comparative study using the airline data, Applied statistics, vol. 47, pp. 20, 1998. [88] J. Faraway and C. Chatfield, Time series forecasting with neural networks: A case study., in Research report 95-06 of the statistics group. University of Bath, 1995, pp. 1-21.
1
2
The extended search term was [title=(((neural AND net*) OR perceptron*) AND (forecast* OR predict* OR time-ser* OR time w/2 ser* OR timeser* OR time ser*))] The relevant wildcard were considered for alternative search engines. The ISI web of science includes 35.5 million citations from the Science Citation Index Expanded (SCI-Expanded, 1945 to 10/2005), Social Sciences Citation Index (SSCI, 1956 to 10/2005) and the Arts & Humanities Citation Index (A&HCI, 1975 to 10/2005t), excluding publications from the fourth quarter of 2005. The ISI catalogue of Science & Technology proceedings covers 3.7 million entries (from 1990 to 10/2005) As only selected conference publications are expected prior between the 1986 popularisation of backproagation the following resurgence in research interest, the combined ISI web of Knowledge coverage seems representative.