Four-dimensional noise reduction using the time series of medical computed tomography datasets with short interval times: a static-phantom study Tatsuya Nishii1 , Atsushi K. Kono1 , Wakiko Tani2 , Erina Suehiro2 , Noriyuki Negi2 , Satoru Takahashi1 and Kazuro Sugimura1 1 2
Department of Radiology, Kobe University Graduate School of Medicine, Kobe, Japan Division of Radiology, Center for Radiology and Radiation Oncology, Kobe University Hospital, Kobe, Japan
ABSTRACT
Submitted 24 October 2015 Accepted 21 January 2016 Published 9 February 2016
Backgrounds. This study examines the hypothesis that four-dimensional noise reduction (4DNR) with short interval times reduces noise in cardiac computed tomography (CCT) using ‘‘padding’’ phases. Furthermore, the capability of reducing the reduction dose in CCT using this post-processing technique was assessed. Methods. Using base and quarter radiation doses for CCT (456 and 114 mAs/rot with 120 kVp), a static phantom was scanned ten times with retrospective electrocardiogram gating, and 4DNR with short interval times (50 ms) was performed using a postprocessing technique. Differences in the computed tomography (CT) attenuation, contrast-to-noise ratio (CNR) and spatial resolution with modulation transfer function in each dose image obtained with and without 4DNR were assessed by conducting a Tukey–Kramer’s test and non-inferiority test. Results. For the base dose, by using 4DNR, the CNR was improved from 1.18 ± 0.15 to 2.08 ± 0.20 (P = 0.001), while the CT attenuation and spatial resolution of the image of 4DNR did not were significantly inferior to those of reference image (P < 0.001). CNRs of the quarter-dose image in 4DNR also improved to 1.28 ± 0.11, and were not inferior to those of the non-4DNR images of the base dose (P < 0.001). Conclusions. 4DNR with short interval times significantly reduced noise. Furthermore, applying this method to CCT would have the potential of reducing the radiation dose by 75%, while maintaining a similar image noise level.
Corresponding author Tatsuya Nishii,
[email protected] Academic editor Ferdinand Frauscher Additional Information and Declarations can be found on page 12 DOI 10.7717/peerj.1680 Copyright 2016 Nishii et al. Distributed under Creative Commons CC-BY 4.0 OPEN ACCESS
Subjects Cardiology, Radiology and Medical Imaging Keywords Image quality, Computed tomography, Radiation dose, Temporal noise reduction,
Cardiac CT
INTRODUCTION Four-dimensional noise reduction (4DNR) is a powerful post-processing method of reducing noise by employing spatial–temporal analysis. Large noise reduction using time analysis is well known in other fields such as video processing. Noise and artifacts can appear randomly in the temporal direction. By adopting temporal filtering with an appropriate estimation of motion (Brailean et al., 1995), the effect of random noise is minimized.
How to cite this article Nishii et al. (2016), Four-dimensional noise reduction using the time series of medical computed tomography datasets with short interval times: a static-phantom study. PeerJ 4:e1680; DOI 10.7717/peerj.1680
Several filtering methods have been recently proposed for the 4DNR of medical images (Liu et al., 2009) and can be used for a four dimensional dataset with any medical imaging modality such as CT. For the CT datasets, because not only the volume dataset but also temporal axis data are required, only multi-data acquisition examination has been considered for the application of 4DNR. Thus, 4DNR is generally performed for time series of volume datasets having a relatively long interval time (e.g., 1000 ms), such as datasets of computed tomography (CT) perfusion examinations (Li et al., 2014a; Li et al., 2014b; Corcuera-Solano et al., 2014). However, the applicability of 4DNR to time series of CT volume datasets with short interval times has not been fully discussed (Otton et al., 2013; Tatsugami et al., 2015). In contrast to the case for datasets having long time intervals, the strong advantage of applying 4DNR in the case of short interval times is considered to be the ability to scan datasets constructed by single data acquisition. Thus, we developed a method of applying 4DNR to datasets having short interval times (≤50 ms), which we refer to as the method of obtaining a noiseless image by adaptive phase-shifted topological coherence analysis or legato. Cardiac CT (CCT) usually acquires datasets that include ‘‘padding’’ phases centered on the mid-diastole. From these ‘‘padding’’ phases, time-series datasets with short interval times can be easily reconstructed (Tatsugami et al., 2015). However, the additional information provided by additional phases has largely been ignored in post-processing noise reduction for CCT. Legato can be applied to such datasets to reduce noise and the radiation dose in CCT. The present study conducts quantitative image quality analysis using static ex vivo phantoms and in vivo retrospective analysis to examine the hypothesis that post processing with legato reduces the noise in CCT images and permits a lower radiation dose when using ‘‘padding’’ phases.
MATERIALS AND METHODS Study design The present study comprises from three ex vivo and four in vivo studies. The following four analyses was performed; (1) the ex vivo preliminary analysis of legato, (2) the ex vivo quantitative analysis of images post processed with legato, (3) the ex vivo assessment of the ability to reduce the radiation dose using legato, and (4) the in vivo assessment of the ability to reduce the radiation dose using legato.
Image acquisition and reconstruction Images were acquired using a 128-detector row dual-source CT device (SOMATOM Definition Flash, Siemens AG, Forchheim, Germany).
Ex vivo study Complete calibration scanning was performed before phantom data were acquired. Retrospective electrocardiogram (ECG)-gated helical scans were made of a Catphan phantom (The Phantom Factory, Salem, NY, USA), wire phantom (Quality Phantom Set, Siemens AG, Forchheim, Germany), and 330-mm-diameter water phantom in electrocardiography simulation mode (60 bpm). Each phantom was scanned ten times. The
Nishii et al. (2016), PeerJ, DOI 10.7717/peerj.1680
2/14
Table 1 Data acquisition parameters. Ex vivo Catphan
In vivo
Wire
Water
Image acquisition Collimation (mm)
0.6
Rotation speed (ms/rot)
280
Tube voltage (kVp)
120
Helical pitch Tube-current time products (mAs/rot)
1.7 456, 114
456
456
AEC:ref. 390 mAs (CARE Dose4D)
Half
Image reconstruction Slice thickness (mm)
1
3
Slice interval (mm)
1
3
Field of view (mm)
250
50
200
240
Kernels
FBP(B26f), IR(I26f)
FBP(B26f)
FBP(B26f)
IR(I26f)
Cardiac phase (ms from R wave)
−300, −250, −200
−300, −250, −200
−300, −250, −200
−800, −750, −700, −250
Notes. AEC, auto exposure control; ref., reference mAs; FBP, filtered back projection; IR, iterative reconstruction.
detailed parameters are given in Table 1. In the case of scanning the Catphan phantom, two tube current-time products were used; i.e., 456 mAs/rot as a reference radiation dose and 114 mAs/rot as a quarter radiation dose. In the case of scanning the wire and water phantom, a current-time product of 456 mAs/rot was used. The Catphan and water phantoms were positioned at the isocenter of the gantry. The wire phantom was slightly offset from the isocenter of the gantry (Ichikawa et al., 2008). For the ex vivo preliminary analysis, three phases separated by intervals of 10, 30, 50, 70 and 90 ms (each center phase was set as −250 ms relative to the R wave) were reconstructed with convolution kernels for assessment of the coronary artery employing filtered back projection (FBP) (B26f). For the other two ex vivo studies, three phases separated by intervals of 50 ms (−300, −250, −200 ms relative to the R-wave) were reconstructed with convolution kernel employing FBP and iterative reconstruction (IR) (SAFIRE, Sinogram Affirmed Iterative Reconstruction, Siemens AG, Forchheim, Germany) with strength 3 (B26f and I26f, respectively). The interval times were decided by the result of the ex vivo preliminary study, that the CNR reached a plateau at an interval time of 50 ms.
In vivo study Fifteen consecutive cases (mean age of 66.3 years; age range of 45–84 years; two females and 13 males) who underwent retrospective ECG-gated helical CCT examination with dose modulation mode in October to November 2014 were enrolled in the present study. Our institutional review board approved the study (No. 1372). Written informed consent from all subjects was waived by our institutional review board because of the retrospective nature of the study. Employing the dose modulation mode, a data acquisition was conducted using a full dose in the diastolic phase while a quarter dose was used for the systolic phase. The parameters for image acquisition are given in Table 1. If the heat rate was higher than
Nishii et al. (2016), PeerJ, DOI 10.7717/peerj.1680
3/14
75 bpm, a beta-blocker was used prior to the examination. Iopamidol (Iopamiron 370; Bayer Yakuhin, Osaka, Japan) was injected at a concentration of 370 mgI/mL via a 22-gauge catheter into the right antecubital vein at a flow rate of 22 mgI/s/kg over a period of 15 s, which was followed by a saline flush of 30 mL at the same rate. Bolus tracking was performed for a region of interest (ROI) in the ascending aorta. The scan automatically started 6 s after contrast enhancement of the ROI reached a threshold of +150 Hounsfield units (HU). The image dataset for the mid-diastolic phase (−250 ms relative to the R-wave) obtained with the reference dose and three image datasets for the systolic phase (200, 250, 300 ms relative to the R-wave) obtained with the quarter dose were reconstructed with the parameters given in Table 1.
Image post processing Two board-certified Roentgen technologists who were blinded to the subjects’ identities performed further post image processing and image analyses. For the post processing including the implementation of legato, a commercially available workstation (Ziostation 2.1.7.1 and PhyZiodynamics Technology, Ziosoft Inc., Tokyo, Japan) was used (Wai et al., 2013; Koike et al., 2014). From the three collected timeline datasets, three computed timeline datasets were calculated using ×1 for the generation of interpolated phases, a weight of 0.3 with two phases, and a non-cyclic algorithm as parameters, which we can set for the 4DNR with PhyZiodynamics Technology. PhyZiodynamics is software for nonrigid registration-based noise reduction, motion coherence and functional analysis. Noise is reduced through voxel-to-voxel mapping by tracking the temporal and spatial movement of individual voxels according to registration and interpolation algorithms (Brown, 2010). Image datasets for the center phase obtained from the collected and computed datasets are referred to as non-legato and legato images, respectively, and used in the following image analyses.
Image analysis Ex vivo preliminary analysis of legato The non-legato images scanned at 456 mAs/rot were set as reference images. The contrastto-noise ratio (CNR) of each legato image with several interval times was obtained. The CNR assessments were performed using Module CTP515 of Catphan and Image J (Schneider, Rasband & Eliceiri, 2012). Circular ROIs were set for the 0.1%, 10-mm module and the neighboring background to obtain the mean and standard deviation (SD) of the CT attenuation within the ROI. The CNR was calculated as CNR = (ROIT − ROIB )/SDB , where ROIT is the mean attenuation for the target module, ROIB is the mean attenuation for the background, and SDB is the SD of the background. In addition, to assess the difference between two-phase images for each interval form 10 to 90 ms, the mean squared error (MSE) (Zhou & Bovik, 2009) of each pixel was calculated using Image J. Ex vivo quantitative image analysis of legato The non-legato images scanned at 456 mAs/rot were set as reference images. The legato images obtained with the same radiation dose were compared with the reference image in
Nishii et al. (2016), PeerJ, DOI 10.7717/peerj.1680
4/14
terms of the CT attenuation, CNR, modulation transfer function (MTF), and noise power spectrum (NPS). The CT attenuation and CNR were assessed for the images of Module CTP515 in Catphan. Both FBP and IR images were assessed. The measurement and calculation of the CT value and CNR were the same as previously described. To assess the spatial resolution of an image, MTF and MTF10% were calculated employing the wire method and the software CTmeasure (http://www.jsct-tech.org/, 2012–2014) from the FBP image of the wire phantom. To examine the variance and spatial frequency characteristics of image noise, the NPS was measured from the FBP image of the water phantom employing CTmeasure and the radial frequency.
Ex vivo assessment of the ability to reduce the radiation dose using legato The CT value and CNR were assessed for the images of Module CTP515 in Catphan acquired at the reference radiation dose, quarter radiation dose, and quarter radiation dose using legato. The image datasets obtained with IR were used. The measurement and calculation of the CT number and CNR were the same as previously described. Furthermore, two board-certified radiologists (TN, with 7 years’ experience and AKK, with 12-years’ experience) was assessed the subjective image quality analysis by consensus reading in a blind manner. The image score was defined as the number of the modules that we could detect in each image with a slice thickness of 5 mm. In vivo assessment of the ability to reduce the radiation dose using legato Images of the diastolic phase (reference radiation dose) obtained without legato and the systolic phase (quarter radiation dose) obtained with and without legato were assessed. The circular ROI was set as the descending aorta at the level of the left atrium. The noise level as the SD of CT attenuation within the ROI was recorded.
Statistical analysis The mean and SD values of metric variables were analyzed. Differences were assessed conducting a Tukey–Kramer’s honestly significant difference test. For the equivalence test, both bounds of 95% confidence intervals (CIs) of the difference from the reference image were compared with a margin set of a CT value of 2 HU. In the non-inferiority test, the lower bounds of 95% CIs of the difference from the reference image were compared with a margin set of a CNR of 0.1, MTF10% of 0.05 cycles/mm, and SD of 1 HU. The significance level was set at P = 0.05. For statistical analysis, the software JMP9.0 (SAS Institute Japan, Tokyo, Japan) and R (R Foundation for Statistical Computing, Vienna, Austria) was used.
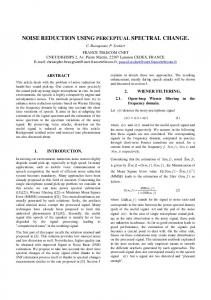
RESULTS Ex vivo preliminary analysis of legato The CNR improved with an increase in interval time from 10 to 50 ms. However, the CNR reached a plateau at an interval time of 50 ms, beyond which it did not change considerably (Fig. 1). The CNRs were 1.33 ± 0.16 for the reference image, 1.48 ± 0.18 for an interval
Nishii et al. (2016), PeerJ, DOI 10.7717/peerj.1680
5/14
Figure 1 The relationship with contrast noise ratio and interval times for legato. Legato, the method of obtaining a noiseless image by adaptive phase-shifted topological coherence analysis.
time of 10 ms, 1.90 ± 0.22 for 30 ms, 2.41 ± 0.38 for 50 ms, 2.61 ± 0.27 for 70 ms, and 2.65 ± 0.27 for 90 ms. In addition, the MSE for each interval time of 10, 30, 50, 70, and 90 was 14.0 ± 0.7, 64.9 ± 4.5, 114.2 ± 5.1, 151.0 ± 5.8, and 149.3 ± 4.9 respectively. Although, the MSE increased significantly with the interval time until 70 ms (P < 0.001), the MSEs for intervals of 70 and 90 ms were not significantly different.
Ex vivo quantitative image analysis of legato The CNR obtained with legato was significantly better than that of the reference image (1.18 ± 0.15 versus 2.08 ± 0.19, P < 0.001) (Figs. 2A, 2B and 3A). Even when employing the IR method, significant noise reduction was possible with legato (1.25 ± 0.15 versus 2.21 ± 0.22, P < 0.001) (Figs. 2C, 2D and 3B). In contrast, the CT attenuation did not change significantly when using legato (Table 2). In the assessment of spatial resolution, MTF10% obtained with legato was not inferior to that of the reference image (Table 2). Each MTF curve is shown in Fig. 4A. According to NPS analysis shown in Fig. 4B, noise was reduced equally throughout the frequency band.
Nishii et al. (2016), PeerJ, DOI 10.7717/peerj.1680
6/14
Figure 2 Reference and legato images. The original images obtained by filtered back projection (FBP) with reference dose (A), iterative reconstruction (IR) with reference dose (B), and IR with quarter radiation dose (C) are shown in upper column. By using legato, the image noise levels are significantly improved in images of FBP with reference dose (D), IR with reference dose (E), and IR with quarter radiation dose (F). Legato, the method of obtaining a noiseless image by adaptive phase-shifted topological coherence analysis.
Table 2 Results on the equivalence test and non-inferiority test. Reference
Legato
Margin
Difference [95% CI]
P value
FBP
63.4 ± 0.6
63.4 ± 0.4
2
−0.02 [−0.51–0.46]