by the Linear Discriminant Analysis and uses publicly avail- able vulnerability ... fects risk management processes of organizations and software vendors that ... Furthermore, the design decisions leading to the weights and mappings used to ...
Predictive Vulnerability Scoring in the Context of Insufficient Information Availability Hamza Ghani, Jesus Luna, Abdelmajid Khelil, Najib Alkadri, Neeraj Suri Technische Universit¨at Darmstadt, Germany {ghani, jluna, khelil, alkadri, suri}@deeds.informatik.tu-darmstadt.de
Abstract—Multiple databases and repositories exist for collecting known vulnerabilities for different systems and on different levels. However, it is not unusual that extensive time elapses, in some cases more than a year, in order to collect all information needed to perform/publish vulnerability scoring calculations for security management groups to assess and prioritize vulnerabilities for remediation. Scoring a vulnerability also requires broad knowledge about its characteristics, which is not always provided. As an alternative, this paper targets the quantitative understanding of security vulnerabilities in the context of insufficient vulnerability information. We propose a novel approach for the predictive assessment of security vulnerabilities, taking into consideration the relevant scenarios, e.g., zero day vulnerabilities, for which there is limited or no information to perform a typical vulnerability scoring. We propose a new analytical model, the Vulnerability Assessment Model (VAM), which is inspired by the Linear Discriminant Analysis and uses publicly available vulnerability databases such as the National Vulnerability Database (NVD) as a training data set. To demonstrate the applicability of our approach, we have developed a publicly available web application, the VAM Calculator. The experimental results obtained using real-world vulnerability data from the three most widely used Internet browsers show that by reducing the amount of required vulnerability information by around 50%, we can maintain the misclassification rate at approximately 5%. Index Terms—CVSS, LDA, security quantification, vulnerability assessment.
I. I NTRODUCTION The ability to accurately and quantitatively measure the criticality of vulnerabilities in a meaningful and repeatable manner allows organizations to understand their infrastructure and focus on areas where security investments can be most effective in lowering the overall risk for the business [1]. Consequently, vulnerability scoring constitutes the process for describing the risk that a specific vulnerability presents; and quantifying the criticality of vulnerabilities forms a key foundation for information security research and practice. However, in most of the cases, there is a paucity of vulnerability information needed to perform a meaningful criticality assessment. The existing approaches, e.g., [2], [3], [4] for vulnerability management do not provide sufficient support in the case of insufficient information availability. The Common Vulnerability Scoring System (CVSS [5]) is a widely used scoring system (e.g., adopted by the U.S. National Vulnerability Database – NVD – [6]) that in order to develop an accurate quantitative vulnerability assessment requires (i) a generalized information model describing the risk associated
with a vulnerability and, (ii) expert knowledge to evaluate all six parameters characterizing that vulnerability. Unfortunately, practical experience with CVSS shows that there is a paucity of vulnerability information needed to perform a meaningful criticality assessment. Actually, several months might elapse after the discovery of a vulnerability to get its detailed reports and scores published [7]. This is the case for example with zero-day vulnerabilities, which constitute a serious threat for organizations. They occur when a security flaw in code is discovered and code exploiting the flaw appears before a fix or patch is available. Additional information security measures to perform the vulnerability assessment in these cases of insufficient information availability should be taken. The lack of information to assess a vulnerability, directly affects risk management processes of organizations and software vendors that need to prioritize their efforts/investments in order to mitigate the problem. It is worth noticing that assessing a vulnerability in the case of insufficient information is useful for CVSS users, but also for other established assessment schemes such as [2], [3] and [4]. In this paper, we design and evaluate the Vulnerability Assessment Model (VAM) based on the Linear Discriminant Analysis (LDA). We show that LDA, a well established statistical method, is suitable to compute, with a high degree of confidence, a vulnerability’s score based on its characteristics, which are derived from publicly available vulnerability databases [6], [8] or information system vendors. The key advantages of applying LDA on vulnerabilities are (a) to predict the severity of a new vulnerability even if all required information is not available, and (b) to classify and to manage the resulting risk (e.g., by using a less vulnerable software) before the vulnerability scores are published. The main objective of this work is not to propose another vulnerability scoring system, but we aim to empower nonexpert users and to enhance existing scoring systems like CVSS with the techniques to assess vulnerabilities in a timely and confident manner, especially in the case of insufficient vulnerability information. Paper Contributions: Our key contribution is a novel vulnerability score prediction model that delivers a quantitative score for evaluating the criticality of security vulnerabilities, in the context of insufficient information availability. - We propose VAM, an LDA-based model that provides accurate predictive scores with less input information and gives confidence estimates on the predicted scores, reducing the
dependency on human expert knowledge. - A publicly available 1 implementation of the model, the VAM Calculator, is presented for tangible applicability of our approach. The empirical validation of our approach is demonstrated by applying it to real-world vulnerability data from the National Vulnerability Database (NVD) [6] to show the accuracy and confidence levels of the calculated vulnerability scores. - The quantitative impact of each vulnerability characteristic used to calculate the score on the quality of the results is studied and presented. We show that with less information it is possible to predict the corresponding score within specific confidence levels. Paper Organization: Section II discusses contemporary efforts on vulnerability scoring and their limitations. Our system model and basic terminology along with a brief introduction to LDA appear in Section III. In Section IV and V, we present our LDA-based VAM, and detail our approach to predict and compute a vulnerability score. The implementation (VAM Calculator) and empirical validation appear in Section VI. II. R ELATED W ORK There exist varied academic and applied approaches to manage and assess vulnerabilities. Projects described in [2], [3], or [4] define a list of detected vulnerabilities, typically ranked using qualitative assessment such as low, medium, high. As these approaches are qualitative in nature, they do not support the differentiation between vulnerabilities of the same class of severity. Other efforts [5], [9] propose quantitative metrics for calculating scores reflecting the severity of vulnerabilities based on published vulnerability reports. They introduce CVSS, which is a vulnerability scoring system to provide a standardized method for rating vulnerabilities. Furthermore, the design decisions leading to the weights and mappings used to calculate CVSS scores are discussed in [10]. Acknowledging the merits of these efforts, there is still an important open challenge of generating acceptable vulnerability scores in the absence or paucity of published vulnerability reports, e.g. in the case of zero-day vulnerabilities. Our work addresses this specific problem and proposes an approach to calculate vulnerability scores in the context of insufficient information availability. In the next section we introduce our system model as well as some basics of the terminology used throughout the paper. III. P RELIMINARIES AND BASIC T ERMINOLOGY First, we present our system model and discuss the requirements on quantitative vulnerability criticality assessment. Then, we briefly present the basics of the LDA, which constitutes the basis for our VAM. A. System Model We consider software systems that support the business processes inside public and (or) private organizations. The organizations’ assets need to be protected from attackers 1 http://quant-security.org
v1 v2
v3
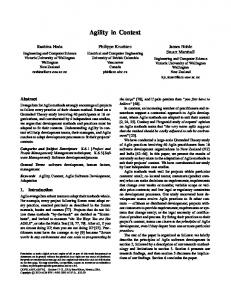
Application Software Vulnerability Repository (V):∀v ∈V:
v4
v5
v6
- v has a set of characteristics CH
Operating System v7
- v has a quantitative score - v can be classified into a risk class Fig. 1.
v8
Hardware
v9
System Model
seeking to exploit the software vulnerabilities. ISO 17799 defines a vulnerability as a “weakness of an asset or group of assets that can be exploited by one or more threats” [11]. In this paper, we consider only software vulnerabilities, but we are planning to extend this concept to hardware, cross systems and composed vulnerabilities. Figure 1 shows the different elements related to our system model. We assume the availability of experts (in general developers or system administrators) who can estimate the values of different basic characteristics/properties CH of a vulnerability v such as the impact on availability, confidentiality, and integrity, with high confidence. The considered vulnerabilities are weaknesses that can be exploited by attackers to compromise the target system. Though vulnerabilities imply deliberate exploitation, our approach can be easily used to quantify the criticality of vulnerabilities to accidental failures, provided a data set for dependability weaknesses exists analogous to the vulnerability data available in open vulnerability databases (cf. Section II). As fine-granular values of indicators and measures are often difficult to use/understand by managers and average system users, it is common to aggregate them quantitatively to a holistic score, and then to automatically map the score to n classes reflecting the criticality level of the considered vulnerability. To this end, we define risk classes r, in which each vulnerability should be classified. The number of defined classes are changeable depending on the model requirements. In order to differentiate between the considered classes, one usually defines threshold values that constitute the boundaries between the risk classes r. Without loss of generality, we propose to use an intuitive scale of three risk classes, i.e., Low, Medium, and High. In Section V we provide a solution on how to calculate the threshold values to delimit these classes. B. Design Requirements Based on the analysis of the state of the art (cf. Section II), the requirements for a predictive vulnerability assessment solution are the following: •
R1: The vulnerability assessment should predict and deliver the score for each vulnerability even if the available information about that vulnerability is insufficient, i.e., it is not possible to assess all vulnerability characteristics CH.
•
R2: The assessment model should support the quantitative
and automatic aggregation of the low-level criticality indicators/measures into one high level criticality measure. • R3: The assessment outcome should be easy to use and understand by users, developers and managers. • R4: The underlying vulnerability assessment model should be system-agnostic. • R5: The results of the vulnerability assessment should be repetitive, i.e., one should get the same result upon each assessment of the same vulnerability.
From these requirements, we propose and apply a methodology that takes an input a subset of features CH which characterize different classes of vulnerabilities, and delivers an estimated score for a new vulnerability as output. Intuitively, the accuracy of obtained predictive scores should be proportional to the number of CH taken into account for the assessment. In other words, if all CH are considered by the predictive model, then a score equal to the actual CVSS should be obtained. In the next subsection we investigate LDA, a generic statistical technique for the classification of objects. Our hypothesis is that insight into security measurements could be gained by applying analytical techniques to historical security vulnerability data (e.g., from NVD) in order to identify trends and correlations utilizing LDA, to discover unexpected relationships, and to reveal other predictive interactions that may exist. C. Basics of the Linear Discriminant Analysis In the following, we briefly present the background of LDA required to comprehend our approach. For a detailed description of the LDA approach, we refer to [12]. LDA is a multivariate method used in statistics to differentiate between two or more groups with respect to some specific variables. The objective of this method is to classify objects (vulnerabilities in our case) into one specific group (i.e., risk class) based on a set of variables, which describe the objects (i.e., CH). This property of LDA fulfills our R4. The LDA process usually comprises 5 steps that we briefly describe in the following: - Step 1: Definition of Groups G: The objective is to clearly delineate the groups from each other with respect to the variables. This assumes that the variables that are the most appropriate to separate those groups are well determined. The number of groups G should not exceed the number of the object variables. In addition, for comparability reasons, the groups should have the same covariance structure. Furthermore, enough training data (objects) should be available for each group (minimum is twice the number of the variables) [13]. - Step 2: Definition of Discriminating Function: The generic discriminant function is used to predict the group of a new observation as: n
z(x1 , x2 , ..., xn ) = ∑ ai ∗ xi i=0
(1)
where z is the so-called Discriminant Score (z-score), ai are the Discriminant Coefficients (weights) for each characteristic, and xi the estimated values of the characteristics (e.g., elements of the set CH). This property of LDA fulfills R2, and R5 as the final result does not change over time. More details on calculating these parameters is presented in Section V-C. - Step 3: Determination of the Discriminating Function Parameters: The discriminating function is formed such that the separation between the groups is maximized, and the distance within each group is minimized. - Step 4: Classification into Groups G: We use the classification procedure from Fisher [14]. The classification is a 1-1 mapping, i.e., no new observation can be mapped to two or more different elements of G. This LDA property fulfills R3 as the classification into groups (e.g., low, medium, high) is intuitively comprehensible for human users. - Step 5: Validation of Classification: To estimate the quality of classification, the probability of misclassification or error rate is used [12]. With LDA we investigate the characteristics of each vulnerability class and the mapping criteria for class membership assignments. The objective is to use the discriminant function in order to categorize a new vulnerability, for which we do not know the criticality score neither the class, based on only a subset of its characteristics. For a new vulnerability v, the z-score is a quantitative value used to classify v into one of the defined groups G. This property makes LDA suitable to be used in our vulnerability score prediction process. Even if not all the values CH are available, a vulnerability score z for v can be predicted using LDA (fulfills R1) as described in the following section. IV. V ULNERABILITY A SSESSMENT T ECHNIQUE We present a brief overview of our proposed approach for model-based predictive assessment of the severity of vulnerabilities. Furthermore, we detail the proposed model’s lifecycle, i.e., model building, use, and recalibration. A. Overview of our Approach VAM considers the specific characteristics (elements of CH) relevant to a vulnerability, and calculates a quantitative predictive score z that can give accurate information about the associated risk class r. The model describes how to calculate a numerical score for the corresponding vulnerability by substituting each one of its characteristics and associated weights into a discriminating function. The resulting score z quantifies the risk level of the vulnerability v being studied. VAM also classifies vulnerabilities according to their score into risk categories r in order to make the numeric score z intuitively comprehensible for human users, which yields a non-fuzzy classification, i.e., the metric space is partitioned by the risk categories. Typically, each model should first be built, and then maintained/recalibrated as necessary. Accordingly, we structure the remainder of this section for detailing VAM’s model building, use and recalibration operations.
B. VAM - Model Building Figure 2 depicts our 7-step vulnerability assessment model including the steps of the LDA (grey shaded in Figure 2) and extended by Step 2 and Step 7 in order to (a) address the model variable definition’s phase, which is dependent on the LDA application area, and (b) validate the results and recalibrate the model coefficients if necessary. The VAM
Step1: Definition of Risk Groups No
Observations available? Yes
Step2: Definition of Step2: Definition of Vulnerability Characteristics Vulnerability Characteristics
Step3: Selection of Observations
Step4: Estimation of Vulnerability Assessment Function
Step5: Calculation of Vulnerability Assessment Score
Step6: Classification into Groups
Step7: Model Validation Step7: Model Validation No
Accurate Results? Yes
Fig. 2. shaded
VAM-based Vulnerability Assessment - LDA-related steps are grey
building phase covers the first 4 steps of VAM (cf. Figure 2), which are the following: - Step 1 - Definition of Risk Groups r: The classes to be discriminated can be defined by some preceding analysis of the existing vulnerabilities. It is also possible to utilize the classes published by open vulnerability databases such as the National Vulnerability Database [6] and the Open Source Vulnerability Database [8], i.e., low, medium, and high. - Step 2 - Definition of Vulnerability Characteristics: The set of characteristics CH to take into account for the model is defined. As described in our vulnerability model, we consider a generic vulnerability template that fits to most known vulnerability databases and defines a wide range of characteristics (e.g., CVSS characteristics [5]). - Step 3 - Selection of the Observations: In order to train VAM, we consider a set of vulnerabilities representing the totality of an existing vulnerability collection, e.g., from a publicly available vulnerability database such as the NVD.
- Step 4 - Estimation of the Vulnerability Assessment Function: The LDA prescribes to use the defined groups and variables along with the randomly selected set of observations in order to estimate the vulnerability assessment function presented in Eq. 1.
C. VAM - Model Use: Predictive Scoring of a New Vulnerability After building the VAM model, we can use it to score and classify new vulnerabilities, e.g., zero-days even in the absence of some of its characteristics (CH). VAM can be used to label a new vulnerability v with its score z and then classifies v into one of the predefined risk classes (typically Low, Medium, High). Unlike the model building, assessing the risk of a new vulnerability requires only two key steps of the VAM model (cf. Figure 2): - Step 5 - Calculation of the Vulnerability Assessment Score: The vulnerability assessment function is utilized for calculating the vulnerability assessment score (z-score). After calculating this quantitative score for a new vulnerability, we are able to determine the group that this vulnerability belongs to. - Step 6 - Classification into Groups: The function presented in Eq. 1 is also utilized to assign a new vulnerability to one of the pre-defined classification groups. Groups are defined through the borders/thresholds separating them. The proposed model uses this function to calculate a set of threshold values, which are required to separate the criticality groups from each other. In order to compute the risk of a new vulnerability v, we utilize the automated generation of z for v provided that the values for a subset of the set of characteristics CH can be estimated by an expert. Being a z-score, the VAM-based score has no specific units of measure (see Eq. 1). D. VAM - Model Validation/Recalibration In Step 7, the z-scores calculated for the training set of known vulnerabilities are compared with the actual results from published reports about the same vulnerabilities. If the z-scores are not satisfactory, then further training sets of vulnerabilities are needed in order to enhance the accuracy of the results. In other words, a model becomes stale if Steps 2 and 4 are no longer valid (see Figure 2). Model recalibration implies that Steps 2 and 4 have to be revised as done in the model building phase. V. C ASE S TUDY: VAM M ODEL B UILDING BASED ON NVD In order to validate the proposed vulnerability score prediction methodology, in the following we apply VAM steps depicted in Figure 2 utilizing the vulnerability data made available by the NVD, which uses CVSS scores [5]. For Step 1 we adopt the widely used risk classification (Low, Medium and High), which is also used by CVSS, so that we have a common basis for comparison.
A. Step 2 - Vulnerability Model We follow a generalized vulnerability model in the sense that we consider the existing approaches (see Section II) and utilize the NVD terminology. Each vulnerability v is associated with a unique identifier (e.g., CVE-2012-1234), a text describing the actual vulnerability (incl. affected software products), and a set of characteristics CH, where each element can have a value. The expert knowledge is needed here, especially in defining the different values for each element of CH from a selection list. We utilize the following basic characteristics (elements of CH), as used by the CVSS: • • • •
•
•
Access Vector AV : Reflects how the vulnerability could be exploited. Access Complexity AC: Measures how complex it is for an attacker to exploit the existing vulnerability. Authentication Au: Reflects the level of identity verification prior to being granted access to the system. Confidentiality Impact (or Loss) C: If the vulnerability is successfully exploited, which impact has this exploitation on the data confidentiality (assets). Integrity Impact (or Loss) I: If the vulnerability is successfully exploited, which impact has this exploitation on the data integrity. Availability Impact (or Loss) A: If the vulnerability is successfully exploited, which impact has this exploitation on the availability.
B. Step 3 - Selection of Observations In order to build the model and set the coefficients of the calculating function, we need a set of observations (see Step 3 in Figure 2), which are vulnerabilities with well known CH and risk levels. We consider the vulnerabilities publicly available on the National Vulnerability Database along with their respective CVSS scores. We follow an exhaustive approach in the sense that we consider, as a global training data set, all existing NVD vulnerability entries (56639 at the time of writing this paper) in the process of training the model and calculating the coefficients of the z−function. C. Step 4 - Vulnerability Model Calibration The objective is to estimate the values of a set of characteristics (parameters) of a specific vulnerability. In order to set the parameters of the model (configure the model), a set of vulnerabilities with known scores is required. A weighing (quantification) of the parameters is also needed. Each element of CH will be denoted as an ordered set of values, where each value represents the risk level associated with that element. During the calculation process, these qualitative values (e.g., no, partial, complete impact) are mapped to quantitative values, e.g., ( 31 ; 23 ; 1) as used in this paper. For the characteristics defined in our vulnerability model, the resulting ordered sets for the qualitative values are shown below:
Access Vector AV = { l < ln < en } where: - l = Local, a local access means that the vulnerability is exploitable if the attacker has physical access to the system or a local account. - ln = Local Network, requires that the attacker has access to either the broadcast or collision domain of the vulnerable system. - en = External Network, exploitable with network access. Access Complexity AC = { h < m < l } where: - h = High, specialized access conditions exist. - m = Medium, the access conditions are less specialized. - l = Low, specialized access conditions do not exist. Authentication Au = { mi < si < n } where: - mi = Multiple instances. - si = Simple instance. - n = None. Confidentiality Impact C = { ni < p < c } where: - ni = No Impact. - p = Partial Impact. - c = Complete. Integrity Impact I = { ni < p < c } where: - ni = No Impact. - p = Partial Impact. - c = Complete. Availability Impact A = { ni < p < c } where: - ni = No Impact. - p = Partial Impact. - c = Complete.
D. Step 5 - Calculating the Vulnerability Criticality Function The vulnerability criticality function is utilized to calculate the numeric z − score (cf. Eq. 1) of a new vulnerability. It is computed based on the assigned values for the characteristic (sub)set CH of the vulnerability under assessment, just as presented in Section V-C. For the vulnerability criticality function defined in Eq. 1, a1 , a2 ,..., an are constants and consider the linear combination of the elements of the vector x from the discriminant function presented in Eq. 1. In order to set the coefficients ai for each characteristic value, we define the optimization criterion as the separation between the distributions of the set of observations to be the ratio of the variance between the classes to the variance within the classes. Adopting the LDA methodology described in [12], we calculate first y, which contains the averages of the characteristics’ values (cf. Section V-C) inside the vector y for each risk class of the training data set. � y = AV , AC, Au, C, I, A Then we use Fisher’s approach to determine the coefficients values ai , by defining the covariance matrix in the following form 2 : a11 a12 ... a1n a21 a22 ... a2n S= ... ... ... ... an1 an2 ... ann 2 The
interested reader is referred to [14] for further details.
where n is the number of CH elements (6 in our case). Then we calculate a = S−1 (y1 − y2 ), where y1 contains the average values of CH elements for the first risk class (low/medium), and y2 for the second one (high/critical), using the training data set described in Section V-B. The result is the vector a containing the coefficients ai of the z−function variables: � a = a1 , a2 , ..., ..., an Applying these coefficients, we get the final discriminating function (cf. Eq. 1). E. Step 6 - Classification into Groups The z−score resulting from applying VAM can be used to: (a) quantitatively compare two or more new vulnerabilities with respect to their criticality, and (b) rank a set of new vulnerabilities in order to prioritize them (on which ones to focus the efforts first). In order to facilitate the use and the interpretation of the z−score for users and developers, we can utilize risk classes reflecting the criticality level of the new vulnerabilities as introduced in Section IV-A (i.e., Low, Medium and, High). To classify a new vulnerability v, it is needed to calculate z and the midpoints, which are the critical measurement values that are responsible to classify a new observation (vulnerability) v to one of the risk groups that we can define. Therefore, a mapping from the NVD reports’ characteristics to the VAM characteristics is required. For this calibration phase, the average values of high (zhigh ) and low (zlow ) risk classes are used to calculate the midpoint, as shown in Eq. 2: zmid =
1 ∗ (zhigh + zlow ) 2
(2)
Using the midpoint and the maximum and minimum scores (zmax , zmin ) obtained from calibration calculations, we define three groups for high, medium and low risk classifications of vulnerabilities. The boundary between the low and medium risk class (blow,medium ) is shown in Eq. 3: blow,medium = (zmid − zmin )/2 + zmin
(3)
G. Example We consider the zero-day vulnerability CVE-2013-2743, which was published on the NVD on Apr. 2nd, 2013 and has no CVSS score at the time of writing this paper. This vulnerability is currently undergoing analysis and not all information is available. It allows remote attackers to bypass authentication via a crafted integer in the step parameter for WordPress plugins. Based on the currently available vulnerability description, we have the following values for the VAM vector y in this case (AV : en, AC : −, Au : n,C : p, I : p, A : p). Utilizing the global training data set described in Section V-B and calculating the result of the z−function using our implemented VAM tool would give a z−score of 0.81949 (81.95%, high criticality) with a confidence level 83.85% (calculated based on historical prediction data). With this predicted score a sysadmin might be able to take corrective/preventive measures (e.g., downgrading the software, or even switching to another vendor), instead of waiting for an official NVD score. In Section VI we empirically validate our approach using NVD data and evaluate its results. VI. P ROTOTYPE I MPLEMENTATION AND E MPIRICAL E VALUATION To demonstrate the real-world applicability of our approach, we have implemented VAM Calculator, a publicly available web application running on a JBoss application server. Figure 3 depicts the architecture and the building blocks of the VAM Calculator. As mentioned in Section V, our scoring methodology experiments considered in this section are based on the NVD terminology and parameters. We compare the obtained VAM scores to the corresponding CVSS scores, but in general, and as described in [15], we can use any other scoring system as a reference for the comparison. VAM Server
Application Server VAM Calculator Visualization Tool
Databases VAM Database Public Vulnerability Database (Locally stored)
Finally, the boundary bmedium,high between the medium and high risk is computed as in Eq. 4: bmedium,high = (zmax − zmid )/2 + zmid
(4)
F. Step 7 - Model Validation In our approach we perform regular updates of the local vulnerability repository from the NVD, so that the z-function coefficients vector can be recalculated and updated accordingly for more accurate vulnerability score predictions. Once VAM is built, it can be used to predict the z−scores of new vulnerabilities even in the context of insufficient information availability, i.e., if not all the values of CH are available or can be estimated.
User
Fig. 3.
National Vulnerability Database (NVD)
VAM Calculator: Building Blocks
A. VAM Calculator As depicted in Figure 3, our locally stored VAM vulnerability database contains a total number of 54161 entries, which have been downloaded from the NVD, with the following CVSS-defined criticality categories: Low = 3661, Medium = 25522, High = 24978. One of the basic functionalities of
TABLE I T RAINING DATA SETS USED IN OUR EXPERIMENTS Software Product Global Training Data Set Mozilla Firefox Google Chrome Microsoft Interner Explorer
Low/Medium Threshold Medium/High Threshold VAM CVSS
9 8
# of Vulns. 54161 754 535 412
Score
Set ID GTDS MFF GC MIE
10
7 6 5 4
10
7
9
6
8 Score
B. Experimental Results We use VAM Calculator to run several experiments of different natures. We differentiate two types of experiment campaigns (i) the first is based on our Global Training Data Set (GTDS), which contains all NVD vulnerability records independently from the affected software products, and (ii) three different software-specific training data sets sets (MFF, GC and MIE, cf. Table 1), which are associated with the three most widely used Internet browsers, namely Mozilla Firefox (from ver. 0.1 to ver. 19.0.2), Google Chrome (from ver. 0.1.38.1 to ver. 21.0.1180.57), and Microsoft Internet Explorer (from ver. 5.01:sp4 to ver. 10). These three browsers are also within the top 7 software products with the highest number of disclosed vulnerabilities in the NVD [6] (as of May 31th,
5
Fig. 6.
CVE-2011-1266
CVE-2011-1961
CVE-2011-1964
CVE-2011-1995
CVE-2011-1999
CVE-2011-2001
CVE-2011-1998
CVE-2012-0172
CVE-2012-0155
CVE-2012-1875
CVE-2012-0170
CVE-2012-1881
CVE-2012-1879
CVE-2012-1523
CVE-2012-1876
CVE-2012-1545
CVE-2011-4689
CVE-2011-1962
3
CVE-2011-1246
4 CVE-2011-1992
Fig. 4. Firefox: VAM vs. CVSS scores using the CH-Combination (AC,C,I)
7 6
CVE-2002-2435
CVE-2012-4182
CVE-2012-3983
CVE-2012-4185
CVE-2012-4188
CVE-2012-4212
CVE-2012-4191
CVE-2012-4216
CVE-2012-4214
CVE-2012-5833
CVE-2012-4218
CVE-2012-5836
CVE-2012-5842
CVE-2012-5839
CVE-2012-4202
CVE-2012-4184
CVE-2012-4205
CVE-2012-4206
CVE-2012-5830
CVE-2012-4195
CVE-2012-3986
CVE-2012-4192
CVE-2012-3985
CVE-2012-4207
CVE-2012-4209
3
CVE-2012-3987
4
CVE-2012-1882
5
Low/Medium Threshold Medium/High Threshold VAM CVSS
CVE-2011-1257
Score
8
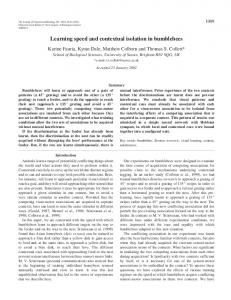
2013). Corresponding to the defined training data sets, we define evaluation data sets containing (i) 1000 vulnerabilities independently from the affected software products, and (ii) respectively 100 registered NVD vulnerabilities related to MFF, GC, and MIE. We calculate VAM scores and compare with the actual CVSS scores and classifications. VAM accuracy is assessed through the misclassification rate, which is defined as the ratio of misclassified vulnerabilities with respect to their risk classes r. Table II summarizes the obtained results for the data sets defined in Table VI-A. Our first observation is that using the product specific training data sets provides more accurate predictions (lowest misclassification rates) than using the more general GTDS set. Furthermore, we also investigate which different subsets of CH provide the most accurate predictions.
CVE-2012-0010
Low/Medium Threshold Medium/High Threshold VAM CVSS
9
Fig. 5. Chrome: VAM vs. CVSS scores using the CH-Combination (AC,C,I)
CVE-2012-1872
10
CVE-2013-0897 CVE-2013-0899 CVE-2013-0883 CVE-2012-5152 CVE-2013-0900 CVE-2012-5146 CVE-2013-0882 CVE-2013-0896 CVE-2013-0891 CVE-2013-0879 CVE-2013-0892 CVE-2013-0886 CVE-2013-0895 CVE-2013-0898 CVE-2013-0841 CVE-2013-0839 CVE-2012-5156 CVE-2012-5149 CVE-2012-5147 CVE-2012-5145 CVE-2012-5140 CVE-2013-0840 CVE-2012-5142 CVE-2012-5143 CVE-2012-5137
3
the VAM Calculator is to predict and calculate a vulnerability score. Furthermore, it might be used to calculate a vulnerability score even using less vulnerability characteristic values (i.e., CH). The calculated VAM score can be visualized together with a mapping to the corresponding CVSS scale, along with the confidence level of the calculated score. For a good visualization of the level of confidence, charts presenting the potential deviation of the calculated score to CVSS scores are visualized. The user can then compare and evaluate the vulnerability scores for every possible combination of vulnerability characteristics. The significance of every vulnerability characteristic compared to the others can be assessed through the calculated confidence level of each combination. It is also possible to visualize the best and worst characteristic combinations based on their confidence levels. The VAM Calculator described in this section was used to empirically validate our methodology. The obtained results are presented next.
IE: VAM vs. CVSS scores using the CH-Combination (AC,C,A)
For space reasons, we only show the chronologically last 50 registered NVD vulnerabilities and their respective CVSS scores in ascending order. Figures 4, 5, and 6 depict the accuracy of VAM results using the 3 vulnerability characteristics CH, which provide the most accurate score predictions, i.e., the vector (AC,C,I) for Firefox and Chrome, and the vector (AC,C,A) for IE. The highest misclassification rate is 5.23%. This means that by reducing the amount of required vulnerability information (CH values) by 50%, we maintain the misclassification rate under an acceptable threshold. The question why some vulnerability characteristic combinations provide more accurate results than others, depends on how the overall CVSS base score is calculated. While, it depends
TABLE II S UMMARY OF THE OBTAINED RESULTS - L EGEND : No. CH: CONSIDERED NUMBER OF CHARACTERISTICS , Miscl. (specific): MISCLASSIFICATION RATE USING MFF, GC, AND MIE RESPECTIVELY, Miscl. (GTDS): M ISCLASSIFICATION RATE USING GTDS. SW Product
Firefox
Chrome
Internet Explorer
No. CH 6 5 4 3 6 5 4 3 6 5 4 3
Best CH Combinations (AV,AC,Au,C,I,A) (AC,Au,C,I,A) (AC,Au,C,I) (AC,C,I) (AV,AC,Au,C,I,A) (AC,Au,C,I,A) (AC,Au,C,I) (AC,C,I) (AV,AC,Au,C,I,A) (AC,Au,C,I,A) (AC,C,I,A) (AC,C,A)
Miscl. (specific) 2.31% 3.63% 3.86% 4.71% 1.83% 2.43% 2.98% 4.89% 1.20% 1.34% 3.28% 5.23%
Miscl. (GTDS) 2.87% 4.10% 6.12% 7.92% 2.35% 2.57% 3.11% 6.64% 3.65% 4.43% 5.71% 8.42%
window of the chosen data might have different effects on results accuracy. Finally, both the VAM methodology and the Discriminant Analysis technique can be further extended to create a security metrics framework, able to provide assessment scores not only for vulnerabilities but also for security countermeasures that take into account factors such as the economic costs of (in)security. ACKNOWLEDGMENTS Research supported in part by the EC FP7 project ABC4Trust (Grant Agreement no. 257782) and Loewe TUD CASED. R EFERENCES
on the weights associated with each characteristic: according to the CVSS scoring equations [5] the weight of the CVSS Impact subscores (i.e., C, I, A) is 0.6 while the Exploitability (AV, AC, Au) is weighed with a coefficient of 0.4. On the other hand, we observed that CH combinations without the AV parameter delivered relatively accurate results. The reason seems to be that in 98% of the considered software-specific training data sets vulnerabilities, the value given to AV was exactly the same (i.e., Network), therefore “masquerading” its impact in calculating the overall CVSS score. VII. C ONCLUSIONS AND F UTURE W ORK In this paper, we have introduced VAM, a novel vulnerability assessment methodology created to objectively provide fine-grained quantifications of the risk level associated with a software vulnerability in the context of insufficient information availability. In VAM, each vulnerability is characterized by a set of features that can be quantified in order to represent an assessment score. VAM proposes the use of a Discriminant Analysis technique to map this vulnerability assessment score to a meaningful criticality class (e.g., low, medium and high), therefore easing the risk management process. One key benefit of VAM is its ability to predict the score of a new vulnerability (using a previously trained model), so it might be possible to calculate the risk associated with vulnerabilities that have not been scored yet such as zero-day vulnerabilities. Our experimental results using the NVD data of three widelyused internet browsers show that the vulnerability assessment scores obtained with VAM are congruent with those obtained via CVSS, however VAM’s level of granularity and special prediction features add an extra value not found in the existing approaches. We plan to extend VAM’s functionality in order to (1) recalibrate and correct the model w.r.t. inaccuracies that might be discovered during the model use, (2) compose the vulnerability assessment scores from different subsystems. The latter extension is of particular importance to Service Oriented Architectures and the Cloud. Furthermore, an interesting aspect to investigate concerns the training data set. Our belief is that insight into the nature of historical vulnerability data could be of interest, to determine the time window to consider while choosing the training data sets; i.e., sliding the time
[1] nCircle, “nCircle vulnerability scoring system,” http://www.ncircle.com/pdf/papers/nCircle-WP-VulnScoring-105103.pdf, 2010. [2] SANS-Institute, “SANS critical vulnerability analysis archive,” http://www.sans.org/newsletters/cva/, 2007. [3] E. Johnson et al., “Symantec global internet security threat report,” http://eval.symantec.com/mktginfo/enterprise/white papers/bwhitepaper internet security threat report xiii 04-2008.en-us.pdf, 2008. [4] Microsoft-Corp., “Microsoft security response center security bulletin severity rating system,” http://www.microsoft.com/technet/security/bulletin/rating.mspx, 2007. [5] P. Mell et al., “A complete guide to the common vulnerability scoring system,” http://www.first.org/cvss/cvss-guide.pdf, 2007. [6] NIST-Editorial-board, “National vulnerability database version 2.2,” http://nvd.nist.gov/, 2012. [7] B. Schneier, “The Vulnerabilities Market and the Future of Security,” Forbes Magazine (30 May 2012), http://www.forbes.com/sites/bruceschneier/2012/05/30/thevulnerabilities-market-and-the-future-of-security, 2012. [8] OSVDB-board, “Open source vulnerability data base (osvdb),” http://www.osvdb.org/, 2013. [9] P. Mell et al., “Common vulnerability scoring system,” in IEEE Security and Privacy, vol. 4, pp. 85–89, 2006. [10] K. Scarfone and P. Mell, “An analysis of cvss version 2 vulnerability scoring,” In Proc. of Intl. Symposium on Empirical Software Engineering and Measurement (ESEM), 2009. [11] ISO/IEC, “Information technology - code of practice for information security management,” In ISO/IEC 17799:2005, 2005. [12] A. C. Rencher, Methods of Multivariate Analysis. John Wiley & Sons, Inc., 2002. [13] K. Backhaus et al., “Multivariate Analysemethoden. Eine anwendungsorientierte Einfhrung,” Biometrical Journal, vol. 39, pp. 877–878, 1997. [14] R. A. Fisher, “The use of multiple measurement in taxonomic problems,” Annals of Eugenics, vol. 7, pp. 179–188, 1936. [15] H. Ghani et al., “Discriminant analysis based vulnerability severity measurement,” TR-TUD-DEEDS-07-07-2011, 2011.