relationships with each other making random selection and elimination of ... ambiguous answers to the questions 'What exactly is ..... and RM. Using FMEA, a number of process gaps ..... relevant process improvement framework on multiple.
Towards Improving Requirements Engineering Processes: Prioritizing Requirements Engineering Process Problems for Elimination Bhavani Palyagar, Debbie Richards Information and Communication Sciences Macquarie University Sydney, NSW 2109 Australia {bpalyaga, richards}@ics.mq.edu.au
Abstract Requirements Engineering (RE) is a process for determining stakeholder needs during the development of a software intensive system. RE process quality influences the quality of software produced due to its critical role in the Software Development Life Cycle (SDLC). This places significant importance on continuous Requirements Engineering Process Improvement (REPI). RE processes can be improved by eliminating process problems (causes) that effect poor quality requirements. Unfortunately, however, in a real-life medium or large project, the causes may be large in number, and they may have complex relationships with each other making random selection and elimination of causes inefficient and ineffective. We attempt to address this issue by a strategy to prioritize the causes such that REPI is formal and aligned against organizational goals to achieve the maximum benefit for the given resources. A large software organization that is collaborating with us in this research project has accepted this strategy for their REPI. Keywords: Requirements Engineering, Process Improvement, Process Gap, Quality Measure, Prioritization
1. Introduction Requirements Engineering (RE) is the phase in which stakeholder needs are identified and translated into system requirements [1, 2]. RE processes support RE so as to produce high quality requirements (defined as those requirements that are useful, unambiguous, accurate, complete and consistent [3, 4]). It is widely agreed amongst researchers and practitioners that RE processes have an effect on the quality of requirements
an RE activity is producing [5, 6, 7, 8, 9]. Therefore, it is important to revise RE processes to overcome their measured deficiencies based on the importance and urgency of specific improvement against involved costs. Absence of RE process measurement can lead to unclear improvement objectives. This leads to ambiguous answers to the questions ‘What exactly is wrong with our RE processes? Will the improvement really provide positive benefits? In what time frame can we recover the costs of RE process improvement? What are the most important failures that have to be addressed on a high priority?’ Most often, organizations do not have any straightforward answers to these questions. Lack of clear answers to such concerns brings an unprecedented halt to continuous RE process improvement. We define an RE process gap as the difference between the desired and existing states in an RE process. In most organizations, an RE strategy set to meet the organization goals establishes the desired state of an RE process. RE process gaps are therefore problems in the RE process, which when eliminated obviously result in REPI. Since RE process gaps cause an increased number of poor quality requirements (defined as those requirements that are incorrect, ambiguous, inconsistent or incomplete [3, 4]), we can relate RE process gaps to causes, and poor quality requirements to effects in a standard cause-effect decision matrix [10, 11]. Most large organizations identify RE as a key process area [12]. Unfortunately, REPI is not as effective as we expect it to be. The reasons for this are: • Most certified organizations follow standard-based approaches, such as CMM or ISO to improve RE processes, which do not provide explicit RE measurement guideline [13, 14, 15].
• A cause can effect one or more causes which in turn can recursively effect more causes or poor quality requirements, and it is difficult to establish the influence of process gaps on each other [12]. • The cause-effect matrix does not suggest any scales of the severity of the process gaps [12]. Therefore, it is difficult to accurately measure the influence of a process gap from the decision matrix.
eliminate all the problems. However, such a method with no specific prioritization makes improvement less cost effective and inefficient in achieving improvement goals [19, 20, 21]. Further, eliminating process gaps based on priorities that are not driven by organization goals will render improvements worthless [22]. Thus, it is important to prioritize process gaps against some measured issues. To measure an RE process, first of all a measurement unit is required. We term this as ‘Requirement Unit’ (RU) and define it as a set of requirements involved to perform a unit of work by a user who represents a role, by a device, by a data file or by another computer program that can be outside of the software or part of it. The following example illustrates an RU: A mailing application has two user goals: UG1-To send and receive mails efficiently; UG2-To safely store mails in the server until they are received. The requirements to meet the users goals can be: R1Facility to create messages within the mailing system; R2-Maintain an address book; R3-Uniquely identify the email addresses; R4-Dynamically update addresses in the address book, R5-Prioritize messages for sending in a local queue; R6-Store messages in conserved space on server by compressing them; R7– Decompress only those messages once receiving of that message begins; R8-Received messages to be in human readable format. The problems we now have is to establish traceability between user goals and requirements since some requirements partially trace to one user goal and partially to the other; while some other requirements do not trace to user goals since user goals are too general and broad in nature. Therefore, it is difficult to ensure that a set of requirements have met the user goals accurately. In addition to requirements, practitioners usually develop User scenarios and Use cases. However, these provide more information to the designer for designing the user interface of software [23]. We now define units of work for mailing application such as RU1-Create a mail message with address, subject and body of the mail; RU2- Auto create unique addresses in the address book while sending messages; RU3 – Receive messages that can be opened for reading, while waiting for sending of a mail to complete. These are based on various user or system-driven tasks. We can now trace the requirements easily to RUs, such as RU1-R1, R2, R3, R7; RU2-R3, R4, R7; RU3-R5, R6, R7, R8. The advantage of RU is that they provide information on:
Thus, the decision matrix by itself does not suggest any priority for process gap elimination. Eliminating all process gaps in one short improvement cycle may
1. What is the main task in a unit of work and what also has to be done while the main unit of work is occurring (because humans prefer to work on one
• Some organizations follow technique-based approaches, like defect prevention techniques [16], hence such improvement may be focused just on one of the improvement avenues instead of identifying all process gaps that cause poor requirements. • Sometimes, an organization improves one or more RE processes within a project in an ad hoc fashion and may not be able to formalize the change so that it can be applied to other projects in the organization [17, 18]. • Often, in organizations where RE is large, the number of process gaps may be numerous and may have a complex relationship with each other [12], hence it may be difficult to prioritize them for elimination. Thus, there is a need to develop an REPI framework that identifies RE process gaps and prioritizes process gaps for elimination such that REPI is achieved in a continuous fashion with well-established priorities set against organization goals.
2. RE Process Measurement Although there are many methods of process improvement, the cause (RE process gaps)-effect (poor quality requirements) decision matrix provides a well-established foundation for improvement [11]. By focusing on the failures and establishing analysis on the modes of the failures, their effects and what influenced them, we can identify the process gaps. Development and application of a decision matrix for process improvement is a simple technique when applied to small-sized and less-complex projects. However, when applied to large-scale and complex projects, the number and complexity of relationships between RE process gaps (causes) to requirements defects (effects) can become unwieldy for the following reasons:
main thing and also few other things at the same time) 2. What are the requirements and their sequence of operation that is needed to perform some work (because humans are particular about the way tasks are performed – for instance, in a word processor we want to write in pre-set columns rather than writing text, creating columns and pulling text into columns) Further, points 1 and 2 suggest that RUs provide adequate information to perform system testing effectively so that defects are found before the software is released for live use. We now define RE process measurement in terms of Effectiveness and Efficiency using RUs. Effectiveness is defined as the Total Requirement Units (TRU) in a component per unit cost of determining those TRUs. A component can be a system or a sub-system or a module that is associated with a release number. This means that if we fail to identify all the RUs of a component, RE is less effective. RE efficiency is defined as reduced changes (Add, Modify, Delete) in requirements related to an RU. These definitions, besides providing mechanisms to measure an RE process, also provide insight into what other SDLC processes can influence an RE measurement. The above formulas suggest that the following conditions can enhance effectiveness and/or efficiency: Condition 1. Increasing TRUs per unit cost (By a welldefined RE) Condition 2. Controlling changes to requirements (By a well-defined change management process) Condition 3. Keeping estimated costs per component constant (By a well-defined risk management process) Following on from these conditions, we can set up the proposition that RE should be measured in the context of Change Management (CM) and Risk Management (RM) to establish improvements. To enable such measurement in medium to large projects we assume the organisation uses an automated requirements tool that supports the capture of metrics. Through empirical research involving surveys, interviews and observation in two large organisations, we have support for the correctness of the proposition that CM and RM play an important role in producing in/effective and in/efficient RE. For example, most respondents to the surveys suggested that poor estimation and inclusion of changes without control were creating requirements related rework. In Organization1, some responses raised concerns about under-estimations due to informal changes requiring additional time and effort. In Organization2, we found
that changes were also logged as defects unless such changes were so big that they became projects by themselves. Therefore, we argue that poor CM and poor RM by themselves do not produce poor quality requirements, but they influence RE to be inefficient and ineffective. Based on this, we argue that the interplay between RE, RM and CM forms an important basis for prioritizing RE process gaps for elimination. This is discussed in detail in section 3. The next step is to consider an RE process gap and examine how it affects RE process effectiveness or efficiency or both by using the RE measurement definitions. Depending on the outcome, we establish the context for the process gap in the RE-RM-CM interplay for prioritization. The research question addressed in this paper is: What factors influence prioritization of the RE process gaps for elimination across different types of organizations and software development projects? The RE process gap prioritization strategy is part of our larger measurement driven REPI framework [10, 12]. Our empirical testing objectives were to test if our RE process gap prioritization strategy is suitable for medium or large and complex RE, and to test if this offers a simple solution in RE where the number of process gaps can be large and interrelations between them is complex. The intended test results were: 1. The organization that is being studied will apply a method-based prioritization instead of using judgement based on an individual’s capacity or lack of it. 2. The organization will find this strategy simple and systematic compared to grappling with various issues that are not classified under RE, RM and CM. 3. The organization will spend less time for prioritizing process gaps. 4. Based on points 1, 2 and 3 above, the organization will adopt process gap identification and prioritization as a standard strategy and incorporate into their REPI. The following sections present the role of RE, RM and CM interplay, and organization goals in prioritizing RE process gaps.
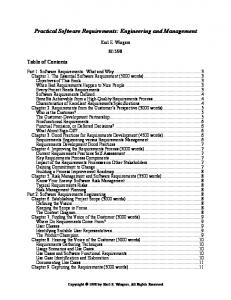
3. Interplay of RE, RM and CM In this section, we present the influence of RE, RM and CM process gaps on RE process measurement. By doing this, we can conclude that certain RE process gaps are ‘not worth’ eliminating. The interrelationship matrices are an adaptation of system test priority matrices that are commonly used in the industry for
→ CM Gaps Impact: Low to High
prioritizing the system testing of various test procedures. The position of the process gaps in these matrices determines the order of the process gaps in the first tentative queue. The first step is to establish a simple relationship between RE, RM and CM. Unfortunately, since this has three dimensions, it is difficult to establish a simple relationship amongst RE, RM and CM using a single 3-dimensional matrix. Therefore, we arrived at a structure that provides three 2-dimensional matrices of RE-RM, RE-CM and CM-RM instead of a complex single 3-dimensional RE-RM-CM matrix. The scales of the matrices are Low, Medium and High across the axes. These matrices are represented in figures 1a, 1b and 1c.
S1 CM-High RM-Low
S2 CM-High RM-Medium
S3 CM-High RM-High
S4 CM-Medium RM-Low
S5 CM-Medium RM-Medium
S6 CM-Medium RM-High
S7 CM-Low RM-Low
S8 CM-Low RM-Medium
S9 CM-Low RM-High
RM Process gaps Impact: Low to High →
RE Gaps Impact: Low to High
→
Figure 1c. CM-RM interplay S1 RE-High RM-Low
S2 RE-High RM-Medium
S3 RE-High RM-High
S4 RE-Medium RM-Low
S5 RE-Medium RM-Medium
S6 RE-Medium RM-High
S7 RE-Low RM-Low
S8 RE-Low RM-Medium
S9 RE-Low RM-High
RM Process gaps Impact: Low to High →
RE Gaps Impact: Low to High
→
Figure 1a. RE-RM interplay
S1 RE-High CM-Low
S2 RE-High CM-Medium
S3 RE-High CM-High
S4 RE-Medium CM-Low
S5 RE-Medium CM-Medium
S6 RE-Medium CM-High
S7 RE-Low CM-Low
S8 RE-Low CM-Medium
S9 RE-Low CM-High
CM Process gaps Impact: Low to High →
Figure 1b. RE-CM interplay
Each matrix has nine segments that are self contained and characterized by uniqueness of the severity of impact of RE, RM and CM. The segments S1 to S9 in the matrices are one of three shades based on whether a segment has at least one occurrence of High, if not, whether a segment has at least one occurrence of Medium and finally one segment where both occurrences are Low. All segments in the matrices where RE is High are a first priority, as RE process gaps impact both RE process effectiveness and efficiency. These are S1, S2 and S3. Based on our defined measurement in section 2, RM process gaps impact only on RE process effectiveness, while CM process gaps impact only RE process efficiency. Therefore, the rest of the segments in the matrices can acquire priorities based on business, project and organization specifics that determine one of the following three: A. If RE process effectiveness is more important than RE process efficiency B. If RE process efficiency is more important than RE process effectiveness C. If both RE effectiveness and efficiency are somewhat equally important Table 1 gives the case where both RE process effectiveness and efficiency are equally important, as was the situation in Organization1. Therefore, S6 and S9 segments also acquired first priority status. The rest of the segments S5, S4, and S8 acquired second priority status since RE is Medium. Segment S7, obviously acquired Low priority status.
Table 1. Priority table for Organization1
Priority
1
Segment numbers in the order of precedence S3, S2, S1, S6, S9
2
S5, S4, S8
3
S7
Rationale priority
for
however, inconsistencies can occur in the mappings for the same set of gaps:
setting
Since RE is High, and RM or CM is High or Medium in these segments Since RE is Medium, and RM or CM is Medium or Low in these segments Since RE is Low, and RM or CM are Low in this segment
For the sake of simplicity, we maintain three levels of priorities. Different organizations can have different sets of priorities (such as Very Low, Low, Medium, High, Very High) with clear definitions and rationale for such priorities. Based on Table 1, the queue of the segments appears as in figure 2. S3
S2
S1
S6
S9
S5
S4
S8
S7
Beginning of the queue Figure 2. Priority based segment queue While this queue represents our findings for Organization1, priorities for other organisations may follow a different order depending on their responses to A, B or C as discussed above. Further, we may need to adapt the priority table 1 to reflect the specific choices of the project and the organization.
4. Mapping of Process Gaps to Different Segments in RE, RM and CM matrices In our approach, REPI by process gap elimination is a task to be done by designated individuals such as Process and Quality staff within an organisation. We assume that the process gaps are already identified using established methods to analyze failures such as process audits, by actively participating in the RE process, by observing the RE process, and by seeking responses to carefully designed questionnaires. Having identified a set of RE process gaps, we initially applied role-based mappings provided by individuals in the organisation that was based on their personal judgement. This approach is simple and easy to apply,
• When applied by two different individuals of similar roles • When applied by the same person at different points of time, even though the process context did not change in the mean time Hence, the judgement-based mapping approach does not guarantee prioritization that defines an order for effective REPI. Typical cause-effect decision matrices suggest that the best candidate for elimination is a cause that is influencing a maximum number of other causes [11]. Our initial method of analysis was quantitative which does not apply very well for REPI, since organizations may be in a situation where a particular cause X is influencing customer dissatisfaction or is influencing schedule and cost overruns, while another cause Y may be influencing various other causes which collectively only results in minor rework in the SDLC. Under such situations, qualitative analysis will reveal that cause X should be the first candidate for elimination compared to cause Y. Thus, a qualitative analysis that looks beyond mere consideration of the number of effects to the nature and severity of the effect is required to map the causes to the segments in the prioritization queue described in section 3. Research indicates that certain goal-based approaches in RE have a rigorous qualitative analytical basis [20, 21, 24, 25]. Generally, organizations are focused on producing high quality requirements within a defined time and cost, in such a way that there is minimal rework in the SDLC arising as a consequence of RE errors [18]. Based on this premise, we set the following goals as: Goal 1: Optimized SDLC time. It usually takes more time to find requirement defects, address them and test the correctness of defect addressal, thus increasing the SDLC time and creating rework for SDLC staff [16]. It is important to optimize SDLC time by reducing rework . Goal 2: Reduced defects in software delivered to the customer. Customer satisfaction largely relies on reducing defects in software that is in live use [18]. We propose to map the process gaps based on their impact on the above goals as Low, Medium or High. This is based on the impact levels we used for Organization1. For the sake of simplicity, organizations can just have Boolean values of whether or not a process gap is an issue.
Process gaps (for example, Pg1 … Pgn) when mapped to various segments in the three matrices described in section 2 will result in a queue with the process gaps residing in corresponding segments. Figure 3 represents a mapping example of the queue for some example process gaps Pg1 to Pg15. S9
S5
S4
S8
1.
S7
Pg7, pg13
Pg8, pg15
Pg5
Pg14
2.
None
S6 Pg1, Pg9, pg4
S1
Pg6
S2
Pg2, pg11
Pg3, pg10, pg12
S3
gaps queue from the perspective of establishing accountability for the improvement exercise. The example queue represented in figure 3 is tentative in its ranking and has the following ambiguities:
Beginning of the queue Figure 3. Some example process gaps Pg1 to Pg15 mapped to segments in priority, to the segment queue shown in figure 2 Pg1 to Pg15 represent process gaps that are mapped to segments S1 to S9 of RE, RM and CM relationship matrices. If a process gap occurs in the same cell in more than one matrix, then only one entry is considered. This priority indicates the best prioritization for reducing defects in software that is delivered to customers thus reducing related rework. However, this does not indicate the costs associated with the improvement. If the RE process improvement exercise is not accountable (consideration of the benefits versus the costs), then the priority of process gaps elimination given in figure 3 will be good enough to achieve some results. However, this prioritization method discussed so far does not answer a question commonly asked in the industry ‘Is it worth spending some significant resources on a certain REPI issue?’[26]. To answer this question, we next describe how prioritization can be determined based on the expected returns and benefits of process improvement.
5. Refining Process Gap Prioritization to Add in Accountability Accountability in process improvement is becoming important in the industry [27, 28, 29]. Generally, the industry is becoming more aware of various costs that are involved in an improvement exercise against the direct benefits like reduced rework and indirect benefits such as reduced customer complaints [13, 17, 30]. Therefore, it is necessary to examine the process
The precedence of each of the gaps that co-occur within one segment is not known, hence they can be concluded as being in some random order within their segment. The impact of a gap may be highest, but an organization may not have the budget or may not be willing to invest resources to implement the improvement (such as investing in expensive RE tools), even though elimination of this gap is important.
REPI by elimination of certain gaps may involve simple process adjustments; certain others may involve a significant amount of people’s time and may even involve significant organizational investments. Therefore, certain problem eliminations need business cases to justify the improvement costs while certain others do not. Therefore, we offer a two-step procedure to set the precedence of the gaps in the tentative queue represented in figure 3: Step 1. Establish an order of elimination of each process gap based on the importance and urgency from the customer’s perspective. For instance, it may be important and urgent to eliminate a process gap ‘requirements are de-scoped from the baseline without explicit customer approval’ compared to any other process gap. Step 2. Establish involved costs in eliminating a process gap. For instance, it may be important to eliminate a process gap ‘SDLC staff and customers are not aware of dynamic changes that are made to requirements’. However, this elimination may involve significant costs in setting up workflow for SDLC staff and web access to the global customers. An organization can follow any one, or both of these steps to refine the priority. Section 6 describes a case study snapshot of prioritizing some of the process gaps for elimination as part of Organization1’s process improvement exercise.
6. A Case Study Snapshot The following case study is a small snapshot of our empirical research in a large software organization. We present some of our findings in prioritizing the RE process gaps that were found to be influencing the occurrence of requirements defects [12]. The goals of
this study were to determine the process gaps present in a large real life RE process, using Failure Mode Effects Analysis (FMEA) [31]; to ascertain the root causes of failures; and to suggest ways to close the process gaps to avoid recurrence. This snapshot is limited to prioritizing the RE process gaps, and not eliminating them. Organization11 is a large multinational software company that develops complex systems that have a significant software component in them. The organization has a well-established quality management system for software development processes. Standard software engineering processes exist to guide the SDLC within which RE is a process whose purpose is ‘to establish complete and correct requirements of software components of the system’. Requirements management follows manual methods without the implementation and use of RE tools. Organization1 has an average of 13% requirements defects out of which the majority are due to changes, omitted and incorrect requirements. There is an average of 67 days elapsed between logging requirements defects to fixing them. Based on our conceptual framework, the process gaps were examined under the headings of RE, CM and RM. Using FMEA, a number of process gaps were identified as part of the study, which we classified as Basic (elementary ones that influence other causes), Intermediate (these are influenced by basic causes and in turn influence other causes) and Direct (these are influenced by basic and intermediate causes and effect poor quality requirements). This classification was arrived at to handle the scalability issues so that the relationships between the large number of process gaps could be established with reduced complexity, and to further establish that the direct causes of poor quality requirements were poor effectiveness and poor efficiency [12]. The following process gaps are only a few of the process gaps taken from the actual list keeping in mind the limitations on the number of pages: RE 1. Significant time loss in finalizing the marketing requirements since a process of arbitration was followed between distributed stakeholders and Organization1 through emails, rather than process driven information sharing using detailed documents. RE 2. Developers dealt with surrogate customers most of the time, which introduced delays in getting stakeholder needs right. 1
Identity and details obscured for reasons of confidentiality
RE 3. Requirements quality checklist not being used consistently. RE 4. Inconsistent traceability from design to requirements. RE 5. Modelling not used to improve the clarity of overly complex requirements. RE 6. No visible acceptance criteria clearly stated such that beta testers and stakeholders test against set acceptance criteria. RE 7. Requirements testability not covered in detail in specifications and reviews. RE 8. Manual requirements management. Some CM problems that negatively influenced the quality of the RE process were: CM 1. Requirements baselines not consistently communicated to stakeholders so that they understand the expected commitment (In terms of additional time and cost) to further changes. CM 2. Customers not being aware of the dynamic changes that occur to the requirements before or after baselining. CM 3. Requirements added and excluded without formal approval. CM 4. New work and committed work were not clearly distinguished. CM 5. Manual change management. Some RM problems that negatively influenced the quality of the RE process were: RM 1. Risks associated with the impact of uncommitted changes not consistently assessed. RM 2. Risks related to not having a common source of information for development and testing was not consistently assessed. RM 3. Risk assessment of beginning design and development on omitted or incorrect requirements was not established. Table 2 indicates the impacts of RE1 to RE8, CM1 to CM5 and RM1 to RM3 against RE, RM and CM. These impacts were determined following the process described in section 3. Based on the interplay between RE, RM and CM described in Section 2 and 3, we placed the process gaps into the segments of the matrices shown in figure 3 to arrive at the initial queue. This initial queue is presented in figure 4.
Table 2. Impact table established for RE process gaps in Organization1
High Medium High
High Medium High
High Low High
S3
S2
S1
S6
S9
S5
S4
S8
S7
RE5
RM1 RM2 RM3
RE5, RE1, RE7
High High High Low High
CM2, CM4, RM2, RE3, RE5
Low Medium High High High
RE7, RM2
High High High Medium High
CM4
CM1 CM2 CM3 CM4 CM5
CM4
CM Impact Low High Medium High Medium High Low High
RE3, RE1, RE7, CM1
RM Impact Medium High Low High Low High Medium High
RE1, RE3
RE Impact High High High High Low High High High
RE2, RE4, RE6, RE8, CM3, RM1, RM3, CM5
Gap ID RE1 RE2 RE3 RE4 RE5 RE6 RE7 RE8
Beginning of the queue
Figure 4. Process gaps in priority based segment queues for Organization1, showing the actual implementation of the queue in figure 3 The queue now looks as follows with { and } grouping process gaps together in each segment: {RE2, RE4, RE6, RE8, CM3, RM1, RM3, CM5} {RE1, RE3}{RE3, RE1, RE7, CM1} {CM4}{CM4}{RE7, CM2}{CM2, CM4, RM2, RE3, RE5} {RE5, RE1, RE7}{RE5}
If we eliminate the duplicate occurrences, the queue appears as:{RE2, RE4, RE6, RE8, CM3, RM1, RM3, CM5} {RE1, RE3} {RE7, CM1} {CM4} {CM2, RM2} {RE5}. As a result of striking out the duplicates, we now have reduced the number of groups from 9 to 6. If Organization1 was not focussed on accountability in process improvement, the above ranking of process gaps would be appropriate for process gap elimination as part of their REPI. However, Organization1 has established accountability on continuous process improvement. Since it is not clear from the above queue which gap has precedence over the other for elimination in each group, the process gap elimination with this ranking does not guarantee accountability. Applying step 1 described in section 5, we rank each gap for elimination based on its impact on customer satisfaction and associated costs. Table 3 describes a refined ranking that establishes accountability. Column A of table 3 indicates the gaps in various groups and column B indicates an order of importance. Sorting the gaps based on the order of importance leads to a new queue as shown in column C. If Organization1 was not concerned with involved costs, the process gap elimination priority would have been as indicated in column C. However, Organization1 was concerned to prioritize based on the involved costs, hence we refined the prioritization further. Column D shows the corresponding descending order of importance. Therefore, we next follow Step 2 mentioned in section 5 to add the cost associated with eliminating these gaps in column E in three scales of Low, Medium and High, and sort it based on the involved costs. This gives us the final queue for elimination as in column F with corresponding order of importance and involved costs reflected in columns G and H respectively. Table 3. Process gap prioritization table showing the progression of ranking (of gaps in table 2) based on the order of importance, urgency and involved costs
A
B
C D E F G H Proces s Gap Changed Order Order Sorted Order on of queue of of Process Import Import Import Involve after cost Import Involve Gap ance ance ance d Costs analysis ance d Costs RE2
2
RM1
8
RE4
3
RM3
RE6
5
CM5
RE8
1
RE6
Low
RM1
8
Low
7
Low
RM3
7
Low
6
High
RE6
5
Low
5
Low
CM3
4
Low
A
B
C D E F G H Proces s Gap Changed Order Order Sorted Order queue of of of on Process Import Import Import Involve after cost Import Involve Gap ance ance ance d Costs analysis ance d Costs CM3
4
CM3
4
Low
RE4
3
Low
RM1
8
RE4
3
Low
CM5
6
High
RM3
7
RE2
2
High
RE2
2
High
CM5
6
RE8
1
High
RE8
1
High
RE1
2
RE1
2
Mediu m
RE3
1
RE3
1
RE3
1
Low
RE1
2
Low Mediu m
RE7
1
CM1
2
CM1
2
CM1
2
RE7
1
Low Mediu m
RE7
1
Low Mediu m
CM4
1
CM4
1
Low
CM4
1
Low
CM2
1
RM2
2
Low
RM2
2
Low
RM2
2
CM2
1
High
CM2
1
High
RE5
1
RE5
1
High
RE5
1
High
Therefore, the final queue for process gap elimination is as presented in figure 5. RM1, RM3, RE6, CM3, RE4, CM5, RE2, RE8, RE3, RE1, CM1→ → RE7, CM4, RM2, CM2, RE5
Beginning of the queue Figure 5. Process gaps in priority based segment queues for Organization1, showing the changes in rankings compared to figure 4 The new order has now established the priority of eliminating gaps occurring in the same section, which was an issue as indicated in figure 4, and discussed in section 5. This research reuses a popular system testing prioritization technique used in the industry. Because of the familiarity of the Organization1’s SDLC staff with the technique, it took very little time to apply these techniques to RE process gap prioritization. While on first reading the process may seem complex, in reality the approach was simple. The
process gaps were initially entered onto sheets of paper which had the RE-CM-RM matrices printed on them in order to establish the initial queue. Further prioritization was done in a one-hour discussion involving 4 people. The discussion was driven by the desire to reduce rework, and involved costs, related to requirements defects particularly those that are found during live use of software. Organization1 is now in the process of applying the REPI given to them as a set of recommendations that are produced as an outcome of following the prioritization techniques in this paper. For example, the first three process gaps prioritized from a list of 29 gaps were in general related to issues in risk management, establishing testing effectiveness related to requirements testing and establishing traceability of requirements changes. We are currently working on improving RE against these issues.
7. Discussion Organizations spend significant amounts of time and money conducting REPI [26, 28, 32]. Yet studies find that organizations are not very successful in their measurement based RE improvement efforts, resulting in REPI that did not achieve its intention [18]. Identifying factors that influence process quality negatively, and prioritizing them for elimination can help make RE improvement more relevant and tangible to organizations. This research thus represents a significant step towards achieving returns on REPI in organizations. The next step is to determine an expression as a means for return on investment and perform a costbenefit analysis, and to test the validity and reliability of this strategy and of the associated framework [12]. An important factor for the success of this research is iteratively testing this strategy in association with the relevant process improvement framework on multiple cases of medium or large and complex projects and comparing the results in terms of real market successes of the studied organizations based on the application of this strategy. One issue that has emerged as a critical success factors in this research is to determine the timeframe (in months) necessary before which REPI costs are recovered. We plan to address such critical success factors in our subsequent empirical research where our process improvement recommendations will be implemented.
References [1] P. Zave, "Classification of Research Efforts in RE", ACM Computer Surveys, pp. 313, 1997. [2] K. Wiegers, "The Real World of Requirements Engineering", Requirenautics Quarterly, pp. 5-8, 2004.
[3] C. S. Kuehl, "Improving System Requirements Quality Through Application of an Operational Concept Process: An Essential Element In System Sustainment", presented at 4th Annual Systems Engineering Conference, 2001. [4] K. E. Wiegers, Software Requirements, 2 ed. Washington, USA: Microsoft Press, 2003. [5] H. Jack, "Edward Deming's 14 Points", Quality Engineer on a Disk, 2001. [6] J. V. Buren and D. Cook, "Experiences in Adoption of Requirements Engineering", Crosstalk, The Journal of Defence Software, pp. 7440-7450, 1998. [7] J. J. Carr, "Requirements engineering and management: the key to designing quality complex systems", The TQM Magazine, pp. 400, 2000. [8] M. E. C. Hull, K. Jackson, and A. J. J. Dick, Requirements Engineering, Practitioners Series ed. Uxbridge, UK: Brunel University, 2002. [9] M. K. Niazi, "Improving the Requirements Engineering Process Through the Application of a Key Process Areas Approach", AWRE02, 2002. [10] B. Palyagar, "A Framework for Validating Process Improvements in Requirements Engineering", presented at 12th International RE 04-IEEE Doctoral Symposium, September 7, Kyoto, Japan, 2004. [11] J. Bicheno, Cause and Effect Lean: Lean Operations, Six Sigma and Supply Chain. England: Picsie Press, 2000. [12] B. Palyagar, "Measuring and Influencing Requirements Engineering Processes", presented at 9th Australian Workshop on Requirements Engineering (AWRE), December 6 - 7, Adelaide, Australia, 2004. [13] P. Sawyer, I. Sommerville, and S. Viller, "Requirements Process Improvement Through the Phased Introduction of Good Practice", Software Process: Improvement and Practice, pp. 19-34, 2002. [14] M. D. Schaeffer, "Capability Maturity Model Process Improvement", Crosstalk The Journal of Defence Software Engineering, pp. 4-5, 1998. [15] K. E. Emam, J.-N. Drouin, and W. Melo, SPICE: The Theory and Practice of Software Process Improvement and Capability Determination. USA, 1997. [16] S. Lauesen and O. Vinter, "Preventing Requirement Defects: An Experiment in Process Improvement", Requirements Engineering Journal, Springer, pp. 1-74, 2001. [17] B. Regnell and P. Beremark, "A Market Driven Requirements Engineering Process - Results from Industrial Process Improvement Program", Requirements Engineering Journal, Springer, pp. 121-129, 1998. [18] I. Sommerville and G. Kotonya, Requirements Engineering Processes and Techniques, 1 ed. England: Wiley, 1998. [19] T. Olson and D. Beeson, "How to Practically Improve Your Requirements Process Using the CMMI Framework", presented at CMMISM Technology Conference, 2002. [20] E. Kavakli, "Goal Oriented Requirements Engineering: A Unifying Framework", Requirements Engineering Journal, Springer, pp. 237-251, 2002. [21] M. Oivo and V. R. Basili, "Representing Software Engineering Models: The TAME Goal Oriented Approach", IEEE Transactions on Software Engineering, pp. 886-898, 1992.
[22] J. Priitchet, Software Processes and Best Practice. Ireland: The SPIRE Handbook, 2000. [23] M. Kratochvil and B. McGibbon, UML Xtra-Light How to Specify Your Software Requirements, First ed. Cape Town: Cambridge University Press, 2003. [24] H. Kaiya, H. Horai, and M. Saeki, "AGORA: Attributed Goal-Oriented Requirements Analysis Method", presented at IEEE Joint International Conference on Requirements Engineering, 2002. [25] S. J. Bleistein, A. Aurum, K. Cox, and P. K. Ray, "Linking Requirements Goal Modelling Techniques to Strategic e-Business Patterns and Best Practice", presented at 8th Australian Workshop on Requirements Engineering (AWRE), 2003. [26] D. Leffingwell, "Calculating Your Return on Investment from More Effective Requirements Management", presented at 12th IEEE International Requirements Engineering Conference (RE'04), 2004. [27] I. Aaen, "Software Process Improvement: Blueprints versus Recipes", IEEE Software, pp. 86-93, 2003. [28] R. Dion, "Process Improvement and the Corporate Balance Sheet", IEEE Software, pp. 28-35, 1993. [29] K. Jeletic, R. Pajerski, and C. Brown, Software Process Improvement Guidebook. USA: NASA, 1996. [30] D. Stelzer and W. Mellis, "Success Factors of Organizational Change in Software Process Improvement", Software Process - Improvement and Practice, pp. 227-250, 1998. [31] R. E. McDermott, R. J. Mikulak, and M. R. Beauregard, The Basics of FMEA. USA: Productivity, 2000. [32] B. Williams, P. Hewitt, M. Stinson, and M. Filipsson, "Calculating Return-On-Investment from More Effective Requirements Management - Delivering Quality Software on Time and on Budget", Telelogic 2004.