... Lima, ISBN 978-3-902613-21-9, pp. 598, December 2007, Itech Education and Publishing, Vienna, Austria. O pen. Access. Database www.i-techonline.co m ...
6 Probabilistic and Statistical Layered Approach for High-Level Decision Making in Soccer Simulation Robotics Carlos Bustamante and Leonardo Garrido Tecnológico de Monterrey, Campus Monterrey México
Open Access Database www.i-techonline.com
1. Introduction In literature, some authors propose to see artificial intelligence as the design of an intelligent agent (Russell & Norvig, 2003). An agent is an entity that perceives its environment, thinks and acts accordingly. An intelligent agent in this sense is one that makes rational decisions. Therefore, some authors like to call them rational agents. The part of artificial intelligence that focuses in the study of rational agents and the way they cooperate, coordinate and negotiate as abstract social entities is called multiagent systems. A lot of techniques have been proposed in the effort of making rational agents. Every one presents its own advantages and disadvantages and their efficiency varies among different domains. Hence, it seems interesting to try to combine techniques and measure their efficiency when they work together. Such approaches are known as hybrid systems. Evaluating and testing multiagent systems in real life is very complicated. Many domains are complex, dynamic and uncertain. Diverse testbeds have been created to allow researchers to easily test and compare ideas for extrapolating them to real situations later. One of the most known testbeds for multiagent systems nowadays is the RoboCup competition. RoboCup initiative is an international project that promotes artificial intelligence, robotics and related areas, through a competition and conferences system with robotic soccer as the base problem. The ultimate goal is “by year 2050, to develop a team of fully autonomous humanoid robots that can win against the human world champion team in soccer”. The competitions are divided into many leagues, one of them being the 3D simulation league. In RoboCup 3D, the environment is complex, dynamic and noisy. This chapter focuses on the development of a decision making framework of a RoboCup 3D simulation agent based on a recently explored fuzzy-Bayesian hybrid classifier. Fuzzy theory and Bayesian methods have been used by separate for years and they have presented good results in various domains. A fuzzy-Bayesian approach faces uncertainty in decisions with probabilistic reasoning and learning, and treats variables involved in the process as fuzzy variables, which are expressed linguistically and are computed mathematically. This decision making approach tries to combine the best of statistical data processing with human-like view of attributes related to a problem. Source: Robotic Soccer, Book edited by: Pedro Lima, ISBN 978-3-902613-21-9, pp. 598, December 2007, Itech Education and Publishing, Vienna, Austria
110
Robotic Soccer
On the other hand, a simulation allows reproducing a real environment approximating physical conditions by means of complex mathematical models. This provides the advantage of being able of changing parameters for representing different environments and to correct mistakes in which many times, in real life, there is no backing out. RoboCup 3D simulation has these characteristics and is a relatively recent RoboCup league with a long way to go. The efficiency of a fuzzy-Bayesian decision making system for a soccer agent, however, is constrained to the degree of quality of the world model data. This is why the development of the agent is done in a 3-layer fashion. The lowest layer consists of obtaining accurate motion models. The middle layer uses such models and a particle filter to allow a precise self-localization of an agent. With the filtered position of an agent, positions of other objects in the world are easily computed. Finally, the highest layer uses the middle-layer data for making decisions with the fuzzy-Bayesian framework.
2. Soccer Since 1997, the RoboCup Soccer Simulation 2D has been one of the main contributors to the RoboCup initiative in terms of multiagent learning, coordination, communication and opponent modelling. However, the simulation omits several aspects that affect robots in real situations. The motion of dynamic objects is restricted to two dimensions. Also, the physics are simplistic and don’t allow complex behaviours. In order to fulfill the RoboCup ultimate goal by 2050, the simulation system must treat agents as physical entities with realistic features. After all, the RoboCup goal implies the development of humanoid-like robots and therefore the simulation league must converge with the humanoid league in some point. As more realistic agent models were needed, the 3D simulation league was created. The agents are spheres1 , but 3D interactions make the environment more complex and more interesting for researchers in artificial intelligence and multiagent theory. The simulator serves as the main platform in the RoboCup Simulated Soccer League, part of the RoboCup competitions, whose main event is celebrated every year.
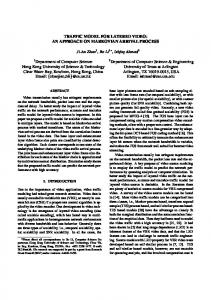
Fig. 1. Monitor for the RoboCup 3D Soccer Simulator
1
This year the simulator was changed radically and the agents are now humanoids, which makes the RoboCup 3D domain even more complex and interesting.
Probabilistic and Statistical Layered Approach for High-Level Decision Making
111
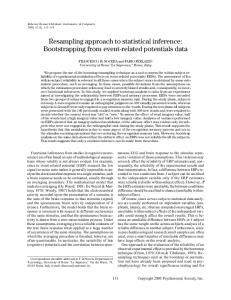
The RoboCup 3D simulator is a software that provides two elements: a core system called the soccer server and a monitoring tool. The simulator is aimed for three main tasks: allows players to sense and act in their environment, has rules for several situations in a soccer match and applies the laws of physics to recreate a real-like scenario. The environment of the current soccer simulation2 is a big box which contains a virtual soccer field. It respects FIFA specification for international real soccer matches. Simulation steps are 0.01 seconds long and agents receive sensations every 20 simulation steps. The global coordinate system of the field is as follows: the x-axis extends over the horizontal line that extends from the left to the right. The y-axis is over the field and is perpendicular to the x-axis. The z-axis points up. The global angle marks 0 degrees in the direction of the x-axis and grows in counter-clockwise direction. A graphical representation of the soccer field coordinate system and the global angle direction is shown in figure 2. The elements in the field are divided in two classes: • Static elements are elements in the environment whose position is fixed. o Landmarks: reference points for localization. Four posts, two for each of the goals Four flags, which are placed in each corner of the field o Goal: A rectangular box with width 7.32m, height 2.0m and depth 2.0m. There are two goals, one for each team. They are located over the end line of the field, with two vertical posts touching the line and a crossbar joining those posts. A team scores one point if the ball passes gets inside the goal box. o Field: A rectangle of width U[64.0m, 75.9m] and length U[100.0m, 110.9m]. It is subdivided in regions such as the left and right half areas, the penalty boxes, the goal boxes and the center circle. The field is contained inside a box of width equal to the field’s width plus a border size of 10.0m, length equal to the field’s length plus the border size of 10.0m and height 40.0m. • Dynamic elements are elements in the environment which can change their positions over time. o Players: The main actors in the environment. Players have a spherical shape, with radius 0.22m and mass 75kg. The color depends on the team: one team has blue players and the other has red players. o Ball: A sphere with radius 0.111m and mass U[0.41kg, 0.45kg], which is much smaller than the mass of the players. The weight of the ball varies from game to game, but it is constant during a game once it has been set. FIFA rules are implemented in the simulator in different play modes like kick-off, goal kicks, corner kicks, throw-ins and free kicks. If agents try to violate rules entering an area that is prohibited by the current situation, they are teleported to a valid position, which depends of the current situation. In corner kicks, throw-ins and free kicks, the invalid area is inside a circle of 9.15 meters of diameter around the ball. In goal kicks, the invalid area is the
2 The current simulator version is 0.5.6 (July 2007). It is now more oriented to the new humanoid 3D simulation.
112
Robotic Soccer
enemy penalty area. In kick-off, the invalid area is the semi-circle of 9.15 meters of diameter in the center of the field plus the opponent’s half field.
Fig. 2. Global coordinate system in the RoboCup 3D Soccer Simulator In the RoboCup 3D Soccer Simulation agents are homogeneous, in the sense that their share the same properties and have the same set of perceptors and effectors (except for the goalkeeper that has an extra effector for catching the ball). An agent is an entity that perceives its environment through sensors and acts upon that environment through effectors (Russell & Norvig, 2003). In the 3D simulator, an agent is a client software with such characteristics and connects to the simulation engine through a communication server. Data packages generated and received by the server are strings in form of s-expressions. Agents that receive these messages must parse these strings in order to analyze the information contained in the package. The process of interactions between agents and the simulation engine consists of two steps: initialization and life cycle. Agents have a set of effectors and perceptors to act upon their environment. Communication is allowed by using certain effectors and perceptors. Among the effectors we can find create, init, beam, drive, kick, say and pantilt. The goalkeeper has an extra catch effector. The agent moves in the environment using its drive effector and interacts with the ball using the kick effector. The set of perceptors includes vision, game state, agent state and hear. The say effector and the hear perceptor make communication possible. To make a more realistic simulation, some effectors and perceptors are affected by white and noise. This means that errors are normally distributed with expected values different standard deviations. The exception is the pantilt perceptor (part of the agent state perceptor) in which values are rounded to the next integer value. Table 1 shows all the error sources and their characteristics.
Probabilistic and Statistical Layered Approach for High-Level Decision Making
113
Uncertainty in perceptors and effectors Drive effector Kick effector
Vision perceptor
Agent State perceptor Table 1. Sources of uncertainty in the RoboCup 3D simulation environment.
3. Motion Models Obtaining the motions models in RoboCup 3D is the first and most essential task to accomplish before working on high level design. Knowing the motion models means knowing what is going on behind the scenes in the simulation. Not only we can predict the results of dynamic object actions, but we also can explain some behavior and thus construct better high level solutions. The models were derived from a formal mathematical analysis. For obtaining accurate and feasible parameters for the motion models, the power of statistical analysis and curve fitting tools was exploded. The parameters were obtained under ideal conditions, i.e. noise produced by the simulator in effectors and perceptors was eliminated. The methodologies and results of this chapter were published in (Bustamante et al., 2007). 3.1 Definition A motion model of a dynamic object is described formally as a function from certain duple in time to a duple in time , where is the position vector, is , that is: the velocity vector and (1) 3.2 Agent Motion Model The movement of the agent is affected by the drive force (applied to its drive effector) and by the air friction. The drive force vector
is defined as (2)
The force vector does not have a z-axis component because spherical agents can’t jump. The air drag force is defined as (Marion & Thornton, 2003) (3)
114
Robotic Soccer
The constant represents the coefficient that imposes an air drag force to a body and the body’s velocity. The equations that model the forces over each axis are
is
(4) is the mass of the agent, is the acceleration, is the drive force (in newtons), Here is the air drag coefficient for the agent and is the global horizontal angle in the x-y plane. Also let and . be the drive force percentage, i.e. the drive force command sent to the Let and is given by Drive Effector. The relation between (5) As the equations that model the forces for both axis are similar, it is enough to analyze xaxis and generalize for y-axis later. The differential equation that models the movement on the x-axis is expressed as a differential equation from (4)
(6) 3.2.1 Agent Speed Model Solving the differential equation (6) gives (7) Finally for simplicity some constant terms are defined like the terminal speed of the agent (8) which is the maximal speed that the agent can reach when the drag force equals the drive force. Also, let’s define a time constant (9) Finally, the agent’s speed model is expressed as (10)
Probabilistic and Statistical Layered Approach for High-Level Decision Making
115
3.2.2 Agent Position Model Once having the speed model, the agent’s position model is determined relatively easy integrating equation (10) from to (11) where
is the integration constant and represents the initial position.
3.3 Ball Motion Model Unlike the agent, the movement of the ball can be separated in two different phases: 1. In the first phase, a kick force is applied to the ball for 10 simulation steps. Thus the ball is affected by the kick force and by the air drag force in X and Y, and is also affected by gravity in Z. 2. In the second phase, the ball decelerates and is affected just by the air drag force in X and Y, and additionally by gravity in Z. 3.3.1 First Phase of Ball Motion In the first phase, the ball behaves like an agent with constant force (kick force). The force vector is defined as (12) be the global horizontal angle in the x-y plane between the agent and the ball and Let the elevation angle sent to the kick effector. The equations that model the forces over each axis are
(13) is the mass of the ball, is the acceleration, is the kick force (in newtons) and Here is the air drag coefficient for the ball. Also let , and
.
Let be the kick force percentage, i.e. the power command sent to the Kick and is given by Effector. The relation between (14)
116
Robotic Soccer
As with the agent, we can generalize one equation for both X and Y axis, but we have to define a different equation for z-axis. The differential equation that models the movement on X and Y is expressed as (15) The differential equation that models the movement on Z is expressed as (16)
3.3.1.1 Ball Model for the First Phase in X-Y Notice that equation (15) is the same of that of the agent (6). Then, we only summarize the finals equations: (17) (18) where is the terminal speed of the ball (i.e. the maximal speed that the ball could reach if the kick force was applied for a long time). 3.3.1.2 Ball Model for the First Phase in Z The solution to the differential equation (16) for Z is expressed as (19) This is very similar to equation (7). We have to define the terminal speed of the ball in Z as (20) Finally we have (21) (22) 3.3.2 Second Phase of Ball Motion In the second phase, the ball decelerates until it stops moving in X and Y, and it bounces until it stops moving in Z. The equations that model the forces over each axis are
Probabilistic and Statistical Layered Approach for High-Level Decision Making
117
(23) The differential equation that models the movement on X and Y is expressed as (24) The differential equation that models the movement on Z is expressed as (25)
3.3.2.1 Ball Model for the Second Phase in X-Y Solving differential equation (24) gives (26) The amplitude
represents the initial speed of the second phase, which must be
equal to the final speed of the first phase evaluated in 10 simulation steps of 0.01 seconds each). Formally, (27) Using equation (26) the speed is given by (28) and the position by (29) 3.3.2.2 Ball Model for the Second Phase in Z Solving differential equation (25) gives (30)
The constant A can be calculated using the initial condition
as
118
Robotic Soccer
(31) Substituting this value in equation (30), the speed model is given by (32) which in terms of constants is (33) and the position model is given by (34) When the ball is at rest,
is equal to the radius of the ball.
3.5 Finding the Values of the Coefficients and The next step is to evaluate the coefficients needed by the model. We already know , so we must look specifically for , , and in order to have a complete description of the equations. Two scenarios were defined for obtaining representative data from the simulation. In the first scenario, an agent is placed in the center of the soccer field and runs over the x-axis with maximum acceleration towards the opponent’s goal. In the second scenario, the ball is placed at the center of the field and is kicked by an agent with maximum acceleration towards the opponent’s goal. Tracking the data of the scenarios via the monitor’s port, a set of pairs (t, x) were obtained where t is time and x is position, which describes the movement of the agent and the ball over the x-axis. The values of the coefficients were computed with Matlab and the Curve Fitting Tool, using the set of pairs (t, x) and the motion models, giving the following results (35) (36) (37)
(38)
Probabilistic and Statistical Layered Approach for High-Level Decision Making
119
We can get the medium viscosity with the aid of the Stokes’ equation (Marion & Thornton, 2003)
where is the radius, and the viscosity coefficient. This quantity must be calculated with which is a drag force caused only by the fluid, opposite to that represents a drag force caused by the fluid and the system motion. Using the radius of the ball we have (39) We can infer that the simulated medium is not air as the value of viscosity which is approximately
is bigger than the air
.
3.6 Practical Applications The physics model described so far can be used to implement higher level behaviors like soccer skills. In the next sections we describe two of such skills. 3.6.1 Goto Using the Goto skill the agent is capable of moving to any coordinate on the soccer field. The movement of the agent consists of three steps: 1) acceleration, 2) constant speed and 3) deceleration. In fact, the most important is step 3 because in the first two steps the agent must apply the maximal force, but in the last step the agent must decide at which moment stops. For breaking, the agent applies a drive force vector of magnitude zero and that it needs to stop makes use of the drag force to stop. It calculates the distance moving when drive force becomes zero. This distance is compared with the distance that the agent needs to cross to reach its destination . If , the agent keeps can be applying a drive force, otherwise the agent stops applying the drive force. calculated as (40) 3.6.2 Dribbling The Dribbling skill provides the agent with the ability to move from one place to another without losing the possession of the ball. For accomplishing this task, the agent needs to run in the direction of the ball’s velocity vector and kick the ball with the exact force that allows the agent to kick again in a near future without loosing possession and without colliding with the ball. This is a difficult skill that few teams have implemented efficiently. One of the few teams that have implemented the dribble skill efficiently is SEU3D (Xu et al., 2006), but no precise explanation is given in their team description paper about their method. Our idea is that the agent can decide at which distance it desires to kick the ball after kicking it for the first time. Then the agent can use this distance to find the needed kick force. In fact, is the
120
Robotic Soccer
displacement of the agent between kicks, but is also the displacement of the ball. Using equation (11) with the assumption that the agent has reached its terminal speed and equation (29) we have
We can find the value of simplification. In fact, in that equation
with equation (27). But this equation needs a is much smaller that
because the agent
can only apply a very small speed to the ball due to the restriction that the kick force is applied only for a little period of time. Hence we have
equals . Then, we finally get the kick force that the agent needs apply but also to the ball for an efficient dribble skill as (41)
3.7 Experiments For evaluating the models of the agent a scenario was defined were an agent is placed in the center of the soccer field and runs with maximum acceleration towards the opponent’s goal. For the ball, a scenario was defined where the ball is placed at the center of the field and is kicked by the agent with maximum acceleration towards the opponent’s goal. The error of the models against the noiseless real data is computed to make an objective evaluation of such models. Results of comparison are shown in table 2. Also, we present here two graphs that show the efficiency of our physics model when it is applied to a) GoTo Skill and b) Dribbling skill.Mean and standard deviation were computed of the absolute errors between the values thrown by the models and the expected real values, thus (42)
Probabilistic and Statistical Layered Approach for High-Level Decision Making
Mean
121
Standard Deviation
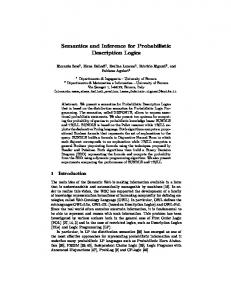
Agent Motion Model Ball Motion Model (X-Y) Ball Motion Model (Z) Table 2. Mean and standard deviation of the absolute error (in meters) between data thrown by the motion models and real information thrown by the simulator in debug mode 3.7.1 Goto In this experiment an agent uses the Goto skill to move 10 meters away from its initial position. Figure 3 shows the real and estimated values of the distance between the agent position and the destination. We can notice that 1) our physics model is so accurate that both curves almost superpose and 2) the efficiency of the GoTo skill is so good that the agent reach its destination without oscillating in the final position.
Fig. 3. GoTo Experiment. The real and the estimated positions almost overlap which indicates a good accuracy of the physics models 3.7.2 Dribbling Figure 4 shows the speed of the agent and the ball versus time. The agent runs towards the ball in the direction of the ball’s velocity vector. We can notice that 1) The first kick is weaker than the others because the agent has not reached its maximal speed and 2) The agent never decelerates.
122
Robotic Soccer
Fig. 4. Dribbling Experiment. The agent does not decelerate which indicates an efficient dribble as the agent never collides with the ball
4. Probabilistic Localization Localization refers to the problem of determining the pose of an agent from sensor data (Fox, 1998). The pose of an agent represents the location and orientation of a robot relative to a global coordinate frame (Thrun et al., 2005). The localization problem has been claimed as "the most fundamental problem to providing a mobile robot with autonomous capabilities" (Cox, 1991). It is a fundamental problem because if an agent ignores where it is, it is not feasible to decide what action to execute. Unfortunately, in most situations, an agent cannot sense the pose directly, i.e. it is not equipped with a noise-free sensor for measuring its position. So the agent has to compute its pose based on relative and absolute measurements of reference points. The set of all absolute reference points is the so-called map of the environment. The map contains the reference points in global coordinates. , where is the 2D position of In RoboCup 3D, the agent’s pose is a tuple is the orientation of the agent’s pan-tilt the robot in the global coordinate frame and angle, respectively. The aforementioned reference points are the corner flags and the goal posts. In robotics, reference points receive the name of landmarks to indicate that they are used for robot navigation. In the soccer simulation, a RoboCup 3D soccer agent receives the range (distance) and bearing (angles) to each visible landmark, along with a signature that identifies it. Hence, there is no uncertainty about the identity of each flag, but the range and bearing measurements are affected by Gaussian noise. In most real situations, a robot does not directly sense the characteristics of the landmarks. Instead, it has to extract or infer important features from data. When an agent receives relative information of the reference points by means of its vision perceptor, it has to guess its location as accurately as possible. This is even harder because the intrinsic uncertainty in perceptors and effectors. To increase accuracy, an agent must filter the noisy data to get a reliable and precise pose estimate.
Probabilistic and Statistical Layered Approach for High-Level Decision Making
123
4.1 Classification of Localization Problems Thrun divides the localization problem into three dimensions (Thrun et al., 2005), depending on the nature of the environment and the previous knowledge: • Local/Global Localization: Characterized by the initial knowledge of the agent. It has three categories: o Position tracking: Assuming that the initial agent's pose is known, this method uses the motion model to track the position of the agent considering a small-effect noise (usually approximated by a unimodal distribution like a Gaussian). As the uncertainty is around the agent's true pose, the problem is called local. o Global localization: In this case, the initial pose of the agent is unknown, i.e. when the agent is placed in the environment it lacks information about where it is. It is a harder problem than position tracking. o Kidnapped robot problem: It has the same characteristics than global localization, but with more difficulties. It assumes that the agent can be teleported to other location during its operation. It is hard because the agent believes that it knows where it is while in reality it does not. In global localization, the agent knows for sure that it does not know where it is. Usually, wrong beliefs about the state of the world are worst than ignorance about the world itself. • Static versus Dynamic Environments: A static environment is that in which the agent is the only dynamic object. A dynamic environment is that in which many objects change their poses over time. Clearly, a dynamic environment presents much more difficulties than a static environment. • Passive versus Active Approaches: Passive localization refers to the case when a module external to the agent observes the agent’s operation over time. An active localization approach is that in which the agent has a control module that minimizes its localization error. In RoboCup 3D, the localization problem consists of position tracking with possible kidnapping, in a dynamic environment under an active approach. It is considered as position tracking because the agent usually knows its initial position (and the initial position of all its teammates) due to previously defined formations and roles. The kidnapped problem emerges when an agent violates some rule of the soccer simulation, like trying to access a restricted area in a free kick situation, in which the agent is teleported to an allowed sector of the field. The environment is dynamic because there are many moving objects in the environment in addition to the agent that have their own dynamics (the ball, teammates and opponents). Finally, the approach used is active because the agent has its own localization module. Several approaches have been proposed in literature for the localization problem, trying to reduce the effect of noise and increase the accuracy of the computed position as more information is obtained over time. The two classical approaches in literature are the Kalman Filter and the Monte Carlo localization. The former uses continuous Bayes’ filters and the latter uses particle filter principles.
124
Robotic Soccer
4.2 Markov Localization Markov localization (Fox, 1998) is a special case of probabilistic state estimation applied to mobile robot localization. It represents the straightforward application of Bayes’ filters to localization (Thrun et al., 2005). It addresses the problem of pose estimation from sensor data given an initial hypothesis of a static environment, and uses Bayes’ rule and convolution to update the belief whenever the robot senses or moves. As the environment is static, Markov assumption holds: the agent’s location is the only state which affects sensor readings. Instead of maintaining a single hypothesis of the agent’s pose, Markov localization maintains a probability distribution over the space of all such hypothesis (Fox et al., 1999). Probabilities are used as weights of these different hypotheses in a formal mathematical way. A Markov localization method requires both an observation model and a motion model (Röfer et al., 2005). The observation model defines the probability for sensing certain measurements at certain locations. The motion model expresses the probability for certain actions to move the agent to certain relative poses. Markov localization is a direct application of state estimation within the framework of "Partially Observable Markov Decision Processes" (POMDP). POMDP use a state estimator for estimating the state of the world based on sensor data and on the actions taken by the agent. Markov localization is a special case of such a state estimator: the agent is a mobile robot and the state of the world is the position of the robot within its environment (Fox, 1998). Algorithm 1 shows the Markov localization method. First of all, a prediction is done using (line 1). Then the resulting belief is updated using percept (line 2). Finally, the action belief is normalized (line 3).
Algorithm 1. Markov localization 4.3 Monte Carlo Localization Monte Carlo localization (MCL) is a type of Markov localization in which the probability distribution over the space of all pose hypothesis of the agent is modeled with a set of particles (Thrun et al., 2005). Monte Carlo Localization is based on particle filters (a.k.a. Sequential Monte Carlo methods), which are approximate Bayes’ filters that use random samples for posterior estimation (Thrun et al., 2000) . Each particle represents the hypothesis of an agent having a certain pose. Such particles consist of a robot pose and a certain importance weight. Like in Sampling Importance Resampling (SIR) filters (Skare et al., 2003), the importance weights are approximations to the relative posterior probabilities (or
Probabilistic and Statistical Layered Approach for High-Level Decision Making
125
densities) of the particles. Also, Monte Carlo importance sampling resembles genetic algorithms (Higuchi, 1997). MCL has become very popular among localization algorithms in the last years, mainly because it is easy to implement, it can process raw sensor measurements, it is non-parametric and it can represent non-linear, non-Gaussian, multimodal probability distributions (Ronghua & Bingrong, 2004). by a set of weighted Formally, the MCL algorithm approximates the belief state samples (which represent a discrete probability density function) in the following way (43) The variable is a sample of the random variable L in time t. The variable represents importance weights. Ideally, each particle should be proportional to the posterior belief such that (44) These particles, together with the current control , are given as input to the motion model of the agent. Then each particle is weighted using the measurement model. After this, we have an updated set of particles. Finally, the most crucial step in MCL is executed: resampling, in which N new particles are selected with replacement from the updated set, where the probability of selecting each sample is proportional to its weight. After the resampling step, the particles approximate the true posterior belief. The resulting particle set has many duplicates due to selection with replacement, which causes particles with higher weights to appear more in the final set than particles with lower weights. Algorithm 2 shows the Monte Carlo localization method.
Algorithm 2. Monte Carlo localization
126
Robotic Soccer
4.4 Solving the Kidnapped Robot Problem The classical MCL algorithm presented in the above sections cannot recover from robot kidnapping or global localization failures. As time goes on, particles converge to a single pose and the algorithm is not able to recover if such a pose is invalid. The problem is ). This problem can be specially important when the particle set size is small ( solved by injection of random particles. Assume that the agent may be kidnapped at any time with small probability. Then add a fraction of random samples in the motion model for attacking the problem and adding robustness at the same time. The number of particles injected at each iteration changes over time. We can use the measurement probability for this purpose. Thrun (Thrun et al., 2005) proposed a modification to the MCL algorithm called Augmented Monte Carlo Localization (AMCL), which is shown in Algorithm 3.
Algorithm 3. Augmented Monte Carlo localization
Probabilistic and Statistical Layered Approach for High-Level Decision Making
127
Algorithm 3 injects random particles to counterattack the problem of global localization. The particles could be drawn according to a uniform distribution, but a better idea is to generate particles from the measurement distribution which is feasible due to the fact that the sensor model in our domain is based on landmarks. A new strategy is suggested: to fusion the information of every sensed landmark using a Kalman Filter, thus computing a more accurate pose from the measurements. With this strategy we aim to generate better particles for the injection of particles phase of AMCL. We call this approach KFSF-AMCL (Kalman Filter Sensor Fusion for AMCL). A Kalman Filter is a recursive filter which estimates the state of a system from incomplete and noisy measurements. In position tracking, the Kalman Filter has similar steps to the particle filter: it updates the state using a motion model and corrects it using the measurement model. When used for sensor fusion, only the measurement update is needed which is stated in the following equations
(45) is the current state or pose estimate, is the vector of measurements, is Kalman gain which minimizes the a posteriori error covariance, is the a posteriori estimate error covariance, is the measurement error covariance and relates the process state to the measurement.
Here,
4.5 Experiments A experiment was carried out to probe the performance of AMCL algorithm in the localization of a RoboCup 3D agent. Systematic resampling is used in all experiments because implementation of particle filters in robotics use this kind of mechanism very often (Thrun et al., 2005). Furthermore, the size of the particles set was fixed to 100, the vision is restricted (the official ranges are 180 degrees for the horizontal plane and 90 degrees for latitudal angle) and the AMCL parameters for injection of random particles were fixed to and . The experiment is aimed to prove the accuracy of the AMCL algorithm with different resampling strategies. A graphical explanation of the experiment is shown in figure 5.
Fig. 5. Scenario for localization experiment 1
128
Robotic Soccer
Table 3 shows the results obtained with simple MCL. The error is the x-axis is relatively big, given that the minimal kick distance is 0.07 meters between the agent and the ball. The error appears because the noise in effectors and perceptors is accumulated over time and the algorithm is unable to recover from errors due to low variance in particles.
Minimum Maximum Average Table 3. Accuracy of simple MCL
Error in x-axis 0.000174046 3.43221 1.18437
In table 4 we can see the comparison among different configurations of AMCL. The worst in the strategy is obviously the random landmark heuristic with an average error of axis were the agent is moving (x) and in the other axis (y). The maximum error is which is relatively high considering that the minimum kick distance to the ball is meters. Following the random strategy we have the closest landmark heuristic with an meters and the average of landmarks heuristic with meters. average error of AMCL algorithm with Kalman Filter Sensor Fusion gives the best results with an average error of meters, a maximum error of meters and a standard deviation of meters. Absolute Error standard Implementation maximum mean deviation Random 0.277 0.142 0.064 Closest 0.155 0.079 0.050 Average 0.090 0.045 0.022 KFSF 0.084 0.033 0.022 Table 4. Accuracy of AMCL with four different implementations of SampleLandmarkModel
5. Probabilistic Decision Making RoboCup simulation is an excellent test-bed for machine learning algorithms. It presents a multiagent cooperative and adversarial scenario in a partially observable, episodic, continuous and non-deterministic noisy environment. Given such uncertainty, classical logic-based approaches fail to achieve a high performance. Thus, a probabilistic method is ideal for dealing with this kind of environment. The simplest probabilistic approach is the Naive Bayesian classification (Langley et al., 1992) which has proven to be successful in many applications (Lewis, 1998) in spite of the not always fulfilled conditional independence assumption of the attributes given the class. If we wish to use this classifier in the RoboCup simulation domain, we confront two main issues. First, the classical Naive Bayes classifier assumes that the attributes are discrete, but in RoboCup simulation the attributes are in the range of real numbers and thus are continuous. Second, the classifier must lead to a fast decision process because the soccer simulator demands almost real-time decisions with low thinking times for the sense-think-act cycle of the agents.
Probabilistic and Statistical Layered Approach for High-Level Decision Making
129
In literature, continuous attributes are handled using conditional Gaussian distributions for each attribute’s likelihood given the class. Other approach is to discretize by crisp partitioning the domain of the attributes, but this can lead to loss of information. Instead of discretizing, the issues are overcome using a fuzzy extension namely Fuzzy Naive Bayesian classifier in the following way: the continuous attributes are fuzzified and combined with probabilities of the naive Bayes model in a straight easy way. The formulas used in the fuzzy extension resemble the original naive Bayes equations, so the classification process is still fast and reliable plus providing an incremental learning mechanism. The Fuzzy Naive Bayesian classifier is implemented in a RoboCup simulation 3D team for decision making. It was tested specifically to evaluate the best receiver of a pass in a given situation. In the next sections, an explanation is given about the Fuzzy Naive Bayes model. Furthermore, it is compared versus a Gaussian Naive Bayes classifier, another approach of handling continuous attributes. Initial results obtained on this chapter for the Fuzzy Naive Bayesian classifier applied to decision making in RoboCup 3D were published in (Bustamante et al., 2006). Later performance comparison to Gaussian Naive Bayes classifier in the same pass skill scenario was published in (Bustamante et al., 2006b). 5.1 Naïve Bayes and the Fuzzy Extension The Naive Bayes classifier is a simple Bayesian network with one root node that represents the class and leaf nodes that represent the attributes. Let be a class label with possible values, and be a set of attributes or features of the environment with a finite domain where . The classifier is given by the combination of the Bayesian probabilistic model with a maximum a posteriori (MAP) rule, also called discriminant function (Rish, 2001). The Naive Bayes classifier is defined as follows (46)
where is a complete assignation of attributes, i.e. a new example to be classified, is a short for and is a short for . The equation assumes conditional independence between attributes. To deal with continuous variables, the domain of attributes can be crisp partitioned, but that could cause a loss of information (Friedman & Goldszmidt, 1996). We use a better method proposed in (Störr, 2002), namely a Fuzzy Bayesian classifier, a hybrid approach in which attributes are fuzzified before classification. The Fuzzy Naive Bayesian classifier is defined as (47)
where attribute value that
and
denotes a membership function or degree of truth of
in a new example . All degrees of truth must be normalized such for all attributes .
130
Robotic Soccer
The probabilities required by the fuzzy model can be calculated similarly to classical Naive Bayes as (48) (49) (50)
where Laplace-correction (Zadrozny & Elkan, 2001) applied to smooth calculations avoiding extreme values obtained with small training sets. Here is the set of all training examples , where , refers to the number of examples , denotes the degree of truth of in a example , and is the membership of attribute in such example. All degrees of truth must be normalized such that
and
.
5.2 Gaussian Naïve Bayes One typical way to handle continuous attributes in the Naive Bayes classification is to use Gaussian distributions (Mitchell, 1997) to represent the likelihoods of the features conditioned on the classes. Thus each attribute is defined by a Gaussian probability density function (PDF) as (51) The Gaussian PDF has the shape of a bell and is defined by the following equation (52)
where is the mean and is the variance. In Naive Bayes, the parameters needed are in the order of , where is the number of attributes and is the number of classes. for each Specifically we need to define a normal distribution continuous attribute. The parameters of such normal distributions can be obtained with (53)
(54)
Probabilistic and Statistical Layered Approach for High-Level Decision Making
131
where is the number of examples where and is the number of total examples for all classes is easy using relative frequencies such used for training. Calculating that (55)
5.3 Empirical Scenarios Selecting a good scenario for training the classifiers is not trivial. In simulated soccer, there is a large set of possible scenarios for a given skill. The pass evaluation skill was chosen as the test-bed for the training of both classifiers. One of the reasons why it was selected is that passing is a fundamental characteristic of an agent that aims to play a soccer game. Specifically, deciding what teammate is the best receiver in a given situation could lead to better chances to score later in the game. The scenario used to obtain the training set is explained below. A passer agent is placed in , where the center of the field with the ball at a distance of is the minimum kicking radial distance between the agent and the ball stated in the soccer server. A teammate agent is placed near the ball at a distance . An from the ball. The angle opponent agent is placed similarly, with a distance between the teammate and the opponent from the ball’s view point must be . The passer agent aligns with the ball to pass it to its teammate and both the teammate and the opponent try to intercept the pass. Once the teammate touched the ball, the episode is labeled as SUCCESS. If the opponent touches the ball first, the episode is labeled as MISS. A graphical representation of this scenario is shown in figure 6.
Fig. 6. Training scenario for supervised learning of parameters of each classifier. Three agents are involved: a passer agent (A), a receiver teammate (T) and an opponent (O). The ball is marked as (B) In the case of the Fuzzy Naive Bayes classifier, aside of obtaining the probabilities of the bayesian model, we have to establish the fuzzy sets for each variable. Fuzzy sets represent linguistic values and are mathematically expressed with membership degree functions. We
132
Robotic Soccer
defined the fuzzy sets for each variable heuristically. The sets chosen for distance to the ball , distance to teammate and distance to opponent variables are {short, medium, long}, and for and variables are {closed, medium, wide}. A graphical representation of each fuzzy variable is shown in figure 7.
Fig. 7. Fuzzy Sets for each Fuzzy Variable. (a) Distance to the ball , (b) Distance to and distance to opponent , (c) Alignment Angle and (d) Angle teammate between teammate and opponent 5.4 Experiments For evaluating the efficiency in the domain of interest, we created a simulated-soccer testand the agent is placed scenario shown in figure 8. The ball is placed at . After that, three teammate agents and four at . opponents are placed randomly at The passer uses a classifier to choose the best receiver teammate, i.e. the teammate with better chances to intercept the pass successfully. The passer uses the classifier evaluating all 1 vs. 1 competitions between each teammate and each opponent (because the classifier was trained this way). Then it selects the teammate with the maximum probability of success given its worst probability in all its 1 vs. 1 competitions, formally (56) the set of all teammates, the set of opponents and being probability of success of the competition between teammate
and opponent
is the .
Probabilistic and Statistical Layered Approach for High-Level Decision Making
133
Fig. 8. Test scenario for the pass evaluation skill. Four opponent agents (black circles) and three teammates (gray circles) are placed randomly in a certain area. The passer (white circle) and the ball (little circle) are placed a few meters away Table 5 summarizes the success rates of Fuzzy Naive Bayes, the Gaussian Naive Bayes and additionally, a random strategy after 500 episodes. Class Fuzzy Naive Bayes Gaussian Naive Bayes Random Strategy SUCCESS 80.8 79.6 56.6 MISS 19.2 20.4 43.4 Table 5. Percentage of successful passes after 500 episodes on the test scenario As we can see in table 5, both the Fuzzy Naive Bayes classifier and the Gaussian Bayes classifier outperform the random strategy. But the difference between the Fuzzy Bayes and the Gaussian Bayes approaches is indiscernible. However, recall that fuzzy variables and fuzzy sets for each variable were chosen heuristically. This leaves an open path for researching the use of better variables and more accurate sets to increase the performance of the hybrid classifier.
8. References Bustamante, C.; Garrido, L. & Soto, R. (2006a). Fuzzy Naive Bayesian Classification in RoboSoccer 3D: A hybrid approach to decision making, Proceedings of the RoboCup International Symposium, , Bremen, Germany, June 2006, Springer Verlag Bustamante, C.; Garrido, L. & Soto, R. (2006b). Comparing Fuzzy Naive Bayes and Gaussian Naive Bayes for Decision Making in Robocup 3D, Proceedings of the 5th. Mexican International Conference on Artificial Intelligence (MICAI 06), pp. 237-247, ISBN 3540490264, Apizaco, Tlaxcala, Mexico, November 2006, Springer Bustamante, C.; Flores, C. & Garrido, L. (2007). A Physics Model for the RoboCup 3D Soccer Simulation, Proceedings of Agent-Directed Simulation Symposium (ADS 07), Norfolk VA, USA, March 2007 Cox, I. J. (1991). Blanche -- an experiment in guidance and navigation of an autonomous robot vehicle. IEEE Transactions on Robotics and Automation, Vol. 7, No. 2, 1991, pp. 193-204
134
Robotic Soccer
Fox, D. (1998). Markov Localization: A Probabilistic Framework for Mobile Robot Localization and Navigation, Ph.D. Thesis, University of Bonn, Germany Fox, D.; Burgard, W. & Thrun, S. (1999). Markov Localization for Mobile Robots in Dynamic Environments. Journal of Artificial Intelligence Research, Vol. 11, 1991, pp. 391-427 Friedman, N. & Goldszmidt, M. (1996). Discretization of continuous attributes while learning Bayesian networks, Proceedings of 13th International Conference on Machine Learning, pp. 157-165, Morgan Kaufmann, San Francisco, CA Langley, P.; Iba, W. & Thompson, K. (1992). An Analysis of Bayesian Classifiers, Proceedings of the 10th National Conference on Artificial Intelligence, pp. 223-228, AAAI Press and MIT Press, USA Lewis, D. (1998). Naive Bayes at forty: The independence assumption in information retrieval, Proceedings of the 10th European Conference on Machine Learning, pp. 4-15, ISBN 3540644172, Chemnitz, DE, 1998, Springer Verlag Marion, J. & Thornton, S. (2003). Classical dynamics of particles and systems, Brooks Cole, ISBN 0534408966, San Diego Mitchell, T. (1997). Machine Learning, McGraw Hill, ISBN 0070428077, New York Rish, I. (2001). An empirical study of the naive bayes classifier, Proceedings of IJCAI-01 workshop on Empirical Methods in AI, pp. 41-46 Röfer, T.; Laue, T. & Thomas, D. (2005). Particle-Filter-Based Self-localization Using Landmarks and Directed Lines, Proceedings of the RoboCup International Symposium, pp. 608-615, ISBN 3540354379, Osaka, Japan, July 2005, Springer Ronghua, L. & Bingrong, H. (2004). Coevolution Based Adaptive Monte Carlo Localization (CEAMCL). International Journal of Advanced Robotic Systems, Vol. 1, No. 3, September 2004, pp. 183-190 Russell, S. & Norvig, P. (2003). Artificial Intelligence: A Modern Approach, Prentice Hall, ISBN 0137903952, Englewood Cliffs, NJ, USA Skare, Ø.; Bølviken, E. & Holden, L. (2003). Improved Sampling-Importance Resampling and Reduced Bias Importance Sampling. Scandinavian Journal of Statistics, Vol. 30, No. 4, December 2003, pp. 719-737 Störr, H. P.; Xu, Y. & Choi, J. (2002). A compact fuzzy extension of the Naive Bayesian classification algorithm, Proceedings of InTech/VJFuzzy, pp. 172-177, Hanoi, Vietnam, 2002, Science and Technics Publishing House, Hanoi, Vietnam Thrun, S.; Fox, D.; Burgard, W. & Dellaert, F. (2000). Robust Monte Carlo Localization for Mobile Robot. Artificial Intelligence, Vol. 128, No. 1, 2000, pp. 99-141 Thrun, S.; Burgard, W. & Fox, D. (2005). Probabilistic Robotics (Intelligent Robotics and Autonomous Agents), The MIT Press, ISBN 0262201623, Cambridge, Massachusetts Xu, Y.; Jiang, C. & Tan, Y. (2006). SEU-3D Soccer Simulation Team Description, Proceedings of the RoboCup International Symposium, Bremen, Germany, June 2006, Springer Verlag Zadrozny, B. & Elkan, C. (2001). Obtaining calibrated probability estimates from decision trees and naive Bayesian classifiers, Proceedings of 18th International Conference on Machine Learning, pp. 609-616, ISBN 1558607781, Williams College, Massachusetts, June 2001, Morgan Kaufmann, San Francisco, CA