Mar 15, 2008 - answer to the question why while the second focuses on the question ... Problem Solving and Complex Systems. 3 the choice of the ant is ..... Figure 3 illustrates such a conversion. ... the final alignment in order to respect the compatibility of the unit. .... Ï represents the evaporation rate of the pheromones.
Problem Solving and Complex Systems
arXiv:0803.2314v1 [cs.NE] 15 Mar 2008
Fr´ed´eric Guinand, Yoann Pign´e⋆ Le Havre University (France)
Summary. The observation and modeling of natural Complex Systems (CSs) like the human nervous system, the evolution or the weather, allows the definition of special abilities and models reusable to solve other problems. For instance, Genetic Algorithms or Ant Colony Optimizations are inspired from natural CSs to solve optimization problems. This paper proposes the use of ant-based systems to solve various problems with a non assessing approach. This means that solutions to some problem are not evaluated. They appear as resultant structures from the activity of the system. Problems are modeled with graphs and such structures are observed directly on these graphs. Problems of Multiple Sequences Alignment and Natural Language Processing are addressed with this approach.
1 Introduction The central topic of the work presented in that paper is to propose a method for implicit building of solutions for problems modeled by graphs. Whatever the considered domain, physics, biology, mathematics, social sciences, chemistry, computer science... there exist numerous examples of systems exhibiting global properties that emerge from the interactions between the entities that compose the system itself. Shoal of fishes, flocks of birds [14], bacteria colonies [9], sand piles [5], cellular automata [15, 30], protein interaction networks [4], city formation, human languages [29] are some such examples. These systems are called complex systems [32]. They are opened, crossed by various flows and their compounds are in interaction with themselves and/or with an environment that do not belong to the system itself. ⋆
This work is partially supported by the French Ministry of Higher Education and Research.
2
Fr´ed´eric Guinand, Yoann Pign´e
They exhibit a property of self-organization that can be defined as an holistic and dynamic process allowing such systems to adapt themselves to the static characteristics as well as dynamic changes of the environment in which their compounds move and act. The work presented here aims at exploiting that self-organization property for computing solutions for problems modeled by graphs. The central idea consists in the conception of an artificial complex system whose entities move in and act on a graph (the environment) in which we are looking for structures of special interest: solutions of our original problem. In order to answer our expectations, the entities must leave some marks in the environment and these marks should define expected structures. In other words, we want to observe a projection on the graph of the organization emerging at the level of the complex system. For that purpose, the considered complex system has to be composed of entities able to move in the graph, able to interact with eachother and with their environment. The effects of this last kind of interactions materialize the projection of the organization of entities onto the environment. In ethology, structures and organizations produced by animal societies are studied according to two complementary points of view [25]. The first tries to answer to the question why while the second focuses on the question how. For the latter, the goal is to discover the link that exists between individual behavior and the structures and collective decisions that emerge from the group. In this context, self-organization is a key concept. It is indeed considered that the global behavior is an emergent process that results from the numerous interactions between individuals and the environment. More precisely, when animal societies are considered, three families of collective phenomena may be distinguished: (a) spatio-temporal organization of individual activities, (b) individual differentiation and (c) phenomena leading to the collective structuration of the environment. This latter phenomenon mainly occur with wasp, termite and ant societies. This explains probably why for about one decade, ants have inspired so much work on optimization [10]. The approach described in this paper is closely related with the question how. The more promising collective phenomenon for reaching our aim is the third one: collective structuration of the environment. Knowing previous works on ant colonies and more precisely on Ant System, artificial ants appear obviously as excellent candidates for representing the basic entities of our artificial complex system. Ants are mobile entities, they can interact directly using antennation and/or trophallaxy, or non directly, using the so-called stigmergy mechanism [12]. Stigmergy may be sign-based or sematectonic. Sign-based stigmergy is illustrated by ants dropping pheromones along a way from the nest to a food source. Sematectonic stigmergy is based on a structural modification of the environment, has illustrated by termites building their nest [13]. In its simplest version, an ant algorithm follows three simple rules. In order to simplify, let us consider that the algorithm operates on a graph: (1) each ant drops a small quantity of pheromone along the path it uses; (2) at a crossroads,
Problem Solving and Complex Systems
3
the choice of the ant is partially determined by the quantity of pheromones on each outgoing edge: the choice is probabilistic and the larger the quantity of pheromones on one edge, the larger the probability to choose this edge; (3) pheromones evaporate with the time. During the process, some edges are more frequently visited than other ones, making appear at the graph level some paths, groups of edges/vertices, or other structures resulting from the local and indirect interactions of ants. Artificial ant colonies have been widely studied and applied to optimization problems. The way they have been used makes ant colonies belonging to the general class of metaheuristics. This term refers to high level strategies that drive and modify other heuristics in order to produce solutions better than what could be expected by classical approaches. A metaheuristic may be defined as a set of algorithmic concepts that can be used for the definition of heuristic methods applicable to a large spectrum of problems [22]. A heuristic rests on a scheme that may be a constructive method or a local search method. In the former case, one solution is built using a greedy strategy, while a local search strategy iteratively explores the neighborhood of the current solution, trying to improve it by local changes. These changes are defined by a neighborhood structure that depends on the addressed problem. In [22], the authors note that artificial ants may be considered as simple agents and that the good solutions correspond to an emergent property resulting from the interactions between these cooperative agents. In addition, they describe an artificial ant in ACO (Ant Colony Optimization) as a stochastic building process that builds step by step a solution by adding opportunely elements to the partial solution. The considered problems are expressed in a classical way, with the definition of a space of solutions, a cost function that should be minimized and a set of constraints. Then, each ant possesses an evaluation function and this evaluation drives the process. Particle Swarm Optimization (PSO) is another kind of optimization method based on the collective behavior of simple agents. It is close to ant colonies, has been proposed and described in [17]. But once again, in PSO, each particle owns an evaluation function and knows what is the space of solutions. Each particle is characterized, at time t by its position, its speed, a neighborhood, and its best position according to the evaluation function since the beginning of the process. At each step, each particle moves and its speed is updated according to its best position, the position of the particle belonging to the neighborhood showing the better result to the evaluation function. Our approach, while belonging to the class of population-based methods, is different than both ACO and PSO. In our mind, depending on the model of the problem and on the characteristics of the ants, the role of each individual ant is not to compute a solution (neither complete, nor partial), but the solution has to be observable into the environment as the result of the artificial ants actions. That may be considered as a kind of implicit optimization. We argue that it is possible to compute non-trivial solutions to problems without using any global evaluation function. In what we have done, neither the ants, nor the
4
Fr´ed´eric Guinand, Yoann Pign´e
elements of the environment in which they move evaluate the result of their interactions during the process. The motivations for such an approach are multiple. Building a global evaluation function is sometimes not possible or would required an effort as important as solving the problem itself. Sometimes, the evaluation of the function is not conceivable during the resolution process because of the dynamics of the problem. Some other problems cannot be easily expressed as optimization problems, as in the example developed in Sect. 4. That’s the reason why the behavior of our artificial ants remains simple and only depends on local information. Depending on the application, we can have one or several collaborating or competing colonies. During the process, each ant can drop pheromones, interact with other ants, and modify its environment. The choice between several edges for proceeding with the path depends on the quantity of pheromones dropped by ants belonging to the same colony (attraction) and on the quantity of pheromones dropped by ants of another colony (repulsion). The modification of the environment may be the creation of a vertex or the deletion of an edge on the graph. In the sequel, the general approach is more precisely stated in Sect. 2. It is illustrated by two case studies: the bioinformatic problem of multiple sequence alignment (Sect. 3) and the search for interpretation trails in texts written in natural languages (Sect. 4). Sect. 5 exposes some difficulties facing this approach, particularly the identification of relevant parameters and characteristics and the sensitivity of the method to critical parameters. To finish, a conclusion draws some short and mid-term perspectives.
2 General Approach As a starting point, we consider problems that may be modeled by a graph. Evolutionary Computation excepted, in classical metaheuristics (ACO, PSO, GAs, tabu search based methods, GRASP), solutions are explicitly computed and one unavoidable step is the evaluation of these solutions in order to drive further investigations. In EC the individuals are not necessarily solutions of the considered problem, but it is always possible to build a solution from the set of individuals. This feature is not required for us. Indeed, our approach relies on the report that in many cases solutions correspond to structures in the graph. Such structures can be paths, set of vertices, set of edges, partitions of the graph... or any other group of graph elements. We consider this graph as the environment, into which many moving and active entities (our artificial ants) are born, operate, and (sometimes) die. They have the knowledge of neither the environment, nor the final goal of the system, nor the objective function. Their actions are not driven by the problem, only their characteristics may depend on it. Each ant can perform only two actions: to move and to modify the environment. Moving depends on local characteristics of the environment and sometimes on an additional basic goal (turning back
Problem Solving and Complex Systems
5
nest for instance). Modifications of the environment is used for both purpose: indirect communications between ants and structures forming in the environment. Modifications may be of two types, corresponding to the two stigmergy types: sign-based (the pheromones) and sematectonic (changes affect graph structure). In addition, the modifications of the environment have a feedback effect on the behavior of artificial ants as illustrated on Fig. 1.
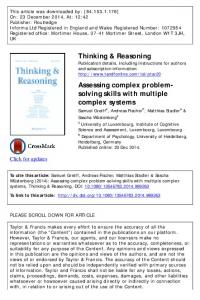
Fig. 1. The general model: The system evolves on the graph of the problem, modifies it and is influenced by its own modifications. Finally solutions are directly observed on the graph.
As mentioned in the introduction, artificial ants societies are complex systems, indeed, they are able to exhibit a self-organizing property that may be translated into, for instance, a set of edges with a large volume of pheromones, a set of vertices of the same color... as many structures that could be solutions of some problems in relation with the original graph. The general process for problem-solving using a complex system as described in the sequel is made of three steps: (1) identification of the structures in the graph that can be associated to solutions of the original problem, (2) choice of the features required by the system to achieve the goal (that is building of structures), (3) critical parameters tuning. Let us now enter into details. 2.1 Structures Identification The first step, before the construction of the system itself is to identify, for the graph modeling the considered problem, the structures that are solutions. Let us illustrate this with some examples: The problem of mapping consists in allocating sets of tasks to sets of resources. At the end of the process, each resource is allocated a set of tasks. With respect to the graph this corresponds to sets of vertices gathered ac-
6
Fr´ed´eric Guinand, Yoann Pign´e Table 1. Problem description Mapping Routing Partitioning TSP Shortest path Multiple sequence alignment DNA-Sequencing
Relevant structure sets of vertices set of paths sets of vertices circuits paths sets of edges paths
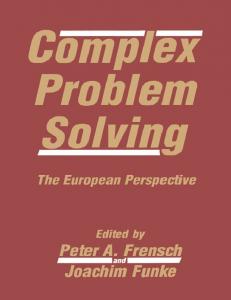
cording to their allocated resources. Multiple sequence alignment will be extensively described in Sect. 3, and Word Sense Disambiguation in Sect. 4. For DNA-Sequencing, there exists several graph formulations. In all cases, a solution corresponds to a path in the graph. According to the model, the path may be either a Hamiltonian path, an Eulerian path or a constrained path. In the case of multi-objective problems, the solutions can be presented as a set of paths or subgraphs that in the best case all belong to the Pareto front. However, a given problem may be modeled using different graph formulation, thus, it is unlikely to find only one association between a problem and a graph structure. Figure 2 illustrates how such structures may be observable directly by a user. The first picture (left-hand side) is a path built by ants for the shortest path problem. The original problem associated to the second picture is dynamic load balancing. This time, the structures are sets of colored vertices, to each color corresponds a resource. The method used for obtaining the right-hand side graph is described in the same volume [8]
Fig. 2. Example of structures solutions of two different problems.
2.2 The Model Our choice for a complex system based on artificial ants was their ability to modify their environment. Moreover, ant-based systems have an additional
Problem Solving and Complex Systems
7
property since the death of any ant do not impede the system to work. Finally, a lot of ants may be used together since they don’t directly communicate, but they use the environment instead, thus, the overhead entailed remains acceptable, and the whole system is easily distributed on a computer system (a grid for example) as soon as the environment (the graph) is itself distributed. As it is classically defined complex systems (CSs) are led by feedback loops. Positive feedback amplify the evolution while negative feedback reduce it. Ant-based systems are bound to the same mechanisms. Positive feedback takes place with stigmergy. When performing walks in the graph, ants modify their environment by structural changes in the graph (sematectonic stigmergy) or by laying pheromones down the graph (sign-based stigmergy). This modification are information for other ants that will later visit the same parts of the graph. These ants will be attracted by the environment’s information and will deposit their own information, attracting more and more ants into a positive feedback loop. If nothing stops the mechanism, the system freezes and cannot evolve anymore. To prevent the system from stagnating, negative feedback loops are used. In our approach, it is obtained with evaporation or erosion processes. In the nature, real pheromone do evaporate. This is a brake to previous stygmergic mechanisms. The ant-based complex system has three kinds of elements: the nests, the colonies and the ants. The conception of the system takes place at two levels: the colony level and the ant level, the nests are only positions from which the ants belonging to the corresponding colony begin their walks. Nests and Colonies The system may be constituted by one or several colonies. The choice of the number of colonies is mainly problem-driven. Indeed, if we need only one structure, in most cases one colony is enough. But, in case of solutions made of several structures determined as the result of a competition (partitioning or mapping for instance), then, several colonies should be necessary. However, sometimes, it is necessary that ants are born everywhere in the graph, in such particular cases, there is a one-to-one mapping between nests and vertices. One or more colonies of ants may operate into the environment. The nest of the colony can take place in the graph on one particular vertex, if the original problem defines a starting point. This is the case for instance when the structure is a path defined by a fixed starting point. However, there are also scenarios for which all vertices are nests, each corresponding to a distinct colony. In this case ants are competing for accessing some resources. It is also possible to design systems in which each vertex is a nest belonging to a supercolony (in the sense of unicoloniality [11] (Argentine ants in southern Europe)).
8
Fr´ed´eric Guinand, Yoann Pign´e
In all cases, an ant stemmed from one given colony inherit from this colony a set of characteristics (eventually empty), a color, a sensitivity to pheromones... More generally, colonies differentiation allow the use of different heuristics on the same problem. A wide range of global system behavior rise from this. One of the most interesting properties is the use of ant differentiation so as to raise competition or collaborative mechanisms. These mechanisms are useful when dealing with multiple objective problems or when the construction of clusters or subgraphs are desired. To obtain competition, it is common to assign a colony a color. Ants from one particular color lay down the environment ”colored” pheromones of the same color. Ants are attracted by the pheromones with their color and are repulsed by other colored pheromones. this general behavior lead to the coloration of disconnected parts of the graph like clusters or subgraphs. To obtain collaboration, the same mechanism is used. Ants deposit pheromones of their color and are attracted by it but there is no repulsion with other colors. This mechanism is ideal when dealing with multiple objective problems. One objective represent one color. Each colony enhances its objective while being attracted by all the pheromones. Ants First, general characteristics of ants are studied. Then details about the way pheromone trails are constructed and how ants move are considered. General Characteristics Each ant is autonomous, and independent from the others, it can thus be executed concurrently and asynchronously. Each ant is reactive to the environment and its local neighborhood is defined as the set of adjacent vertices and edges of the vertex the ant is located on. Local information available from this set of vertices and edges constitute the basic material for the ant to prepare its next move. These information are of two kinds: information belonging to the problem itself if the problem needs a valuation of vertices and edges. The topology of the graph can also indicates constraints from the problem (degree of vertices, directed versus non-directed graph). Second, the information raised from the activity of the ant colony: pheromones and other data deposit on the edges and on the vertices. Depending on the considered problem, ants are assigned characteristics. These characteristics are more or less problem specific. Some of them can be used with multiple problems and deserve a presentation: • •
The assignment of a color to the ants is useful when dealing with partitioning problems or multiple objective problems. A tabu list prevent ants from visiting twice an already visited vertex. The size of this list is relevant for many problems.
Problem Solving and Complex Systems
•
9
A sensitivity to pheromones parameter is usually used to find a balance between the reinforcement of pheromone trails and the diversification of the search. When ants are too much attracted by pheromones they follow already defined trails and don’t try to visit unexplored parts of the graph. On the contrary, if they don’t pay enough attention to the pheromones, no stigmergy is available.
Moves and Pheromones Every single ant’s general aim is to move in the graph and to lay down some pheromones during their moving. These walks are led by local information and constraints found in the environment. Ants lay down pheromone trails on their way. The quantity of pheromone deposited is a constant value or calculated with a local rule but is never proportional to any evaluation of a constructed solution. Pheromone is persistent: it continues to exist after the ant’s visit. This pheromone will influence other ants in the future, indeed, among the set of adjacent edges of one particular vertex v, the larger the quantity of pheromone on the adjacent edge the more attractive this edge will be for ants located on v. The choice of the next vertex to move to is done locally for each vertex as follows: Let consider a vertex i who’s neighbors vertices are given by the function neighbors(i) as a set of vertices. The probability Pi,j for one ant located on vertex i to move to neighbor vertex j is: Pi,j = P
τi k∈neighbors(i) τk
(1)
Different methods can be used to perform the pheromone lay down. The nature of the lay down and the nature of the pheromones themselves depends on the problem. Depending on the kind of solution that is expected, these moves will raise different structures. •
•
If the expected structure is a path or a set of paths in the graph defined by a source vertex and a destination vertex, then ants moves define paths. The Pheromone deposit can be done when going to the destination and when returning to the nest or when returning only. If the structures looks like clusters or subgraphs, then the moves don’t define paths. Ants have no destination but their behavior is not necessarily different from the previous one. But the existence of concurrent colonies may restrict the movements of ants and may entail a kind of gathering of ants of the same color in the same region. The pheromone deposit will be performed at each step. If ants are assigned a color, then the pheromones they lay down will be colored with the same color.
10
Fr´ed´eric Guinand, Yoann Pign´e
General Consideration about the Model The motivation of developing such a system comes from its three main properties: self-organization, robustness and flexibility. The system do not explicitly build structures, instead of that, structures appear as the results of the interactions between ants and between ants and the environment. This is a consequence of the self-organization property. The system do not compute explicitly solutions but rather relies on the notion of structures, thus, when changes occur within the environment, the whole process remains the same since no objective function is evaluated by ants, in other words, the behavior of ants changes in no way. Thus, intrinsically, this approach owns a robustness property. Finally, the system is flexible. Indeed, ants are autonomous and independent entities. If one or several ants disappear from the system, this one keeps on working. This property is very interesting because it allows a way of working based on flows of entities stemmed from colonies that may be subject to mutations (practically changes in some characteristics).
Problem Solving and Complex Systems
11
3 Multiple Sequence Alignment Multiple Sequence Alignment (MSA) is a wide-ranging problem. A lot of work is done around it and many different methods are proposed to deal with [6, 24, 27]. A subset of this problem, called multiple block alignment aims at aligning together highly conserved parts of the sequences before aligning the rest of the sequences. Here, the problem isn’t considered as a whole. The focus is done on the underlining problem of MSA that is the alignment of blocks between the sequences. 3.1 Description of the Problem Multiple alignment is an inescapable bioinformatic tool, essential to the daily work of the researchers in molecular biology. The simple versions come down to optimization problems which are for the majority NP-hard. However, multiple alignment is very strongly related to the question of the evolution of the organisms from which the sequences result. It is indeed allowed that the probability of having close sequences for two given organisms is all the more important as these organisms are phylogenetically close. One of the major difficulties of multiple alignment is to determine an alignment which, without considering explicitly evolutionary aspects, is biologically relevant. Among the many ways followed to determine satisfactory alignments, one of them rests on the notion of block. A factor is a substring present in several sequences and should correspond to strongly preserved zones from an evolutionary point of view. This particular point makes this approach naturally relevant from the biological point of view. Building blocks consists in choosing and gathering identical factors common to several sequences in the more appropriate way. A block contains at most one factor per sequence and one given factor can only belong to one block. The construction of blocks is one step of the full process of multiple sequence alignment and the choice of factors for building blocks is the problem we address. 3.2 Proposed Solution The general scheme for this kind of the method follows three steps: 1. Detection of common subsets (factors) in the set of sequences. 2. Determination of groups of common factors (blocks) without conflict between them. 3. Alignment of the rest of the sequences (parts of sequences that don’t belong to the set of blocks). The work done by the ant colony deals with the second step. The problem must be modeled as a graph. It will constitute the environment that the ants will be able to traverse. Solutions are observed in the graph as a set of relevant edges that link factors into blocks.
12
Fr´ed´eric Guinand, Yoann Pign´e
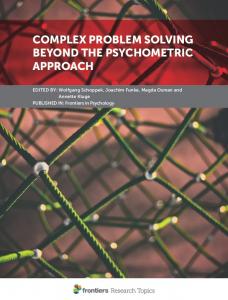
3.3 Graph Model As only factors of sequences are manipulated, each DNA or protein sequence considered is reduced to the list of its common factors with the other sequences of alignment. Figure 3 illustrates such a conversion.
Fig. 3. Sequences conversion This is an alignment composed of three sequences. Common subsequences of these sequences which are repeated are labeled. After the conversion, the alignment is described as sequence 1 = ACBCDE, sequence 2 = ABCDE and sequence 3 = ABCED.
Commonly, a graph is used to figure out the environment in which ants are dropped off. A multiple alignment is often represented by laying out the sequences one under the other and by connecting the identical factors together. Factors and their relations in the alignment can be represented as graphs. The factors are the vertices and the edges between these factors are the edges of the graph. A group of identical factors (with the same pattern) form a factor graph. The quantity of factor graphs is equal to the number of different factors. That is to say, given a factor ’A’, the factor graph ’A’ is a complete graph in which all the edges linking the factors belonging to the same sequence are removed. A group of blocks is said to be compatible if all of these blocks can be present in the alignment with no cross and no overlap between them. If two blocks cross each other, one of them will have to be excluded from the final alignment in order to respect the compatibility of the unit. In a graph representation, one can say that the crossings between the edges are to be avoided. This representation makes it possible to locate the conflicts between the factors which will prevent later the formation of blocks. Indeed, as in Fig. 4, the factors ’D’ and ’E’ of sequence 2 are linked to the factors ’D’ and ’E’ of sequence 3. These edges cross each other, which translates a conflict between 2 potential blocks containing these factors. The alignment is finally represented as a set of factor graphs. This graph G = (V, E) with V the set of vertices where each vertex is on factor of the alignment, and E the set of edges between vertices where an edge denotes the possibility for two common factors to be aligned together in the same block. The vertices of this graph are numbered. That is to say a factor X,
Problem Solving and Complex Systems
seq 1 : A
C
B
C
D
seq 2 : A
B
C
D
E
seq 3 : A
B
C
E
D
13
E
Fig. 4. The same alignment as in Fig. 3. Here, the factors and the edges between them are presented.
appearing for the j th time in the ith sequence gives a vertex labeled Xi,j . Figure 5 represent such a graph.
Fig. 5. The same alignment as in Fig. 3 and 4 represented with the graph model.
The constraints between edges that represent the conflicts between factors have to be represented. In this way a second graph G′ is constructed from the previous one. This new graph is isomorphic to the previous one, such that the vertices of this new graph are created from the edges of the previous one. From this new graph, a new set of edges, that represent the conflicts between factors, is created. As it can be observed in Fig. 6 these new vertices have two kind of edges: one kind of edges when two vertices share a common factor, and one kind of edge to represent the conflicts. In the following algorithm, the graph G is considered to be the environment the ant will use. G′ is only used to determined conflicts. 3.4 The Algorithm The general scheme of the behavior of the ant colony based system follows these rules:
14
Fr´ed´eric Guinand, Yoann Pign´e
Fig. 6. This graph G′ is isomorphic to G. It is called conflicts graph. It helps with the representation of conflicts between factors. The light edges represent the share of a common factor between two graphs. The Heavy edges represent the conflicts. ()
• • • •
Ants perform walks into the research graph. During these walks they lay pheromones down the edges they cross. They are attracted by the pheromone trails already laid down the environment. Constrained areas of the graph are repulsive for ants.
Like has been said in the Sect. 2, the first step of our approach is to characterize the solutions we are looking for. Formulation of a Solution This question is delicate because it returns to the nature of the problem. Indeed, multiple alignment is not only one fixed method. Many biological considerations come into play. Nothing guarantees besides that one is able to provide a coherent response without solids knowledge in molecular biology. Moreover, biologist themselves do not agree whether or not a given alignment is a good one. Popular functions like the sum of pairs [3] are widely debated. In consequence, the formulation of an evaluation function seems doubtful. It doesn’t seem to be so problematic since the method used doesn’t evaluate solutions. Moreover ants don’t construct solutions individually. Nevertheless, it is known that final alignments should be composed of blocks without conflicts. The simplest and relatively natural idea is to maximize the number of blocks formed without conflicts. But this goal is not founded on any biological consideration. Such a goal can probably draw aside from the solutions biologically better than those required. An interesting property can be observed without scientific considerations. Indeed starting from the factors one can evaluate the relative distance between 2 blocks compared to the set the factors. This information is simple and gives an advantage to edges between close factors, “geographically” speaking. Solutions in this model are carried out from the exploration of the system composed of ant colonies. High valuable edges in the environment end loaded with a large quantities of the pheromones. The most heavily loaded edges
Problem Solving and Complex Systems
15
belong to the solution. These edges link vertices that represent parts of the blocks of the solution. Since ants only perform walks in the environment, they do not consider any block formation nor try to minimize any conflict. From a general point of view, a non conflicted set of blocks rise from the graph. Pheromone Lay Down Let τij be the quantity of pheromone present on the edge (i, j) of graph G which connects the vertices i and j. If τij (t) is the quantity of pheromone present on the edge (i, j) at moment t, then ∆τij is the quantity of pheromone to be added to the total quantity on the edge at moment t + 1. So: τij (t + 1) = (1 − ρ).τij (t) + ∆τij
(2)
ρ represents the evaporation rate of the pheromones. Indeed, the modeling of the evaporation (like natural pheromones) is useful because it makes it possible to control the importance of the produced effect. In practice, the control of this evaporation makes it possible to limit the risks of premature convergence toward a local minimum. The quantity of pheromone δτij added on the edge (i, j) is the sum of the pheromone deposited by all the ants crossing the edge (i, j) with the new step of time. If m ants use the edge (i, j), then: ∆τij =
m X
∆τijk
(3)
k=1
The volume of pheromone deposited on each passage of an ant is a constant value Q. Feedback Loops In a general scheme, negative feedback loops prevent the system from continually increasing or decreasing to critical limits. In our system, constraints between conflicted edges are repulsive for ants. These negative loops aim at maintaining bounded quantities of pheromones. Let consider an ant going over the edge (i, j) of the graph G. The information on the isomorphic graph G′ returns that (i, j) is in conflict with edges (k, l) and (m, n). Then the quantities of pheromone will be modified consequently. δτij = δτij + q for the normal deposit of pheromone and δτkl = δτkl − q and δτmn = δτmn − q to represent negative feedback on the edges in conflict with (i, j). Transition Rule When an ant is on vertex i, the choice of the next vertex to be visited must be carried out in a random way according to a definite probability rule.
16
Fr´ed´eric Guinand, Yoann Pign´e
According to the method classically proposed in ant algorithms, the choose of a next vertex to visit is influenced by 2 parameters. First, a local heuristic is made with the local information that is the relative distance between the factors. The other parameter is representative of the stygmergic behavior of the system. It is the quantity of pheromone deposited. Note: Interaction between positive and negative pheromones can lead on some edges to an overall negative value of pheromone. Thus, pheromones quantities need normalization before the random draw is made. Let max be an upper bound value set to the largest quantity of pheromones on the neighborhood of the current vertex. The quantity of pheromone τij between edge i and j is normalized as τij = max − τij . The function neighbors(i) returns the list of vertices next to i. The choice of the next vertex will be carried out in this list of successors. The probability for an ant being on vertex i, to go on j (j belonging to the list of successors) is: P (ij) = P
1 ]α × [ d1ij ]β [ max−τ ij
1 α s∈neighbors(i)) [ max−τis ]
× [ d1is ]β
(4)
In this equation, the parameters α and β make it possible more or less to attach importance to the quantities of pheromone compared to the relative distances between the factors. 3.5 Results In the examples below, for a better readability, the factors are reduced to letters. A sequence is only represented with its factors. For example, ABBC is a sequence containing 4 factors, one factor labeled ’A’, two labeled ’B’ and 1 named ’C’. Let’s see some little alignments that require a particular attention. In the tables, the first column represents the original alignment. The other columns represent possible solutions. The last line of the table show the average number of time solutions are chosen over 10 trials. Table 2. AB AB BA
ABAB-BA 5
-AB -AB BA5
AB AB BA 0
The choice, in the table 2 must be made between the ’A’ factors and the ’B’ factors to determine which block will be complete. The algorithm cannot make a clear choice between the 2 first solutions.
Problem Solving and Complex Systems
17
Table 3. AB AA ABA
ABA-A ABA 10
--AB A-AABA0
--AB--A-A ABA-0
In the table 3, the choice of 3 blocks is wanted. The difficulty for the method is to discover the ’B’ block inside all the ’A’ factors. Table 4. DAZZZZ ACGSTD ACGSTD ACGSTD
DA-----ZZZZ -ACGSTD----ACGSTD----ACGSTD---0
DAZZZZ-----A----CGSTD -A----CGSTD -A----CGSTD 10
-----DAZZZZ ACGSTD----ACGSTD----ACGSTD----0
In the table 4, the ’A’ factor and the ’D’ factor on the first sequence have the same conflicts. The choice will be made thanks to the relative distance between the factors. Here, the rest of he ’D’ factor are far from the ’D’ factor of the sequence 1, so it will not be chosen. Table 5. BABAB BBABAAB BABAB
B-ABA-B BBABAAB B-ABA-B 0
-BABA-B BBABAAB -BABA-B 5
-BAB-AB BBABAAB -BAB-AB 5
The goal, in table 5 tests the aggregation capacity of the method. It is the concept of ”meta-block” that we want to highlight. Here, the first block of ’B’ factors can be align with the first ’B’ factor of the second sequence or with the second factor ’B’ on the same sequence. The algorithm will chose the second option because there is a meta-block at this position, i.e. two or more blocks where each factor on each sequence follow in the same order.
18
Fr´ed´eric Guinand, Yoann Pign´e
4 Natural Language Processing 4.1 Description of the Problem Understanding a text requires the comparison of the various meanings of any polysemous word with the context of its use. But, the context is precisely defined by the words themselves with all their meanings and their status in the text (verb, noun, adjective...). Given their status, there exist some grammatical relations between words. These relations can be represented by a tree-like structure called a morpho-syntactic analysis tree. Such a tree is represented on Fig. 7. PH
NP
ART
a
REL
ANP
PUNCT
PR
ADJ
N
small
bettle
that
VP
V
N
spoils
grain
.
Fig. 7. Morphosyntactic tree obtained from a lexical and grammatical analysis of the text. ART denotes article, PUNCT the punctuation, V stands for verb, N for noun...
This structure represents the syntactical relations between words, but in no way their semantics relations. In order to represent this new relational structure, we consider words as the basic compounds of an interaction network which implicit dynamics reveals the pregnancy of each meaning associated to any polysemous word. If we refer to the most commonly shared definition of a complex system, it states that it is a network of entities which interactions lead to the emergence of structures that can be identified as high-level organizations. The action of one entity may affect subsequent actions of other entities in the network, so that the action of the whole is more than the simple sum of the actions of its parts.2 . The actions in our context correspond to the meanings of the words constituting the text, and the sum of the actions results in the global meaning of the text, which is, for sure, much more than the simple sum of the meanings of the words. 2
[20] Why do we need artificial life ? page 305.
Problem Solving and Complex Systems
19
The addressed problem is twofold. On the one hand, we have to find a way of expressing words meanings interactions, and on the other hand, we have to conceive a system able to bring to the fore potential meanings for the whole text in order to help an expert for raising ambiguities due to polysemy. This problem is known as Word Sense Disambiguation (WSD). A more detailed description of the proposed solution can be found in [19]. 4.2 Models and Tools Thematic aspects of textual segments (documents, paragraphs, syntagms, etc.) can be represented by conceptual vectors. From a set of elementary notions, concepts, it is possible to build vectors (conceptual vectors) and to associate them to lexical items3 . Polysemous words combine the different vectors corresponding to the different meanings (Fig. 8 gives an illustration of conceptual vectors).
profit (profit).
benefice (benefit).
Fig. 8. Conceptual vectors of two terms (profit and benefit). In French, we can observe that profit is more polysemous than benefice. Moreover, from the graphical representation, it appears that both terms are closely related.
This vector approach is based on well known mathematical properties, it is thus possible to undertake well founded formal manipulations attached to reasonable linguistic interpretations. Concepts are defined from a thesaurus (in the prototype applied to French, [21] has been chosen where 873 concepts are identified). The building of conceptual vectors is a research domain in itself and is out of the scope of this brief example, so in the following, we consider that each meaning of a word is attached to a conceptual vector. In order to build the interaction network we need a way of deciding whether two terms are thematically related or not. For that purpose, we define two measures: Sim(A, B) a similarity measure between two vectors A and B that can be expressed as the scalar product of both vectors divided by the product of their norm, and the angular distance DA between two vectors A and B (DA (A, B) = arccos(Sim(A, B))) Intuitively, this latter function constitutes an evaluation of the thematic proximity and is the measure of the angle 3
Lexical items are words or expressions that constitute lexical entries. For instance, car or white ant are lexical items
20
Fr´ed´eric Guinand, Yoann Pign´e
between the two vectors. We would generally consider that, for a distance DA (A, B) ≤ π4 , (i.e. less than 45 degrees) A and B are thematically close and share many concepts. For DA (A, B) ≥ π4 , the thematic proximity between A and B would be considered as loose. Around π2 , they have no relation. The structures associated to solutions for our problem can be defined as a path or a set of paths. Each path correspond to a so-called interpretation trail. The fact that within a sentence several meanings may co-exist entails the possibility for several interpretation trails and thus of several distinct paths. 4.3 Ant-based Method Our method for WSD relies on both kind of stigmergy. Sign-based stigmergy plays a role in ant behaviors. Sematectonic stigmergy is used for modifying nodes characteristics and for creating new paths between vertices. In the sequel, these new paths will be called bridges. The ”binary bridge” is an experiment developed by [23]. As reported in [10] in this experiment, a food source is separated from the nest by a bridge with two equally long branches A and B. Initially, both paths are visited and after some iterations, one path is selected by the ants, whereas the second, although as good as the first one, is deserted. This experiment interests us for two reasons. It first shows that ants have the ability of organizing themselves in order to determine a global solution from local interactions, thus, it is likely to obtain an emergent solution for a problem submitted to an ant-based method. This point is crucial for our approach, since we expect the emergence of a meaning for the analyzed text. But, the experiment also shows the inability of such method, in its classical formulation, to provide a set of simultaneous and distinct solutions instead of only one at a time. As these methods are based on the reinforcement of the current best solution, they are not directly suitable for our situation. Indeed, if several meanings are possible for a text, all these meanings should emerge. That was the main motivation for introducing color as a colony characteristic. The computational problem is twofold. Indeed the meanings are not strictly speaking active entities. In order to ensure the interactions of the meanings of the whole text, an active framework made of ”meaning transporters” must be supplied to the text. These ”transporters” are intended to allow the interactions between meanings of text elements. They have to be both light (because of their possible large number) and independent (word meanings are intrinsic values). Moreover, when some meanings stemmed from different words are compatible (engaged with job for instance), the system has to keep a trace of this fact. This was the original motivation for us to consider ant-based complex systems as described in Sect. 2. A similar idea already existed in [16] with the COPYCAT project, in which the environment by itself contributes to solution computation and is modified by an agent population where roles and
Problem Solving and Complex Systems
21
motivations varies. We retain here some aspects mentioned in [28], that we consider as being crucial: (1) mutual information or semantic proximity is one key factor for lexical activation, (2) the syntactic structure of the text can be used to guide information propagation, (3) conceptual bridges can be dynamically constructed (or deleted) and could lead to catastrophic events (in the spirit of [26]). These bridges are the instrumental part allowing mutualinformation exchange beyond locality horizons. Finally, as pointed by [16], biased randomization (which doesn’t mean chaos) plays a major role in the model. In order to build several structures corresponding to competing meanings, we consider several colonies with the color characteristic. 4.4 Environment The underlying structure of the environment is the morphosyntactic analysis tree of the text to be analyzed. Each content word is a node. This node has as many children in the tree as senses. To each child associated to a sense corresponds a unique color: the conceptual vector of the sense. A child is also a nest and all children of a node associated to a content word are competing nests. An ant can walk through graph edges and, under some circumstances, can build new ones (called bridges). Each node contains the following attributes beside the morphosyntactic information computed by the analyzer: (1) a resource level R, and (2) a conceptual vector V . Each edge contains (1) a pheromone level. The main purpose of pheromone is to evaluate how popular a given edge is. The environment by itself is evolving in various aspects: 1. the conceptual vector of a node is slightly modified each time a new ant arrives. Only vectors of nests are invariant (they cannot be modified). A nest node is initialized with the conceptual vector of its word sense, other nodes with the null vector. 2. resources tend to be redistributed toward and between nests which reinvest them in ants production. Nodes have an initial amount of resources of 1. 3. the pheromone level of edges are modified by ant moves. The evaporation rate δ ensures that with time pheromone level tends to decrease toward zero if no ant are passing through. Only bridges (edges created by ants) would disappear if their pheromone level reaches zero. The environment has an impact on an ant and in return ants continuously modify the environment. The results of a simulation run are decoded thanks to the pheromone level of bridges and the resource level of nests. 4.5 Nests, Ant Life and Death A nest (word sense) has some resources which are used for producing new ants. At each cycle, among the set of nests having the same parent node (content
22
Fr´ed´eric Guinand, Yoann Pign´e
word), only one is allowed to produced a new ant. The color of this ant is the one of the selected nest. In all generality, a content word has n children (nests), and the nest chosen for producing the next ant is probabilistically selected according to the level of resources. There is a cost ǫ for producing an ant, which is deducted from the nest resources. Resource levels of nests are modified by ants. The probability of producing an ant, is related to a sigmoid function applied to the resource level of the nest. The definition of this function ensures that a nest has always the possibility to produce a new ant although the chances are low when the node is inhibited (resources below zero). A nest can still borrow resources and thus a word meaning has still a chance to express itself even if the environment is very unfriendly. The ant cost can be related to the ant life span λ which is the number of cycles the ant can forage before dying. When an ant dies, it gives back all the resources it carries plus its cost, to the currently visited node. This approach leads to a very important property of the system, that the total level of resources is constant. The resources can be unevenly distributed among nodes and ants and this distribution changes over time, sometimes leading to some stabilization and sometimes leading to periodic configurations. This is this transfer of resources that reflects the lexical selection, through word senses activation and inhibition. The ant population (precisely the color distribution) is then evolving in a different way of classical approaches where ants are all similar and their number fixed in advance. However, at any time (greater than λ), the environment contains at most λ ants that have been produced by the nests of a given content word. It means that the global ant population size depends on the number of content words of the text to be analyzed, but not on the number of word meanings. To our views, this is a very strong point that reflects the fact some meanings will express more than others, and that, for a very polysemic word, the ant struggle will be intense. A monosemic word will often serve as a pivot to other meanings. Moreover, this characteristic allows us to evaluate the computing requirements needed for computing the analysis of a given text since the number of ants depends only on the number of words. 4.6 Ant Population An ant has only one motivation: foraging and bringing back resources to its nest. To this purpose, an ant has two kinds of behavior (called modes), (1) searching and foraging and (2) returning resources back to the nest. An ant a has a resource storage capacity R(a) ∈ [0, 1]. At each cycle, the ant will decide between both modes as a linear function of its storage. For example, if the R(a) = 0.75, there is a 75% chance that this ant a is in bringing back mode. Each time an ant visits a (non-nest) node, it modifies the node color by adding a small amount of its own color. This modification of the environment is one factor of the sematectonic stigmergy previously mentioned and is the
Problem Solving and Complex Systems
23
means for an ant to find its way back home. The new value of the color is computed as follows: C(N ) = C(N ) + αC(a) with 0 < α < 1. In our application, colors are conceptual vectors and the “+” operation is a normalized vector addition (V (N ) = V (N ) + αV (a)). We found heuristically, that α = 1/λ constitutes a good trade-off between a static and a versatile environment. 4.7 Searching Behavior Given a node Ni . Nj is a neighbor of Ni if and only if there exists an edge Eij linking both nodes. A node Ni is characterized by a resource level noted as R(Ni ). An edge Eij is characterized by a pheromone level noted as P h(Eij ). A searching ant will move according to the resource level of each adjacent node (its own nest excepted) and to the level of pheromones of the outgoing edges. More precisely an attraction value is computed for each neighbor. This value is proportional to the resource level and inversely proportional to the pheromone level. attractS (Nx ) =
max (R(Nx ), η) Ph(Eix ) + 1
(5)
Where η is a tiny constant avoiding null values for attraction. The motivation for considering an attraction value proportional to the inverse of the pheromone level is to encourage ants to move to non visited parts of the graph. If an ant is at node Ni with p neighbors Nk (k = 1 · · · p), the probability PS (Nx ) for this ant to choose node Nx in searching mode is: attractS (Nx ) 1≤j≤p attractS (Nj )
PS (Nx ) = P
(6)
Then, if all neighbors of a node Ni have the same level of resources (including zero), then the probability for an ant visiting Ni to move to a neighbor Nx depends only on the pheromone level of the edge Eix . An ant is attracted by node with a large supply of resources, and will take as much as it can hold (possibly all node resources). A depleted node does not attract searching ants. The principle here, is a simple greedy algorithm. 4.8 Bringing Back Behavior When an ant has found enough resources, it tends to bring them back to its nest. The ant will try to find its way back thanks to the color trail left back during previous moves. This trail could have been reinforced by ants of the same color, or inversely blurred by ants of other colors. An ant a returning back and visiting Ni will move according to the color similarity of each neighboring node Nx with its own color and according to the level of pheromones of the outgoing edges. More precisely an attraction value is computed for each neighbor. This value is proportional to the similarity of
24
Fr´ed´eric Guinand, Yoann Pign´e
colors and to the pheromone level: attractR (Nx ) = max(sim(colorOf(Nx ), colorOf(a)), η) × (Ph(Eix ) + 1) Where η is a tiny constant avoiding null values for attraction. If an ant is at node Ni with p neighbors Nk (k = 1 · · · p), the probability PB (Nx ) for this ant to choose node Nx in returning mode is: attractR (Nx ) 1≤j≤p attractR (Nj )
PR (Nx ) = P
(7)
All considered nodes are those connected by edges in the graph. Thus, the syntactic relations, projected into geometric neighborhood on the tree, dictate constraints on the ant possible moves. However, when an ant is at a friendly nest, it can create a shortcut (called a bridge) directly to its home nest. That way, the graph is modified and this new arc can be used by other ants. These arcs are evanescent and might disappear when the pheromone level becomes null. From an ant point of view, there are two kinds of nests: friend and foe. Foe nests correspond to alternative word senses and ants stemmed from these nests are competing for resources. Friendly nests are all nests of other words. Friends can fool ants by inciting them to give resource. Foe nests instead are eligible as resource sources, that is to say an ant can steal resources from an enemy nest as soon as the resource level of the latter is positive. 4.9 Results The evaluation of our model in terms of linguistic analysis is by itself challenging. To have a larger scale assessment of our system, we prefer to evaluate it through a Word Sense Disambiguation task (WSD). A set of 100 small texts have been constituted and each term (noun, adjective, adverb and verb) has been manually tagged. A tag is a term that names one particular meaning. For example, the term bank could be annotated as bank/river, bank/money institution or bank/building assuming we restrict ourselves to three meanings. In the conceptual vector database, each word meaning is associated to at least one tag (in the spirit of [18]). Using tag is generally much easier than sense number especially for human annotators. The basic procedure is quite straightforward. The unannotated text is submitted to the system which annotates each term with the guessed meaning. This output is compared to the human annotated text. For a given term, the annotation available to the human annotator are those provided by the conceptual vector lexicon (i.e. for bank the human annotator should choose between bank/river, bank/money institution or bank/building). It is allowed for the human annotator to add several tags, in case several meanings are equally acceptable. For instance, we can have The frigate/{modern ship/ancient ship}
Problem Solving and Complex Systems
25
sunk in the harbor., indicating that both meanings are acceptable, but excluding frigate/bird. Thereafter, we call gold standard the annotated text. We should note that only annotated words of the gold standard are target words and used for the scoring. When the system annotates a text, it tags the term with all meanings which activation level is above 0. That is to say that inhibited meanings are ignored. The system associates to each tag the activation level in percent. Suppose, we have in the sentence The frigate sunk in the harbor. an activation level of respectively 1.5 , 1 and −0.2 for respectively frigate/modern ship, frigate/ancient ship and frigate/bird. Then, the output produced by the system is: The frigate/{modern ship:0.6/ancient ship:0.4}. Precisely, we have conducted two experiments with two different ranking methods. A Fine Grained approach, for which only the first best meaning proposed by the system is chosen. If the meaning is one of the gold standard tag, the answer is considered as valid and the system scores 1. Otherwise, it is considered as erroneous and the system scores 0. A Coarse Grained approach, more lenient, gives room to closely related meanings. If the first meaning is the good one, then the system scores 1. Otherwise, the system scores the percent value of a good answer if present. For example, say the system mixed up completely and produced: The frigate/{bird:0.8/ancient ship:0.2}. the system still gets a 0.2 score.
Table 6. Scoring scheme All terms Nouns Adjectives Verbs Adverbs Fine Grain Scoring 0.68 0.76 0.78 0.61 0.85 Coarse Grain Scoring 0.85 0.88 0.9 0.72 0.94
These results compare quite favorably to other WSD systems as evaluated in SENSEVAL campaign [1]. However, our experiment is applied to French which figures are not available in Senseval-2 [2]. As expected, verbs are the most challenging as they are highly polysemous with quite often subtle meanings. Adverbs are on the contrary quite easy to figure when polysemous. We have manually analyzed failure cases. Typically, in most cases the information that allows a proper meaning selection are not of thematic value. Other criteria are more prevalent. Lexical functions, like hyperonymy (is-a) or
26
Fr´ed´eric Guinand, Yoann Pign´e
meronymy (part-of) quite often play a major role. Also, meaning frequency distribution can be relevant. Very frequent meanings can have a boost compared to rare ones (for example with a proportional distribution of initial resources). Only if the context is strong, then could rare meanings emerge. All those criteria were not modeled and included in our experiments. However, the global architecture we propose is suitable to be extended to ants of other caste (following an idea developed by Bertelle et al. in [7]). In the prototype we have developed so far, only one caste of ants exists, dealing with thematic information under the form of conceptual vectors. Some early assessments seem to show that only with a semantic network restricted part-of and is-a relations, a 10% gain could be expected (roughly a of gain 12% and a lost of 2%).
Problem Solving and Complex Systems
27
5 Analysis From the problems presented Sects. 3 and 4 the three main steps identified in Sect. 2 can be argued. 5.1 Identification of the Structures The first necessity when using our approach is to clearly identify and define the shape of the desired structures in the environment graph. This definition must be clearly established when modeling the problem. In other words, the conception of a graph model for one particular problem must be done in consideration of the necessary structures. Finally, the generated model must be practicable by the system and must permit the production of such structure. 5.2 Choice of General Features to Achieve the Goal Secondly, from the description of the wanted structures, a choice of general characteristics for nests, colonies and ants has to be made. These characteristics define general behaviors that lead the system to produce wanted structures. Let consider as an example two general groups of characteristics that lead to two different kind of structures: •
•
If a path or a set of paths is desired as solution to one problem, then, some nests must be defined in the graph. They are assigned a vertex of the search graph. Ants are given one or more destinations vertices so as to perform walks between a nest and a destination. Thus, the system will produce paths between two vertices. The pheromone deposit can be performed when going back to the nest. A tabu list is used, its size depends heavily on the shape of the graph but it is generally equal to the size of the whole tour of the ant. The tabu list prevents ants form making loops in their paths. If sub-graphs or sets of vertices/edges are wanted, there is not one special vertex that represents the nest, indeed, ants are displayed on every vertices of the graph. So it is considered that each vertex of the graph is a nest. More than one colony is used so as to define competitive behaviors between ants. Ants are assigned a colony specific color and deposit colored pheromones at each edge cross. A tabu list is used but its purpose is to prevent ants from stagnating on a same couple of vertices, so it has a relatively small size.
This general settings define a global behavior of the system for common kinds of solution structures but are not enough to lead the system in a precise problem.
28
Fr´ed´eric Guinand, Yoann Pign´e
5.3 Relevant Parameters Tuning Thirdly, after the definition of a structure and a general set of characteristics to solve one problem, a set of relevant parameters need to be identified. Modifications of these parameters bring behavioral changes to the system. In effect, once the general process defined, these relevant parameters permit the adaptation to the precise problem and to the precise environment. Finally the tuning of those parameters sounds quiet difficult and require attention. As said by Theraulaz in [25], one of the signatures of self-organizing processes is their sensitivity to the values of some critical parameters. It has been observed from experiments that some parameters are probably linked there is probably a sort of ratio that is to be found between them. Another idea that these parameters are strongly related to the nature of the environment that is considered. One simple example of this correlation is the relative dependency between the number of ants and the number of elements (vertices and edges) of the graph. It is true that a bigger graph will require a bigger colony to explore it, but how much ant for how much element is an hard question and probably depends to other values like the average degree of each vertex (its connectivity). 5.4 An Example of this Analysis The quite simple shortest path problem has been modeled. In this problem, the shortest path between two points of an environment is to be found. The environment is modeled with a graph where the start point and the end point are two particular vertices of this graph. The first step that is the definition of the desired structures is straightforward. One solution is one path in the graph starting from one of the two previously defined points and stopping at the other one. In the second step, the general characteristics are defined so as to create this path. One ant colony is used. One nest is located on the start vertex. Ants start their exploration from the nest and are looking for the end vertex. When the destination is found, they go back to the nest by laying pheromone down the edges of the paths they found. They use a tabu list who’s size is of the order of the constructed path’s length. In the third step, experiments allowed the identification of four relevant parameters: •
•
The number of ants, that define the total number of ant agent in the colony. It seams to be highly related to the distribution of the edges in the graph. The evaporation rate for the pheromone quantities. If a high evaporation value is set, it is difficult for ants influence each other with pheromones. They will explore new parts of the graph better than exploiting already visited areas. If the evaporation is set to a lower value, pheromone trails evaporate slowly, they are stronger and bring ants to already visited paths.
Problem Solving and Complex Systems
•
•
29
The tabu list size defines the number of already visited edges that cannot be crossed again. This parameter prevents ants from making loops. It would normally be set to the length of the constructed path, in other words, ants are not allowed to visit twice the same vertex. Actually, this parameter needs sometimes to be set to a lower value depending on the shape of the graph. The exploration threshold defines the sensitivity of the ants to the pheromone trails. It is usually used to find a balance between the intensification of pheromone trails and the diversification of the search. For one ant situated on vertex i, this parameter (q0 ) influences the calculation of the transition rule. q0 is the probability (0 ≤ q0 ≤ 1) of choosing the most heavily loaded edge in pheromones among outgoing edges of the local vertex i. The normal transition rule (1) is chosen with probability 1 − q0 . When ants are too much attracted by pheromones they follow already defined trails and don’t try to visit unexplored parts of the graph. On the contrary, if they don’t pay enough attention to the pheromones, no stigmergy is available.
As an example, let’s consider a torus graph composed of 375 nodes and 750 edges. The shortest path in this graph has to be determined between two defined vertices. The shortest path between those vertices is 20 edges long. A torus has no border. Each vertex has exactly 4 outgoing edges. Among experiments carried out the following parameter set gives good results for his graph: • • • •
Number of ants = 100. Evaporation rate = 0.03. Note: the evaporation process is performed at each step. One step represents one vertex move for each ant of the colony. Tabu list size = size of the length of the path. Exploration threshold = 0.6.
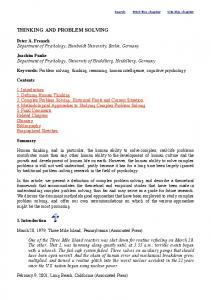
Figure 9 shows 4 different states of the graph when ants are running on it. This figure illustrates the way a path emerges from the activity of the whole colony. At first ants perform random walks. When ants discover the destination vertex, they go back to the nest and lay down the graph a pheromone trail. That why in the early steps of the run, pheromones are lay approximatively everywhere on the graph. When ants performing shorter paths they are faster and can lay down more pheromone trails. Finally a shortest emerges in the pheromone trails.
This is true that the values of different parameters are highly related to the structure of the graph Between two vertices of this graph, the quantity of possible shortest paths can be important. In this graph, ants can easily make a lot of loops without finding the destination vertex. The use of a tabu list becomes useful in this
30
Fr´ed´eric Guinand, Yoann Pign´e
(a) 120 steps
(b) 180 steps
(c) 230 steps
(d) 360 steps
Fig. 9. The search of the shortest path between two points of a torus graph. The darker the arcs of the graph, the higher the quantity of pheromone. Figure (a) is a picture of the graph at step 120. A step is a one vertex move for each ant of the colony. Figure (b) is a picture of the same graph after 180 steps and so on.
kind of graph. In effect, the tabu list prevents ants from making loops in the graph. Experiments show that the use of a tabu list that represent the size of the whole path of the ant gives good results. It is to say that ants are never allowed to cross already visited nodes. If it’s true that the use of a tabu list is efficient in the case of a torus graph, but it is not in all circumstances. Let us consider the graph Fig. 10. In this graph there is no cycle, it is a tree. If a tabu list is used, ants will loose them self in leafs of the tree without been able to go back. If no tabu list is
Problem Solving and Complex Systems
31
use at all, then strange phenomena occur where some ant go from vertex A to vertex B, then go back to A and so on. Finally the best solution in this case is to use a tabu list to prevent stagnation and to allow ants to go back when no more vertices are available. A relatively few ants are necessary for this graph.
Fig. 10. A tree with 750 edges and 751 nodes.
5.5 Questions Hold by this Approach The first question is about the system’s ability to produce such structures. How can one be sure that the system will produce structures that have not been defined anywhere in the system? No proof can be given that such structure will rise. The only evaluation is the user’s point of view when observing the graph.
32
Fr´ed´eric Guinand, Yoann Pign´e
The method we propose here, as well as the majority of the metaheuristics, is composed of a set of control parameters that need to be tuned, more or less according to the problem considered. Values taken by these parameters represent a multidimensional space. One given set of parameter will produce one solution. If another set of parameters is given to the system, another solution may appear. The question asked deals with the existence of particular conditions bounded to the values of parameters. Is it possible to make a parallel between the different sets of parameters and the one dimensional cellular automata classification made by Stefen Wolfram [31] where different classes of solutions exist: • • • •
Class I: Fixed configurations. All the automaton cells have the same state. Class II: Simple structures. Repetitions can be observed. Class III: Chaotic solutions. This kind of automaton usually produce fractal structures. Class IV: In this class, complex organizations appear, many different structures are observed.
Jean-Claude Heudin [15] proposed to compare Wolfram’s classification with experiments made on two dimensional automata where one parameter can take different values. In his model, the different possible values of the β parameter produce different solutions that can be classified with the above scheme. The beta parameter defines the number of active neighbors around one particular cell necessary to maintain it in its state. For one particular value β = 2, the automaton produced becomes a ”game of life” witch is part of the IV class. Back to the model presented here, is it possible to make such a parallel so as to classify the produced solutions. In other words, are there particular areas in the parameter space where the system produces nothing, where it produces incomprehensible solutions (many different structures, continually changing) and where it produces understandable solutions (a structure with the shape of what we are looking for). Finally if such a comparison can be done, let’s call systems with good sets of parameters, class IV systems. In this case of emerging class IV structures: •
• •
•
Are the produced structures stable when a little variation occur in the parameter set ? Is the system robust to few changes in the parameter space ? What are the characteristics that can be carried out from the solutions ? Do all the structures that belong to the class IV share a common (or closed) area in the multidimensional space of parameters or are there islands of parameters ? In the case of islands, in one particular island, does a little change in the parameter lead to a similar solution with little differences ?
Problem Solving and Complex Systems
33
6 Conclusion This paper presented an implicit building solution approach using emergent properties of ant-based complex systems. Ant Systems are particularly adapted to the observation of emerging structures in an environment as solutions to a given problem. This approach is relevant especially in case of problems where no global evaluation function can be clearly defined and/or when the environment changes. The according modeling and solving of two problems illustrated the use of this model. It raised the heavy importance that must be given to the tuning of some critical parameters. This set of parameters is seen as a multidimensional space of possible values. In this space some islands of values may lead to produce wanted structures. If these structures are considered as class IV structures, like Wolfram’s automata, then one part of the future work will consist in the identification and the understanding of the areas of parameters. An analyze of the method was started, it introduced the basis of the future work to be done. The final aim in this project is to construct a kind of ”grammar” of the different possible structures and the different systems running on it.
References 1. Senseval. URL: http://www.itri.brighton.ac.uk/events/senseval/, 2000. 2. Senseval-2. URL: http://www.sle.sharp.co.uk/senseval2/, 2001. 3. S. F. Altschul. Gap costs for multiple sequence alignment. Journal of Theoretical Biology, 138:297–309, 1989. 4. P. Amar, J.-P. Cornet, F. K´ep`es, and V. Norris, editors. Proceedings of the Evry Spring School on ”Modelling and Simulation of Biological Processes in the Context of Genomics”, 2004. 5. P. Bak. How Nature works: the science of self-organized criticality. SpringerVerlag, 1996. 6. G. J. Barton and M. J. E. Sternberg. A strategy for the rapid multiple alignment of protein sequences: Confidence levels from tertiary structure comparisons. J. Mol. Biol., 198:327–337, 1987. 7. C. Bertelle, A. Dutot, F. Guinand, and D. Olivier. Dna sequencing by hybridization based on multi-castes ant system. In proceedings of the 1st AAMAS Workshop on Agents in Bioinformatics (Bixmas), Bologna (Italy), 15 july 2002. 8. F. G. C. Bertelle, A. Dutot and D. Olivier. Colored ants for distributed simulations. In proceedings of ANTS 2004. Brussels (Belgium), September 5-8, volume 3172 of LNCS, pages 326–333, 2004. 9. H. L. E. Ben-Jacob. Des fleurs de bactries. Pour la Science - Les formes de la vie, HS-44:78–83, 2004. 10. G. T. E. Bonabeau, M. Dorigo. Swarm Intelligence: from natural to artificial systems. Oxford University Press, 1999. 11. T. Giraud, J. Pedersen, and L. Keller. Evolution of Supercolonies: the Argentine ants of southern Europe. PNAS, 99(9):6075–6079, 2002.
34
Fr´ed´eric Guinand, Yoann Pign´e
12. P.-P. Grass´e. La reconstruction du nid et les coordinations inter-individuelles chez belicositermes natalensis et cubitermes s.p. la th´eorie de la stigmergie : essai d’interpr´etation du comportement des termites constructeurs. Insectes sociaux, 6:41–80, 1959. 13. P.-P. Grass´e. Termitologia, Tome II. Fondation des soci´et´es. Construction. Masson. Paris, 1984. 14. G. G. H. Chat´e. La forme des groupements animaux. Pour la Science - Les formes de la vie, HS-44:57–61, 2004. 15. J. C. Heudin. L’Evolution au bord du chaos. Hermes, 1998. 16. D. Hofstadter. Fluid Concepts and Creative Analogies: Computer Models of the Fundamental Mechanisms of Thought (together with the Fluid Analogies Research Group). Basic Books. NY, 1995. 17. R. C. E. J. Kennedy. Swarm Intelligence. Morgan Kaufmann Publishers, 2001. 18. Jalabert and M. Lafourcade. From sense naming to vocabulary augmentation in papillon. In Proceedings of PAPILLON-2003, page 12, Sapporo (Japan), July 2002. 19. M. Lafourcade and F. Guinand. Artificial ants for natural language processing. to appear in: International Journal of Computational Intelligence Research, 2006. 20. C. G. Langton, editor. Artificial Life: an overview. MIT. 2nd edition, 1996. 21. Larousse, editor. Th´esaurus Larousse - des id´ees aux mots, des mots aux id´ees. Larousse, 1992. 22. T. S. M. Dorigo. Ant Colony Optimization. MIT Press, 2004. 23. J. Pasteels, J. Deneubourg, S. Goss, D. Fresneau, and J. Lachaud. Selforganization mechanisms in ant societies (ii): learning in foraging and division of labour. Experientia Supplementa, 54:177–196, 1987. 24. W. Taylor. A flexible method to align large numbers of biological sequences. J Molec Evol, 28:161–169, 1988. 25. G. Theraulaz. Auto-organisation et comportement, chapter Auto-organisation et comportements collectifs dans les socits animales : introduction, pages 79–83. Collection Systmes Complexes. Herms, 1997. 26. R. Thom. Stabilit´e structurelle et morphog´en`ese. InterEditions (Paris), 1972. 27. J. D. Thompson, D. G. Higgins, and T. J. Gibson. Clustal w: improving the sensitivity of progressive multiple sequence alignment through sequence weighting, position specific gap penalties and weight matrix choice. Nucleic Acids Research, 22:4673–4680, 1994. 28. K. W. C. W. Gale and D. Yarowsky. A method for disambiguating word senses in a large corpus. Computers and the Humanities, 26:415–439, 1992. 29. H. Walter. L’aventure des langues en occident. Robert Laffont, 1994. 30. S. Wolfram. Universality and complexity in cellular automata. Physica D, 10:91–125, 1984. 31. S. Wolfram. Universality and complexity in cellular automata. Physica D, 10:1–35, 1984. 32. H. Zwirn. La complexit´e, science du xxie si`ecle ? Pour la Science - La complexit´e, 314:28–29, 2003.