May 1, 2007 - 1.1 Introduction To The Test Protocol for PEM Cell Screening Test. ..... D4.6 Nomenclature of Test Condition Temperatures. ...... and complete the corresponding worksheet, which is filed by the CHO. Topics of these videos.
FSEC’s Procedures
For Performing PEM Single Cell Testing Test protocol for Cell Performance Tests
Work Performed Under
DOE Contract # DE‐FC36‐06GO16028
April 8, 2009
EXECUTIVE SUMMARY This document defines, in detail, a test protocol for performing proton exchange membrane (PEM) single cell testing. Development of this test protocol is a part of the requirements of FSEC’s Task 5, Characterize MEA Performance, under DOE Contract #DE‐FC36‐06GO16028. This test protocol has been evaluated and is used at FSEC for single‐cell testing. Under this contract, FSEC will perform single‐cell tests to assess the relative merits of the candidate membranes that are submitted by the Task 1 team members. These tests will be conducted at operating conditions that are of interest to the DOE and, where appropriate, will be run using identical procedures on all tested cells. Task 1 team members that are continuing beyond the Go – No Go milestone are requested to review this document and identify “conditions that are of concern.” FSEC will iterate with these Task 1 team members to resolve these concerns Researchers following the test protocol will be able to reproduce results that have been obtained by FSEC.
Contents 1. Overview of FSEC’s Procedures for Performing PEM Single Cell Testing ................................... 6 1.1 Introduction To The Test Protocol for PEM Cell Screening Test.......................................... 6 1.2 Components to be Delivered ............................................................................................... 6 1.3 Details of the Cell ................................................................................................................. 6 1.4 Membrane, CCM, and GDL Thickness Measurement .......................................................... 8 1.5 Cell Assembly. ...................................................................................................................... 9 1.6 Pre‐Test Integrity Test........................................................................................................ 10 1.7 Tests Performed on Each Cell ............................................................................................ 10 1.7.1 Linear Sweep Voltammetry, Cyclic Voltammetry, And Cell Conditioning ................. 10 1.7.2 Performance Verification Test ................................................................................... 13 1.7.3 Post‐test Integrity Test ............................................................................................... 15 1.7.4 Post‐test Analysis ....................................................................................................... 15 1.7.5 Cell Data Report ......................................................................................................... 16 1.8 Fuel Cell Hydrogen Safety Plan .......................................................................................... 16 2. Day by Day PEM MEA Test Sequence ....................................................................................... 19 2.1 Assemble the Cell............................................................................................................... 19 2.2 Day 1................................................................................................................................... 19 2.3 Day 2................................................................................................................................... 20 2.4 Day 3................................................................................................................................... 20 2.5 Day 4 (at 1.5 atm)............................................................................................................... 20 2.6 Days 5, 6, and 7 (at 1.5 atm) .............................................................................................. 21 2.7 Day 8 (at 1.5 atm)............................................................................................................... 21 2.8 Day 9................................................................................................................................... 22 Appendix A: Gurley Number Procedure ....................................................................................... 23 A1 Reference Materials............................................................................................................ 23 A2 Introduction ........................................................................................................................ 23 A3 Materials and Equipment ................................................................................................... 24 A3.1 Materials ..................................................................................................................... 24 A3.2 Equipment................................................................................................................... 24 A3.3 Quality Control ............................................................................................................ 25 A4 Main Gasket Preparation.................................................................................................... 25 A5 Preparation of Subgaskets .................................................................................................. 25 A6 Preparation of Gas Diffusion Layer Samples ...................................................................... 26 A7 Cleaning of Fuel Cell Components ...................................................................................... 26 A8 Assembly Procedure ........................................................................................................... 26 A9 Leaking Check Procedure.................................................................................................... 29 A10 Data Process...................................................................................................................... 29 A10.1 Data Sheet Gurley Number Calculations .................................................................. 30 A11 Acceptance........................................................................................................................ 30
2
Appendix B: PEM Fuel Cell Unit Cell Assembly Procedure ........................................................... 31 B1 Reference Materials............................................................................................................ 31 B2 Bill of Materials ................................................................................................................... 31 B2.1 Materials ..................................................................................................................... 31 B2.2 Equipment ................................................................................................................... 31 B3 Objectives............................................................................................................................ 32 B4 General Instructions............................................................................................................ 32 B5 Preparation for Cell Assembly….......................................................................................... 32 B6 Assembling the Cell – Fuel Cell Technology (FCT) Hardware Set. ...................................... 32 Appendix C Procedure for Leak Testing a Single Cell After Assembly .......................................... 34 C1 External Leak Test ............................................................................................................... 34 C1.1 Procedure .................................................................................................................... 34 C2 Internal Leak Test................................................................................................................ 35 C2.1 Procedure for Internal Leak Test................................................................................. 35 Appendix D PEMFC Unit Cell Test ................................................................................................. 37 D1 Reference Materials ........................................................................................................... 37 D2 Bill of Materials................................................................................................................... 37 D2.1 Materials ..................................................................................................................... 37 D2.2 Equipment................................................................................................................... 37 D3 Objectives ........................................................................................................................... 37 D4 General Instructions ........................................................................................................... 38 D4.1 Fuel Cell System Configuration ................................................................................... 38 D4.2 Explanation of the Test Station................................................................................... 38 D4.3 Hardware Specifications ............................................................................................. 39 D4.4 Data Filing Naming Conventions................................................................................. 39 D4.6 Nomenclature of Test Condition Temperatures......................................................... 39 D4.7 Handling of Gas Tanks................................................................................................. 40 D5 Day 1 Test ........................................................................................................................... 40 D5.1 Setup Cell Hardware on the Test Station.................................................................... 40 D5.2 Preparation of Cell Test on the Test Station............................................................... 40 D5.3 Operation of Computer to Start Up Cell ..................................................................... 40 D5.4 Crossover and Cyclic Voltammetry Tests at 25/25/25 ............................................... 42 D5.5 Humidification of the Membrane ............................................................................... 44 D5.6 Operation of the Cell in Break‐In Mode...................................................................... 45 D5.7 Cool‐Down Procedure................................................................................................. 45 D6 Day 2 Test ........................................................................................................................... 46 D6.1 Crossover and Cyclic Voltammetry Tests at 25/25/25 ............................................... 46 D6.2 Polarization Curve Measurement at 80/80/73 (Air/O2 Alternating) .......................... 46 D6.3 Crossover and Cyclic Voltammetry Tests at 80/80/73 ............................................... 48 D6.4 Hold at 400 mA/cm2 Overnight .................................................................................. 49 D7 Day 3 Test ........................................................................................................................... 49 D7.1 Performance Measurement at 80/80/73 (Air/O2 Alternating, 1.5 atm)..................... 49 3
D7.2 Performance Measurement at 100/90/90 (Air, 1.5 atm) ........................................... 49 D7.3 Hold Overnight at 400 mA/cm2 .................................................................................. 49 D8 Day 4 Test ........................................................................................................................... 49 D8.1 Performance Measurement at 100/90/90 (O2/Air Alternating, 1.5 atm)................... 49
D8.2 Crossover and Cyclic Voltammetry Tests at 120/90/90 ............................................. 49 D8.3 Performance Measurement at 120/90/90 (Air/O2 Alternating, 1.5 atm) .................. 49 D8.4 Hold Overnight at 400 mA/cm2 .................................................................................. 49 D9 Day 5 Test ........................................................................................................................... 49 D9.1 Crossover and Cyclic Voltammetry Tests at 100/90/90 ............................................. 49 D9.2 Performance Measurement at 100/90/90 (Air/O2 Alternating, 1.5 atm)................... 49 D9.3 Stability Test (Days 5,6, and 7).................................................................................... 50 D10 Day 8 Test…....................................................................................................................... 50 D10.1 Crossover and Cyclic Voltammetry Tests at 100/90/90 ........................................... 50 D10.2 Performance Test at 100/90/90 (Air/O2 Alternating, 1.5 atm)................................. 50 D10.3 Cool Down................................................................................................................. 50 D11 Day 9 Test ......................................................................................................................... 51 D11.1 Crossover and Cyclic Voltammetry Tests at 25/25/25 ............................................. 51 D11.2 Leak Test ................................................................................................................... 51 D11.3 Resistance Test ......................................................................................................... 51 D11.4 Shut Down and Remove from Test Stand................................................................. 51 D11.5 Post‐Test Analysis ..................................................................................................... 51 D15 Troubleshooting: Hardware Problems ............................................................................. 51 D16 Chart Summarizing Day‐to Day Activities......................................................................... 53 Appendix E Fluoride Concentration Measurements Test Procedure ........................................... 54 E1 Checking Electrode Operation….......................................................................................... 54 E1.1 Suggested Equipment.................................................................................................. 54 E1.2 Procedure .................................................................................................................... 54 E2 Fluoride Concentration Measurements.............................................................................. 54 E2.1 Direct Calibration......................................................................................................... 54 E2.2 Calibration Curve......................................................................................................... 55 E2.3 Measuring Samples with Concentrations Greater than 1 ppm .................................. 56 E2.4 Measuring Samples with Concentrations Less than 1 ppm ........................................ 57 E3 Electrode Cleaning and Storage .......................................................................................... 58 E3.1 Electrode Cleaning I..................................................................................................... 58 E3.2 Electrode Cleaning II… ................................................................................................. 58 E3.3 Electrode Storage I ...................................................................................................... 58 E3.4 Electrode Storage II ..................................................................................................... 58 Appendix F Safety Plan ................................................................................................................. 59
F1 Scope of Work ..................................................................................................................... 60 F2 Identification of Safety Vulnerabilities................................................................................ 61 F3 Risk Mitigation Plan............................................................................................................. 62 F3.1 Organic Vapor Exposure .............................................................................................. 62 4
F3.2 Catalyst Handling......................................................................................................... 62 F3.3 Hydrogen Leaks ........................................................................................................... 62 F3.4 Standard Operating Procedures.................................................................................. 63 F3.5 Previous Experience With Hydrogen........................................................................... 64 F3.6 Safety Performance Measurement and Management of Change Reviews................ 64 F3.7 Employee Training ....................................................................................................... 64 F3.8 Equipment Integrity..................................................................................................... 65 F3.9 Maintenance of Safety Documentation ...................................................................... 65 F4 Communication Plan ........................................................................................................... 66 F4.1 Emergency Response Plan........................................................................................... 66
F4.2 Incident Reporting and Lessons Learned .................................................................... 66 F5 Sample Handling and Transport.......................................................................................... 67 F6 References........................................................................................................................... 67 Appendix G Facilities and Instrumentation .................................................................................. 68 G1 Membrane Fabrication…………………………………………........................................ 68 G2 Membrane Electrode Assembly Fabrication ................................................... 68 G3 Electrochemical Characterization.................................................................... 68 G4 Materials Characterization .............................................................................. 68
5
1.1
Introduction to the Test Protocol for PEM Cell Tests
PEM single‐cell testing for performance, durability and accelerated stress is conducted on a “Fee for Service” basis at a number of government as well as commercial laboratories. These services are available for the individual Task 1 team members with customer‐specific protocols to meet their individual testing requirements. This document defines the PEM test procedures that will be used at FSEC for conducting the screening tests that are required under FSEC’s Task 5 “Characterize performance of MEA” of the DOE program DE‐PS36‐6095020. The purpose of this testing is to assess the relative merits of the candidate membranes that are submitted by the Task 1 team members. These tests will be conducted at operating conditions that are of interest to the DOE. The goal is to show the current capability of these membranes rather than simply to provide a Go/No Go rating against the Program Requirements. A further objective of this protocol is to clearly define the operating conditions to which the individual membranes will be subjected. This allows the details to be understood by the DOE; and, with this information, each team member can set limits of processing and operation based on the capabilities of their individual membranes. To the extent that all membranes are tested to the same protocol, the results provide a fair and accurate evaluation of the performance capabilities of each configuration. It is understood that the fabrication history for the membranes, as well as the characteristics of the interfacing cell components, the cell assembly procedures, and the cell operating history can have a significant impact on the cell performance. The impact of these “histories” is normalized in this protocol by using identical procedures on all the cells. FSEC has followed this protocol on numerous cells and this test protocol produced repeatable results.
1.2 Components to be Delivered Task 1 team members deliver sample membranes developed under this DOE program. A sufficient number of pieces sized 12 cm by 12 cm (4 ¾ inches by 4 ¾ inches) will be submitted to enable the tests to be completed. These membranes, along with the fabricators’ constraints for further processing, are represented to the DOE as the Task 1 team members’ best effort of performance under this program.
1.3 Details of the Cell The test CCM is fabricated using membranes provided by the Task 1 team members. Prior to fabrication of the CCM, membrane samples will be examined for uniformity (no bubbles, debris, fogginess, stretches, cracks, and thickness variations), gas crossover, and flexibility to ensure the membranes are suitable for testing. Sample pieces will be cut from the membrane and sent to Bekktech, LLC and Scribner Associates for conductivity testing and to Material Science at the University of Central Florida for SEM/EDAX characterization. A diagram depicting how each supplied membrane will be used is shown in Figure 1.1. The CCM is fabricated by spraying a catalyst ink (ionomer, Pt/C, methanol mixture) on a membrane to achieve a nominal loading of 0.4 mg Pt/cm2 of TEC10E50E ‐‐ Pt 50 wt% catalyst supported on a high surface area carbon (SA = 800 m2/g) supplied by TKK. FSEC has achieved baseline performance by mixing the catalyst 6
with 32% 1100 EW Nafion® using methanol and then spraying using a nitrogen‐driven spray gun, which is carried by a numerically‐controlled X/Z plotter. The CCM is then dried at 100 oC, heat‐treated at 136 oC and compressively pressed 5.1 atm (75 psi) compressive pressure for five minutes, and then protonated using a 0.5 M sulfuric acid solution and washed in distilled water. A second CCM and two coupons are made at the same time, with identical processing. This second CCM and one coupon will be returned to the membrane fabricator untested for their evaluation and analysis. FSEC will communicate with the team members about the fabrication constraints for each membrane and an attempt will be made to accommodate the membrane requirements and the supplier wishes, while still achieving comparable results. Depending on the membrane composition and the supplier requirements, it may be necessary to adjust the type of ionomer, ionomer loading, drying temperature, hot press temperatures, and solvent. 4 cm
8 cm
Coupon 4 cm
CCM 8 cm
Extra
12 cm
5 cm
5 cm
Conductivity #2
Conductivity #1
4 cm
4 cm
12cm Figure 1.1. Depiction of membrane sample pieces. CCM and coupon pieces will be sprayed at the same time. Conductivity pieces will be sent to Scribner and Associates and Bekktech for testing.
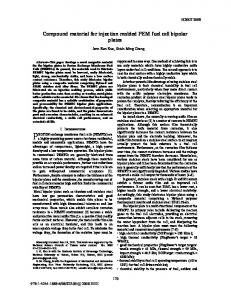
The single‐cell hardware (25 cm2) used for this program was manufactured by Fuel Cells Technologies Incorporated (FCT) www.fuelcellstechnologies.com. It consists of a pair of graphite bipolar plates with a serpentine flow pattern, gold‐coated current collector plates, and aluminum pressure plates. The design of the anode bipolar plate flow field has been rotated 90° to give a cross flow pattern and the dimensions of the serpentine flow field for both anode and cathode have been modified (width and depth) to decrease pressure drop. All other aspects of this hardware are as originally designed by FCT.
7
Figure 1.2. Bipolar plates (anode, left and cathode, right) showing single serpentine flow field.
All the MEAs for these cells use type 10BB gas‐diffusion layers purchased from SGL Carbon (Sigracet®) Each of these gas‐diffusion layers were tested for through‐plane permeability prior to use, following the procedure in Appendix A. The minimum acceptable permeability for the cathode GDL is given by a Gurley Number of 0.024 L/min/cm H2O/cm2. The anode GDL permeability is allowed to be much lower. The cell seals are made of a stack‐up of Teflon® gaskets with the thickness of the gaskets thinner than the cell assembly giving a “pinch” of 230 to 250 μm (9‐10 mils).
1.4 Membrane, CCM, and GDL Thickness Measurement The thickness of the membrane, CCM, and GDLs are measured using a Mitutoyo Gauge (Figure 1.3). Component thicknesses are defined using average of at least nine readings evaluated over the entire component at locations shown on the template in Figure 1.4. The membrane, CCM, or GDL is sandwiched between thin sheets of Teflon® of known thickness when making the measurements. The template is used to maintain the consistency of the location of successive measurements. The Teflon® sheets are measured first and then the membrane, CCM, or GDL is inserted between them and a second set of readings is taken. Subtracting the first reading from the second provides the component thickness.
8
Figure 1.3. Mitutoyo Gauge for measuring thickness of membranes, CCMs, MEAs, and GDLs
X
X
X
X
X Measure each Membrane in 9 places Take the average X
X
X
X
Figure 1.4. Template for measuring thickness of membrane, CCM, GDL, and MEA
1.5 Cell Assembly Figure 1.5 shows an expanded view of a complete PEM fuel cell hardware. The design of the hardware is for 25 cm2 cells. For this program, cells are assembled by hand using bipolar plates, load plates, and end plates purchased from FCT. Prior to assembly, GDLs are tested for permeability, and cut to the required size. Teflon® sheets are also die cut to size, and the membrane is spray‐coated with a mixture of TKK platinum on carbon catalyst to form the CCM. CCMs have 0.4 mg/cm2 catalyst on each electrode for the screening tests; however they can be fabricated with catalyst loadings down to 0.05 mg/cm2 by the same processing equipment. After all components have been prepared, cleaned and documented, cells are assembled as defined in the “Assembly Procedure” included as Appendix B. Cell “pinch”, which establishes the compressive load on the active area of the MEA is controlled by selecting Teflon® sealing gaskets that are thinner than the sum of the component thicknesses in the active area of the cell. This pinch is a critical parameter for cell assembly and is controlled by selecting Teflon® gaskets of appropriate thickness as shown in Figure 1.6.
9
1
1. 2. 3. 4. 5. 6. 7.
2 3 4 5 6 5 4
End Plate Gold coated copper plate Bipolar Plate Teflon Gasket Gas Diffusion Layer MEA M6 Bolt
3 2 1 7
Figure 1.5. Expanded view of PEM fuel cell hardware
GDL GDL Th Thiickness
CCM CCMTh Thiickness
2.2 56
2.25 57
70 2.75
15.65 15.95 398 15.75 405 400
2.45 62
2.45 62
74 2.9
15.75 398 400 15.75 15.65 400
64 2.5
62 2.45
70 2.75
15.65 15.85 398 402 15.6 396
Cathode
15.95 398 15.65 395 15.55 Anode 405
Pi Pin nch
15.95 406 16 400 16.15 405
9.4 239
9.35 237
241 9.5
15.85 409 16.1 402
245 9.65
10 254
254 10.4
404 15.9
All numbers are in μm.
The gaskets were each 310 μm Measure each component in 9 places Build cell with 229‐254 μmpinch Pinch = TGDL(Anode) + TGDL(Cathode) + TCCM – TGaskets
246 9.7
9.8 249
254 10
Figure 1.6. Schematic showing sample calculation of pinch by measuring thicknesses of each component using the template.
1.6 PreTest Integrity Test After the cell is built and before it is delivered to the test stand, it is externally leak‐tested, internally leak‐tested, and electrically isolation‐tested, each according to the procedures in Appendices C and D. These tests are to ensure that the cell integrity is sufficient to warrant the test effort and to establish a pre‐test baseline database. After the cell is mounted in the test stand, the external leak‐test of the cell and the stand, and the resistance tests of the cell and
10
the stand are repeated to validate test readiness. Allowable limits for these tests have been established by a combination of FSEC’s cumulative test experience and an “impact analysis” of the worst‐case level of leakage and cell resistance on cell performance. These levels were also verified by the current FSEC database.
1.7 Tests Performed on Each Cell 1.7.1 Linear Sweep Voltammetry, Cyclic Voltammetry (CV), and Cell Conditioning Prior to performance evaluation, electrochemical active area (ECA) and H2 crossover (CO) tests are performed on the cell at ambient pressure at room temperature and 100% RH, 80 oC and ~100%RH, 100 oC and 69%RH, and 120 oC and 35% RH. The cathode is the working electrode and the anode, using hydrogen, is the counter as well as the reference electrode. Flows of 0.4 L/min of hydrogen and nitrogen are introduced to the anode and cathode side of the cell, respectively. The CV is conducted at a scan rate of 30 mV/s between zero and 0.8 V to determine the ECA. Hydrogen crossover is measured by the limiting current density method with H2 flowing on the anode and nitrogen on the cathode. The cell potential is scanned potentiodynamically at 4 mV/s from zero to 0.8 V. A PAR 263A potentiostat and CorrWare software is used to control the potential. The crossover test shows both the level of gas diffusion through the membrane and any electrical short. The level of diffusion is given by the flat portion of the curve and the level of short is calculated from the sloping linear relationship between the applied voltage and the measured current, specifically the measured current between 0.3 V and 0.8 V. Shorts must be less than the equivalent of 10 mA to be allowable, and to clarify the CV data, the linear slopes resulting from these electrical shorts are removed from the data. Figure 1.7 shows sample CO data and Figure 1.8 shows sample ECA data as a function of cell temperature. In the CV data, the hydrogen desorption peaks can easily be observed at room temperature. CV and CO tests were repeated before each test condition to provide data in support of the cell analysis. 0.015
Crossover 0.010
Indicative of a short
i / mA cm
-2
0.005
0.000 0.0 -0.005
0.2
0.4
0.6
0.8
1.0
25/25/25 0.28 mA/cm2 (pretest) 80/80/73 0.76 mA/cm2 100/90/90 0.73 mA/cm2
-0.010
120/90/90 1.98 mA/cm2 25/25/25 196 Ohm cm2 (post-test)
-0.015
E/V
Figure 1.7. CO data at different cell temperatures. Linear sweep voltammogram of FSEC‐1; scan rate = 2 mV/s, 0.4 L/min (H2/N2), Tcell = 25, 80, 100, 120 oC, working electrode = cathode, counter/reference = anode.
11
0.01
ECA
i / mA cm-2
0.005 0 0 -0.005 -0.01
0.2
0.4
0.6
0.8
1
25/25/25 39.3 m2/g 80/80/73 35.6 m2/g 100/90/90 22.3 m2/g
-0.015 -0.02
E/V
Figure 1.8. ECA data as a function of cell temperature. Cyclic Voltammogram of FSEC1; scan rate = 30 mV/s, 0.4 L/min (H2/N2), Tcell = 25, 80, 100 oC, working electrode = cathode, counter/reference = anode.
Analysis of the cyclic voltammogram provides a measure of the electrochemical surface area (ECA) of the cathode. Periodically repeating this test during the program provides a history of the changes in cathode ECA for sample MEAs as a function of a fixed test history. Analysis of these test results shows comparative merits of the submitted membranes. It is recognized that the initial testing of CO/CV prior to conditioning the CCM does not represent the full potential of the cell, but these tests provide important data about the initial condition of the cell. In addition, this data is required as input for the analysis of the cell during operation. After the CO/CV test, the cell is heated to 80 oC and the saturators are heated to 80 oC for the anode and 73 oC for the cathode, and the cell is conditioned for operation by adding water to the electrolyte. This is a two‐step procedure, where water is first added as a vapor from saturated gases (hydrogen on the anode and nitrogen on the cathode), and second by operation of the cell at a fixed voltage of 0.55 V and run on hydrogen/air. Each step is for three hours, which, for Nafion®, has proven to be sufficient to “wet‐up” the electrolyte. After the electrolyte has been “wet‐up”, a series of performance curves are run at ambient pressure and high stoichiometry. These tests are run at near 100% RH with the cell at 80 oC. The air dew point is a few degrees lower than the cell temperature to avoid flooding the cathode. Performance sweeps are taken on H2/Air, H2/O2, and H2/Air out to ILim. or IMax. The limiting current, ILim, is the current when the cell voltage becomes 0.3 V. This value is used rather that 0V to avoid damage to the cell. The maximum current, IMax, is based on the test stand reactant 12
flow capability at 2000 mA/cm2. The repeat of the H2/Air sweeps allows performance between the two tests to be compared to show that the cell has reached a stable starting performance point, and to indicate that the differences between the air and the oxygen performance is being measured accurately. Test points are held for five minutes during this testing as a compromise between fully stable data and a reasonable amount of total test time. The cell is then held at these same conditions (80 oC, 80 oC, 73 oC) while the initial test data is reviewed and the cell integrity is judged to be sufficient to proceed with the remainder of the testing. If the cell performance is not adequate, it is cooled to room temperature, the CO/CV is repeated and further data analysis is conducted to determine the next steps. 1.7.2 Performance Verification Test The purpose of the Performance Verification Test is to provide data on cells operating at a series of conditions that are at the DOE goals or that represent significant progress toward those goals and show the relative merits of each of the candidate membranes at those conditions. Having conditioned the cell and verified its integrity, the Performance Verification Test is started without shutting down. The cell is pressurized to 1.5 atmospheres while holding the cell temperature and the anode and cathode saturator temperatures at 80 oC, 80 oC, 73 oC respectively; and a series of H2/Air, H2/O2, H2/Air performance sweeps are taken at high stoichiometry (above 3 to minimize the effects of reactant utilization). Following these tests, the cell and saturators are heated to 100 oC, 90 oC, 90 oC, which changes the inlet RH at the cell to 69%. The three performance sweeps are taken and the temperatures are increased again to 120 oC, 90 oC, 90 oC to further reduce the relative humidity to 35%. In all cases, the cell is returned to 100 oC, 90 oC, 90 oC and held at 400 mA/cm2 overnight to evaluate the stability between the different sets of lower relative humidity tests. Cell temperatures are held at 100 oC, 90 oC, 90 oC in preparation for the stability test. 1.7.2.1 Polarization Curve Figure 1.9 shows typical performance data, which shows three characteristic regions. The first (low current density region) is dominated by activation overpotential losses, the second (mid current density) is dominated by resistance losses, and the third (high current density region) is dominated by mass transport losses. Analysis of these curves, and the changes to the various regions of the curves, as the testing progresses, provides key insights into the performance and stability of the membrane as well as the catalyst layer and the catalyst‐membrane interface. Fuel Utilization and air Utilization have significant impacts on the shape of these curves. Although utilizations used are higher than the goal values, this data is valuable in comparing performance with lower fuel and air flows. The highest obtainable current density is ILim, which is an important input to the analysis of the internal resistance of the cathode.
13
FSEC1 CCM @ 120o C _1.5atm Catalyst: TKK 45.5 Pt% 0.4mgPt/cm 2
1.0 y = -0.0353Ln(x) + 1.0085 2 R = 0.9985
0.9 0.8 Cell Voltage (V)
0.7 Air Vcell
0.6
Air_iR_Free
0.5
O2_iR_Free
0.4
Air_Cathod Resistance Corrected O2_Cathode Resistance Corrected
0.3
Air_Ilim Correct
0.2
O2_Ilim Correct
0.1 0.0 1
10
100
1000
10000
2
Current Density(mA/cm )
Figure 1.9. Typical performance for a load calibration sweep
1.7.2.2 Stability Test A 64‐hour endurance test is run on the 25‐cm2 fuel cell under H2/Air. The operating conditions are 400 mA/cm2, 100 oC, 1.5 atm, and 69% RH for both the H2 and air reactants. The cell is maintained at a constant current while cell performance and resistance are measured. Initial and final electrochemical active area, fuel crossover, and performance are determined at cell operating temperature. Water from the exit streams is condensed, collected, and analyzed for fluoride ion concentration. Typical cell voltage and cell resistance stability curves are shown in Figure 1.10. The voltage and resistance are both expected to be stable throughout the stability test. Any change in performance or resistance is a result of MEA degradation due to chemical and mechanical stress.
14
250
100/90/90 -1 400 mA cm
100
mOhm cm
150
2
200
Resistance /
Voltage / V Voltage / V
0.9 0.8
0.7 0.6 0.5 0.4 0.3 0.2
0.1
0.0
50
Voltage Resistance
0 0
20
40
60
80
Time / h Figure 1.10. Typical performance and cell resistance stability curve. Voltage and resistance of FSEC‐3, 0.2 L/min (H2/Air), Tcell = 90 oC, %RH = 30, i = 400 mA/cm2.
1.7.3 Post-Test Integrity Test After the cell is tested, and before it is removed from the test stand, the external leak‐test of the cell and the stand, and the resistance tests of the cell and the stand are repeated to quantify the end‐of‐test condition. In addition, before the cell is disassembled, it is externally leak‐tested, internally leak‐tested, and electrical isolation tested on the bench, each according to the procedures in Appendices C and D. Bolt torque is also measured. These tests are to determine the changes in the cell integrity as a result of the protocol testing. These tests provide data on some of the changes to the membrane as well as data external to the MEA that is needed to support the cell analysis. 1.7.4 Post-test Analysis FSEC has developed and verified a process to evaluate sources of polarization, mainly associated with the cathode, in hydrogen/air proton exchange membrane fuel cells and is currently using this process to analyze cell performance and guide development efforts. This process quantifies the six sources of polarization using data from the standardized test program. Non‐electrode ohmic overpotential, electrode ohmic overpotential, non‐electrode concentration overpotential, electrode concentration overpotential, activation overpotential from the Tafel slope, and activation overpotential from catalyst activity are analytically separated into their distinct elements. The analysis is based on hydrogen/air polarization curves of an in‐house membrane electrode assembly (MEA) using hydrogen/oxygen polarization curves as a diagnostic tool. The analysis results compare three cell temperature/relative humidity /oxygen partial pressure (pO2, atm) conditions: 80°C/100% RHanode/75% RHcathode, 100°C/69% RH, and 120°C/35% RH, which represent near fully‐humidified, moderately humidified, and low humidified conditions, respectively, at 1.5 atm operating pressure. The technique is useful for
15
diagnosing the main sources of loss in MEA development work, especially for high temperature/low relative humidity operation where several sources of loss are present simultaneously. The following verification test data and analysis is reported. 1.7.5 Cell Data Report The experimental testing of a new membrane will result in the following data to enable the evaluation of membrane performance in a cell: • Cell build verification test data o Electronic resistance for short determination o External leakage rate o Internal leakage rate • Cell characterization at start‐up o Cyclic voltammetry at 25 oC to enable electrochemical area determination o Linear sweep voltammetry at 25 oC for crossover and electronic resistance determination • Performance test data o Cell voltage and cell resistance (OCV to 0.3V) at the following conditions: H2/O2 and H2/Air reactants at 1.5 atm, 80 oC/80 oC/73 oC (100% RH) H2/O2 and H2/Air reactants at 1.5 atm, 100 oC/90 oC/90 oC (69% RH) H2/O2 and H2/Air reactants at 1.5 atm, 120 oC/90 oC/90 oC (35% RH) o A tabulation of cell current density and resistance using H2/Air reactants at 0.7 V for the above three conditions (This tabulation is provided to enable rapid membrane comparisons.) • Stability test data o Cell voltage and resistance for 100 hours at the following conditions: H2/Air reactants at 400 mA/cm2, 150 kPa, 100 oC, 69% RH o Cyclic voltammetry to enable post‐test electrochemical area determination o Linear sweep voltammetry for post‐test crossover and electronic resistance determination o Fluoride present in exhaust condensate
1.8 Fuel Cell Hydrogen Safety Plan Florida Solar Energy Center (FSEC) complies with the University of Central Florida (UCF) Chemical Hygiene Plan (CHP), as required by OSHA. This plan and its associated documentation (“Safety Standards for Hydrogen and Hydrogen Systems ‐ SSHHS”) provides a written description of safety policies and procedures that all university laboratory personnel must follow. All faculty researchers, student trainees and visiting scientists and engineers working at FSEC's hydrogen research laboratories are provided with training and a copy of SSHHS document. SSHHS document contains guidelines for hydrogen system design, material selection, operation, storage, handling and transportation. Furthermore, FSEC's hydrogen laboratories and field facility meet and/or exceed the design and safety requirements imposed by the Florida State Fire Marshall and all the state and federal codes (NFPA 45 Standard on Fire Protection for Laboratories Using Chemicals, NFPA 50A Standard for Gaseous Hydrogen 16
Systems at Consumer Sites, and NFPA 70 National Electric Code) for handling large volumes of hazardous and flammable gases and chemicals including both gaseous and liquid hydrogen. In addition, FSEC’s hydrogen field facility has been upgraded with explosion proof electrical systems and meets NFPA 50B Code “Liquefied Hydrogen Systems at Consumer Sites.” Before each new research activity is initiated, the personnel safety at and near the facility is reviewed and emergency procedures implemented at the earliest planning and design stages. Advance planning for a variety of emergencies such as fires and explosions are conducted and proper procedures developed and implemented. All hydrogen systems will be instrumented and checked for: i. Process monitoring and control. ii. Collection of performance data. iii. Providing warnings and/or alarms for out‐of‐limits conditions. iv. Early detection of hazardous condition(s). v. Compatibility with hydrogen service. vi. Establishment of local and/or remote operation and monitoring of the hydrogen system. vii. Having appropriate range, accuracy, and response time. The Safety Assessment Review shall be updated anytime a system or process is changed. An annual facility inspection shall be conducted and documented. A formal Operating and Support Hazard Analysis shall be performed as directed by the UCF Environmental Health and Safety Office. Significant hazards identified shall be eliminated or reduced to acceptable risk levels. Mr. Randy Fowler is the FSEC's Hydrogen R&D Laboratories' operational and safety manager. He has attended and completed the following safety related courses and training activities: i. A full day course on HazMat and received his certification on spill control and respirators. ii. Has successfully completed “NASA Hydrogen Safety” class. iii. Attended the “Lab Safety Basics and Beyond” at PITTCON. iv. Taken and passed UCF's “Chemical Safety and Environmental Management for Laboratories” class. v. Has post‐secondary vocational certificate given by the Brevard Community College on “Chemical Laboratory Specialist,” December of 2002. Mr. Fowler oversees the enforcement of all hydrogen and chemical safety procedures and training of the graduate research students working in FSEC's hydrogen laboratories. In addition, a comprehensive safety plan will be developed and submitted to DOE at the time of contract award. In preparation for this plan, the following steps will also be taken: • The Chemical Hygiene Plan (CHP) will be re‐evaluated, modified as needed and periodically checked for compliance. • A standard operating procedure (SOP) will be established for all experiments and operations taking into account hazard level of materials to be used. 17
• Procedures will be developed for reporting any events or deviations from SOP. • Failure risk mitigation plan will be developed based on vulnerabilities identified by Modes and Effects Analysis.
18
2. Day by Day PEM MEA Test Sequence
2.1 Assemble the Cell • The Sample MEA - From team members two pieces – 12 cm x 12 cm (4.75” x 4.75”) • Anode and Cathode Catalyst - TKK 46% Pt catalyst - 0.4 mg/cm2 - 32 wt% Nafion® 1100 binder - Spray - 136oC heat treat - Protonation - Two identical: One tested/One returned untested • GDL - SGL 10BB • Pinch 0.25 mm +/‐ 0.02 mm (0.01” +/‐ 0.001”) • Teflon® Gasket Lay‐up • FCT Cell - Hardware – Single pass serpentine - Cross flow cathode horizontal - FSEC bar and groove dimensions • Bolt Load - Star pattern - 4.5 N m torque (40 inch pounds) • Pretest Conductivity ‐ Tested at BekkTech
2.2 Day 1 • Measure mechanical crossover - 100 Ohms - Anode to Cathode > 30 Ohms • Mount in test stand - Resistance Anode/Cathode to ground > 100 Ohms acceptable • Room temperature CO and CV • Wet‐Up - 80/80/73 H2/N2 3h – No Load H2/Air ~ 3h – 0.55V 19
• Cool‐down to room temperature - Hold on N2/N2
2.3 Day 2
• Room temperature CO and CV • Heat up - H2/N2 - 80/80/73 oC - Ambient pressure • Measure - Open circuit voltage (OCV), - Performance (volts vs. current) curve (VI) - Cell resistance (by current interrupt) • Stoichiometry ‐ Anode 3, Cathode 3.6 • H2/Air • H2/O2 • H2/Air • CO and CV at 80/80/73 oC • Hold overnight at 400 mA/cm2
2.4 Day 3 • Pressurize to 1.5 atm • Measure at 80/80/73 oC - OCV, VI curve, cell resistance • Stoichiometry ‐ Anode 3, Cathode 3.6 • H2/Air • H2/O2 • H2/Air • Heat to 100/90/90 oC • CO and CV at 100/90/90 oC • Measure - OCV, VI curve, cell resistance • Stoichiometry ‐ Anode 3, Cathode 3.6 • H2/Air • Hold overnight at 400 mA/cm2
2.5 Day 4 (at 1.5 atm) • Run VI curve at 100/90/90 oC - Stoichiometry • Anode 3, Cathode 3.6
- H2/Air
20
- H 2/ O2
- H2/Air
• Heat to 120/90/90 oC • Record CO and CV at 120/90/90 oC • Measure - OCV, VI curve, cell resistance • Stoichiometry ‐ Anode 3, Cathode 3.6 • H2/Air • H2/O2 • H2/Air • Cool to 100/90/90 oC • Hold overnight at 400 mA/cm2
2.6 Day 5, 6, 7 (at 1.5 atm) – Stability Test • Record CO and CV at 100/90/90 oC • Measure - OCV, VI curve, cell resistance • Stoichiometry ‐ Anode 3, Cathode 3.6 • H2/Air • H2/O2 • H2/Air • Start stability test - 1.5 atm - 100/90/90 oC - H2/Air - 400 mA/cm2 • Stoichiometry - Anode 3, Cathode 3.6 • Measure during stability test ‐ Cell voltage ‐ Fluoride emission rate (FER) in reactant exhausts
2.7 Day 8 (at 1.5 atm)
• Record CO and CV at 100/90/90 oC • Measure - OCV, VI curve, cell resistance • Stoichiometry ‐ Anode 3, Cathode 3.6 • H2/Air • H2/O2 • H2/Air 21
• Cool down to room temperature • H2/N2
2.8 Day 9
• Room temperature CO and CV • Resistance test - Anode to ground - Cathode to ground • Remove the cell • Measure mechanical crossover -