Azman Yasin et al. / (IJCSE) International Journal on Computer Science and Engineering Vol. 02, No. 09, 2010, 3065-3070
Product Assembly Sequence Optimization Based on Genetic Algorithm Azman Yasin1, Nurnasran Puteh2
Ruslizam Daud3
College of Arts and Sciences University Utara Malaysia Sintok, Kedah, Malaysia 1
[email protected],
[email protected]
School of Mechatronic Engineering University Malaysia Perlis Arau, Perlis, Malaysia 3
[email protected]
Mazni Omar4, Sharifah Lailee Syed-Abdullah5 Faculty of Computer Sciences and Mathematics Universiti Teknologi MARA, 02600, Arau, Perlis. Malaysia 4
[email protected],
[email protected] Abstract— Genetic algorithm (GA) is a search technique used in computing to find approximate solution to optimization and search problem based on the theory of natural selection. This study investigates the application of GA in optimizing product assembly sequences. The objective is to minimize the time taken for the parts to be assembled into a unit product. A single objective GA is used to obtain the optimal assembly sequence, exhibiting the minimum time taken. The assembly experiment is done using a case study product and results were compared with manual assembly sequences using the ‘Design for Assembly’ (DFA) method. The results indicate that GA can be used to obtain a near optimal solution for minimizing the process time in sequence assembly. This shows that GA can be applied as a tool for assembly sequence planning that can be implemented at the design process to obtain faster result than the traditional methods. Keywords- Genetic Algorithm; Product Sequence Assembly; Design for Assembly; Artificial Intelligence
I.
INTRODUCTION
Assembly process is one of the most time-consuming and expensive manufacturing activities. Naesung Lyu and K. Saitou [1] highlighted that with increasing on front loading in product development process, the integration of structural optimization with manufacturing design and assembly becomes a key issue for enhancing its use in concept generation and will continue to be an active research area. According to Rampersad [2], assembly plants that have not been optimized with respect to physical constraints may result in difficulties when assembling the products. Reports showed that cost of assembly as well as disassembly of manufactured products often contribute about 10% to 30% (sometimes higher) of the total manufacturing costs [3]. Thus, to reduce such costs, research works have been done to optimize the assembly sequences. Optimizations of assembly sequences are vital as it has important significance on productivity, product quality and manufacturing lead time [4]. This paper discusses the application and evaluation of Genetic Algorithm (GA) approach in optimizing the sequences of product components assembly. The objective of this work is to minimize the time taken for the parts to be assembled into a ISSN : 0975-3397
unit product using the GA technique. The structure of the paper is as follows. Section 2 describes the literature review of related works. Section 3 and 4 presents the research methodology and experiments results recpectively while Section 5 focuses on the conclusion and future enhancements. II.
LITERATURE REVIEW
There are numerous works that have been done on assembly design and planning. Among them, Boothroyd and Dewhurst [5] are widely regarded as major contributors in the formalization of Design for Assembly (DFA) concept. The aim of DFA is to simplify the product so that the cost of assembly is reduced [6]. Numerous works showed that there are few standard DFA guidelines that can be used by engineers in achieving their aim [6][7[8][9]. Overall, DFA analyzes product designs to improve assembly ease and reduce assembly time through reduction in part counts [9]. It is likely that DFA can search the easiest way to assemble parts as a unit of product through a various assembly sequences and is good in providing technical information for product assembly improvement. However, it still has few limitations such as it requires highly technical personnel to operate and it is also time consuming. On the other hand, algorithms based on artificial intelligence can also be applied in solving assembly sequence planning problem. Genetic algorithm (GA) [10] is an efficient method in searching for optimal solutions. The advantage of GA search is that it produces pseudo-optima in discrete, discontinuous, multi-modal search spaces which would be troublesome to mathematical programming techniques which use gradient or other sensitivity information [11]. It is more robust because of the multi-directional search in the solution space and encourages information exchange between directions. GA searches for an optimal assembly plan using a directed stochastic search of the product’s solution space of possible assembly plan [12]. These dramatically reduce time required to find an optimal assembly plan for a product. Furthermore, previous research such as in PCB assembly [13], had shown that GA can be applied as a search tool just like in the case of DFA. 3065
Azman Yasin et al. / (IJCSE) International Journal on Computer Science and Engineering Vol. 02, No. 09, 2010, 3065-3070 GA also has been compared with another related search method known as the Tabu search in the PCB problem domain. However, the number of moves performed by Tabu search is higher compared to GA and due to the nature of its algorithm, the time taken to find the minimum solution for Tabu search is longer, as in the finding in [14]. Other methods include tree search or graph search methods, neural network-based approaches and simulated annealing. According to D.S. Hong and H.S. Cho [15], although the developed methods can find optimal solutions in the assembly sequences, they are limited to only a small number of part components. III.
colour was differentiated by a, b, and c as shown in Table I. After the table was filled with the suitable part names and descriptions, the gene column was filled with the number starting from one. Each number must only appear once to facilitate the representation of GA chromosome in later part of the experiment. From the table, it can be seen that the parts were divided into five modules, which are Base Assembly module, Lower Handle Assembly module, Cable Assembly module, Cable Plate Assembly and Upper Handle Assembly module
METHODOLOGY
TABLE I.
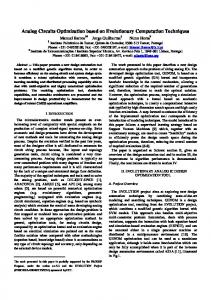
The research framework used in this study is a combination of the manual DFA method [5] and GA method [13], as illustrated in Figure 1. Experiments involving both methods were conducted and their results were compared. The experiments started by generating the assembly sequences using DFA method. These sequences were then applied to GA method as the input to the system, to see its accuracy in producing the optimum solution for product manual assembly. The chosen product is the Philips Diva Iron because of its ease of assembly and disassembly.
Gene
A. Product assembly sequence generation using DFA DFA is used in order to find the optimum manual assembly sequence. Below are the steps of generating sequences using DFA:
Step 1: Disassemble the product to study the working and function to be satisfied by the product. There are a total of 18 parts involved in forming a complete Philip Diva iron. Each different part is uniquely numbered for ease of naming and producing assembly sequences. Step 2: Develop the BOM (bill of material) to group the parts of the product in modules. Some parts are combination of more than one part. For example, part number 13 (wire) has three colour – blue, green and brown. When numbering this part, the number of each
ISSN : 0975-3397
IRON BOM
Part Name
Description
no.
Figure 1. Framework for product assembly optimization
Part
1 2
1 2a
3
2b
4
3
5
4
6
5a
7
5b
8 9 10
6 7 8
11
9
12
10a
13
10b
14, 15 16 17 18 19 20 21
11 12 13a 13b 13c 14 15a
22
15b
23 24, 25 26
16 17 18a
27
18b
Soleplate Rubber hinge right Rubber hinge left Soleplate cover Soleplate screw 1 Soleplate screw 2 right Soleplate screw 2 left Heat tuner Lower handle Temperature dial Power indicator Temperature diode right Temperature diode left Cable tube Cable Wire 1 Wire 2 Wire 3 Cable plate Cable screw right Cable screw left Handle screw Upper handle Outer screw left Outer screw right
-rubber black in colour
MODULE A BASE ASSEMBLY
-short , in front -long -at the back
-blue, round - orange
-blue -brown -green
MODULE BLOWER HANDLE ASSEMBLY
MODULE C – CABLE ASSEMBLY MODULE D– CABLE PLATE ASSEMBLY
-front MODULE E – UPPER HANDLE ASSEMBLY
Step 3: Record the assembly connection in the product by mapping the flows and connections between components in the product.
Step 4: Search all possible sequences to assemble the product. A total of 20 possible sequences were discovered.
3066
Azman Yasin et al. / (IJCSE) International Journal on Computer Science and Engineering Vol. 02, No. 09, 2010, 3065-3070 Step 5: Analyze each of the possible 20 sequences using DFA (manual handling and manual insertion table) and insert it into a work sheet. Table II shows one of the 20 worksheets towards calculating shortest time taken and less part involved. All of this procedure steps are involved for all of the 20 sequences.
5
30
6.35
29
2
10
1.5
11
1
11
1.8
1
20
Temperature dial Power indicator Cable & upper handle Cable & cable tube Wire
1
Temperature diode Lower handle
Total operating time RP*(TH+TI) - TA
1.8
88
Insertion time per item(s) TI
11
1
2.0
7.6
0
11.5
17.85
1
5.0
13.0
0
11
5.0
6.8
0
1.8
01
2.5
4.3
0
83
5.6
06
5.5
11.1
1
1
83
5.6
06
5.5
11.1
0
1
10
1.5
30
2.0
3.5
1
1
83
5.6
44
8.5
14.1
0
3
30
1.95
30
2.0
11.85
3
2
30
1.95
30
2.0
7.9
2
1
83
5.6
23
7.5
13.1
0
2,3
Rubber hinge
2
4
Soleplate cover Soleplate screw 2 Soleplate screw 1 Heat tuner
1
11 16, 24 14 17, 18, 19 12, 13 9
1 0
1.5
10
10
9
-
1
8
8
-
Soleplate
5
7
1.5
Part Name
1
6,7
6
Manual Insertion Code - IC
4
Handling time per item(s) TH
3
Manual Handling Code - HC
Sequence-S1
1
20
Cable plate
1
00
1.13
00
1.5
2.63
0
21, 22 23
Cable screw
2
83
5.6
06
5.5
22.2
0
Handle screw
1
11
1.8
00
1.5
3.3
0
15
Cable tube
1
10
1.5
30
2.0
3.5
0
25
Upper handle
1
83
5.6
42
6.5
12.1
1
26, 27
Outer screw
2
11
1.8
00
1.5
6.6
0
The first column of the table is the assembly sequence for one complete product based on the part number from Table I. All these sequences will also be the input for GA operation. The time for manual handling and insertion, TA, that is inserted into the worksheet is based on manual handling time, TH, and insertion time, TI.
ISSN : 0975-3397
B. Product assembly sequence generation using Single Objective Genetic Algorithm GA operation is applied to test how far GA can be used to get the optimum result by using all 20 sequences produced from DFA as input. Below are the steps in the GA process:
Step 1 - Chromosome Representation: Each gene represents a part in the chromosome. One chromosome equals to one complete product sequence.
Step 2 - Initialization: This is used to generate a feasible chromosome for the assembly sequence. Each of the 20 sequences produced from DFA manually will act as input for the GA process.
Step 3 - Fitness Calculation: The fitness of each chromosome, fi (i=1 to 20) is calculated, which is the time taken in each of the assembly sequence:
WORKSHEET ANALYSIS FOR SEQUENCE ONE
Figure for min. parts - NM
TABLE II.
No. of item - RP
f i TAi
(1)
Then, the total fitness, F, of the population is calculated:
F
f
(2)
i
Step 4 - Chromosome Selection: Roulette Wheel approach is used to obtain the probability of a chromosome, rFi (i = 1 to 20), to undergo genetic operations e.g. crossover and mutation:
rFi
fi F
(3)
Next, the cumulative probability chromosome, cFi , is calculated:
cFi rFi cFi rFi cFi 1
for
(i 1) (i 2 to 20)
each
(4)
Finally, a random number, r, in the range 0 to 1, is generated. A chromosome Ci is selected based on the value of r as below: If
cFi 1 r cFi
C i is selected
(5)
Step 5 - Crossover operation: A random number in the range (0, gene number – 1) as crossover point, cr, is generated. Two chromosomes at the crossover point are then crossed (the front part of both chromosomes will be swapped). During the crossover operation, each gene will be checked to ensure there is no repetition of same part number in one chromosome. The fitness of each child chromosome was calculated. Both chromosomes will replaced the worst chromosomes in the population where their fitness were lower than the fitness of these children.
Step 6 - Mutation operation: A random number, r, in the range (0,…,1) is generated. If r less than the mutation rate, mr, the mutation process will be carried out:
3067
Azman Yasin et al. / (IJCSE) International Journal on Computer Science and Engineering Vol. 02, No. 09, 2010, 3065-3070 (6)
A new child chromosome will be created by reallocating the appropriate gene position of the selected parent and assign a new value to it.
Step 7 – Stopping Condition: When the total fitness of the chromosomes is consistent (converged), it means that the optimum solution has emerged. The GA process were terminated to get the optimum sequence.
If r < mr, do mutation
EVALUATION RESULTS
IV.
Two main results will be highlighted and discussed from the conducted experiments. These are the results produced from DFA and GA experiments in getting the optimised sequences. Both are compared to see if the objectives of this study are achieved.
A.
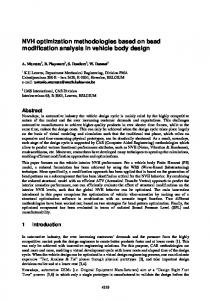
Result for product assembly sequence generation using DFA The time taken for manual assembly using DFA for the 20 sequences is shown in Figure 2. Based on the figure, sequences that are numbered 6, 12, 13, 14, 17, 18 and 20 took the smallest
Efficiency percentage
1,3,2,4,6,7,5,8,16,24,14,19,17,18,13,12,9,10,11,20,21 ,22,23,15,25,27,26 1,2,3,4,6,7,5,8,16,24,14,18,17,19,12,13,9,10,11,20,22 ,21,23,15,25,27,26 1,2,3,4,6,7,5,8,16,24,14,18,17,19,12,13,9,10,11,20,21 ,22,23,15,25,26,27 1,3,2,4,7,6,5,8,16,24,14,17,18,19,13,12,9,11,10,20,22 ,21,23,15,25,27,26
18.50% 18.00% 17.50% 17.00% 16.50%
Series1
16.00% 15.50% 1
3
5
7
9
11
13
15
17
19
sequences
Figure 3. Percentage of design efficiency for each sequence
TIME 185
seconds
180 175 170 165 Series1
160 155 1
3
5
7
9
11
13
15
17
19
sequences
amount of time with minimum time of 165.93 seconds.
B. Result for product assembly sequence generation using Single Objective Genetic Algorithm A number of trials were done first to determine the suitable crossover and mutation rate. From the result obtained, a crossover rate of 90% and mutation rate of 2% are chosen. In this experiment, it can be seen that by applying GA for a product with n components, the population undergone most significant variation in an early searching stage. It will end after approximately the 60th generations when it reaches a stable state. Figure 4 shows the fitness value for each generation.
Figure 2. Time (in seconds) taken by each sequence
The sequences that produced the highest percentage of design efficiency and the lowest time are selected as the most optimum solution for evaluation. Below are the best sequences (based on part number):
1,2,3,4,6,7,5,8,16,24,14,17,18,19,12,13,9,10,11,20,21 ,22,23,15,25,26,27 1, 3, 2, 4, 6, 7, 5, 8, 16, 24, 14, 17, 18, 19, 13, 12, 9, 10, 11, 20, 21, 22, 23, 15, 25, 27, 26 1,3,2,4,7,6,5,8,16,24,14,17,18,19,13,12,9,10,11,20,21 ,22,23,15,25,27,26
ISSN : 0975-3397
Fitness Value 18.5 18
fitness
The time gained from each sequences in Figure 2 are used as input to calculate the design efficiency for a product. Result in Figure 3 showed the percentage of design efficiency for each sequence. The higher the percentage, the higher the redesign opportunity and less time will be taken to assemble a product. From the graph, sequences numbered as 6, 12, 13, 14, 17, 18 and 20 have the highest design efficiency percentage that is 18.08 percent.
17.5 17 16.5
Series1
16 15.5 1
81
161
241 321
401 481
561 641
721 801
881 961
solution
Figure 4. Fitness value for each generation
This figure shows a fluctuation at an early stage in fitness value of each chromosome but it starts to stable after few generations. The highest value of fitness where it is stable is considered to be the solution. In this case, it can be seen that the best fitness value is at 18.07991%. Below are the best sequences:
3068
Azman Yasin et al. / (IJCSE) International Journal on Computer Science and Engineering Vol. 02, No. 09, 2010, 3065-3070
1, 3, 2, 4, 6, 7, 5, 8, 16, 24, 14, 19, 17, 18, 13, 12, 9, 10, 11, 20, 21, 22, 23, 15, 25, 27, 26 1, 2, 3, 4, 5, 6, 19, 18, 17, 14, 24, 16, 8, 7, 12, 13, 10, 11, 9, 20, 21, 22, 23, 15, 25, 26, 27 1, 25, 26, 20, 9, 11, 10, 7, 12, 13, 4, 5, 6, 19, 18, 17, 14, 24, 16, 8, 3, 2, 22, 23, 15, 21, 27
The best chromosome (among all chromosomes) is:
1, 3, 2, 4, 6, 7, 5, 8, 16, 24, 14, 19, 17, 18, 13, 12, 9, 10, 11, 20, 21, 22, 23, 15, 25, 27, 26
The best among all chromosomes solution produced from GA was then tested in DFA worksheet to see its accuracy in producing best result as manual assembly in DFA. The result shows that the time to assemble an iron using the sequence produced from GA is 165.93 seconds and the manual design efficiency is 18.08 percent. When results from DFA and GA are compared, it shows that by using GA the result is similar to the result produced using DFA. As witnessed in this study, the strength of GA in searching an optimum solution is proven. Result shows a near optimal solution is produced but the early convergence is actually a disadvantage. Once it started producing a converging population, the genetic operators became inefficient. Further iterations to generate new population could not improve the search. The convergence at an early generation is due to the small population size and the genetic operation has a tendency to preserve the genetic traits of a converging population. This explains why the curve depicted in Figure 4 converged quickly. To improve the GA process, different selection types (other than the Roulette Wheel method) and genetic operations can be applied. Population size also takes into account in improving the searching. V.
CONCLUSION
This study gave a description of the GA technique, the steps of the technique and how it fares in relation to traditional assembly methods. The objective is to minimize the time taken for the parts to be assembled into a unit product. The GA technique has been shown and evaluated as a search tool, which can be used to find the optimum sequences to assemble the Philips Diva iron. The application of steps of this technique gives a good idea about how GA can be applied as a search tool for assembly sequence in manual assembly. The advantage of using this technique is that it can be implemented at the design process and obtain faster result than the traditional DFA method. DFA gave a wide choice of connection for the same type of flow to predict the connection between the modules. Even though the results showed that GA is able to obtain a near optimal solution for the sequence assembly, GA does not guarantee that an optimal solution can be achieved each time. This can be attributed to the small population size and the chromosome selection method used in the experiments. The use of the Roulette Wheel method in selecting chromosomes does not guarantee that a chromosome will be selected even
ISSN : 0975-3397
though it has the highest fitness. On the average, only the chromosome with the proportional fitness will be chosen. From the experiments it is found that there are still rooms for improvement before GA can be applied to replace the traditional way of design for assembly. For further work recommendation, different chromosome selection mechanism and genetic operators can be applied to make the GA engine more efficient. Population size and integration with other artificial intelligent techniques can also takes into account in improving the searching. ACKNOWLEDGMENT The researchers acknowledge the financial support (Fundamental Research Grant Scheme) received from the Ministry of Higher Education, Malaysia via University Utara Malaysia (S/O Code: 11637). REFERENCES [1]
[2] [3]
[4]
[5] [6] [7] [8] [9]
[10] [11]
[12]
[13]
[14]
Naesung Lyu and K. Saitou, "Decomposition-Based Assembly Synthesis of a Three-Dimensional Body-in-White Model for Structural Stiffness," Transaction of ASME, Journal of Mechanical Design, vol. 127, pp. 3448, 2005. H. K. Rampersad, "Integrated and Assembly Oriented Product Design," Journal of Integrated Manufacturing System, vol. 7, pp. 5-15, 1999. Kara, S., Pornprasitpol, P., and Kaebernick, H., (2005). A selective disassembly methodology for end-of-life products, Assembly Automation, 25/2, pp. 124-134. Veerakamolmal, P., Gupta and McLean, C. (1997). Disassembly process planning, First International Conference on Engineering Design and Automation. G. Boothroyd and P. Dewhurst, Product Design for Manufacturing and Assembly: Marcel and Dekker, 1994. V. Chan and F. A. Salustri, "Design for Assembly," 2003. G. Boothroyd, Assembly Automation And Product Design. New York: Marcel Dekker, 1992. K. Crow, "Design for Manufacturability/Assembly Guidelines," vol. 2005, 1998. R. B. Stone, D. A. McAdams, and V. J. Kayyalethekkel, "A product architecture-based conceptual DFA technique," vol. 25, pp. 301-325, 2004. John H. Holland. Adaptation in Natural and Artificial Systems. MIT Press, 2nd Edition. , 1992. C.D. Chapman, K. Saitou, and M. J. Jakiela, "Genetic Algoorithm as an Approach to Configuration and Topology Design," Journal of Mechanical Design, vol. 116, pp. 1005-1012, 1994. S. F. Chen and Y.-J. Liu, "The Application of Multi-Level Genetic Algorithms in Assembly Planning," Journal of Industrial Technology, vol. 17, pp. 1-9, 2001. W. Ho and P. Ji, "PCB assembly line assignment: a genetic algorithm approach," Journal of Manufacturing Technology Management, vol. 16, pp. 682-692, 2005. S. Saad, E. Khalil, C. Fowkes, I. Basarab-Horwath, and T. Perera, "Taboo search vs genetic algorithms in solving and optimising PCB problems," Journal of Manufacturing Technology Management, vol. 17, pp. 521-536, 2005. Hong, D.S and Cho, H.S. (1999). A genetic-algorithm based approach to the generation of robotic assembly sequences. Journal of Control Engineering Practice, 7, pp. 151 – 159.
3069
Azman Yasin et al. / (IJCSE) International Journal on Computer Science and Engineering Vol. 02, No. 09, 2010, 3065-3070 AUTHORS PROFILE Azman Yasin (Corresponding author) is a senior lecturer at the College of Arts and Sciences, Applied Science Division, Universiti Utara Malaysia, 06010 UUM Sintok, Kedah. Malaysia (e-mail:
[email protected]). His research interest includes software engineering education, information retrieval specifically scheduling and timetabling using artificial intelligence techniques. Nurnasran Puteh is a senior lecturer at the College of Arts and Sciences, Applied Science Division, Universiti Utara Malaysia, 06010 UUM Sintok, Kedah. Malaysia (e-mail:
[email protected]). His research interest includes software oriented architecture, search engine using artificial intelligence techniques.
Sharifah Lailee Syed-Abdullah is an Associate Professor at the Faculty of Computer Science and Mathematics, Universiti Teknologi MARA, 02600, Arau, Perlis. Malaysia (e-mail:
[email protected]). Her main research interests are agile methods in software engineering, empirical software engineering and pattern recognition. Mazni Omar is a lecturer at the College of Arts and Sciences, Universiti Utara Malaysia. Currently, she is pursuing her PhD at the Faculty of Computer Science and Mathematics, Universiti Teknologi MARA, 02600, Arau, Perlis. Malaysia (e-mail:
[email protected]). Her main research focuses are agile methods in software engineering, empirical software engineering and pattern recognition.
Ruslizam Daud is a lecturer at the School of Mechatronic Engineering, University Malaysia Perlis, Arau, Perlis, Malaysia (e-mail:
[email protected]). His research interest includes product assembly and CAD/CAM.
ISSN : 0975-3397
3070