Programming Speed in Ovonic Unified Memory. Sergey Kostylev (
[email protected]), Tyler Lowrey*(
[email protected]), Wally Czubatyj (
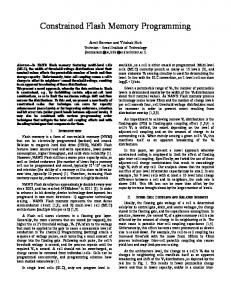
[email protected]) Ovonyx Technologies, Inc. and *Ovonyx, Inc. 2956 Waterview Drive, Rochester Hills, Michigan, USA ABSTRACT Ovonic Unified Memory (OUM) is based on materials in which the phase change (PC) occurs by the application of an electrical signal. In principle OUM devices should be able to replace all electrical memories including those with very strict limitation to the time of programming. Chalcogenide materials used in OUM devices present no fundamental limitations with respect to speed (sub nanoseconds) and to scaling (down to 50 Angstroms) and approaches have been reported to reduce programming currents to acceptable range without sacrificing the memory endurance cycle-life. The aim of this investigation is to find factors affecting programming time and involves studies of the influence of: programming current levels, phase change alloy composition and its thickness, electrode contact materials, device geometry, and temperature. Specific methods of characterizing programming speed will be described for both programming to the set (crystallization or ordering) and reset (amorphization or vitrification) states. It will be shown that programming speed to set or to reset a device is determined mainly by only one of electrical contacts: set speed is not as affected by the cathode contact but depends more strongly on the anode contact and that the reset speed could be changed dramatically with cathode contact (material and geometry) but is not as sensitive to the anode contact. Key words: phase-change, set-reset speed, crystallizing-amorphizing 1. INTRODUCTION Phase change technology, which was invented and continuously upgraded by Stan Ovshinsky, is rapidly entering the commercialization phase for non-volatile electric memory [1,2]. Efforts by many groups have accelerated this process [38]. It is conductivity and not reflectivity that is of the main importance in phase change alloy composition choice for OUM. Thus the alloy spectrum for OUM is much wider than for optical PC devices [9]. OUM PC technology is based on phase transformations in semiconductor media with bulk negative differential conductivity of S-type (S-NDC) where high-current density filaments appear and switching the material to a highly conducting state is observed [10]. It is a commonly accepted point of view that the filament in OUM device is well formed and that its dynamic resistance is close to 0. Thus any deviations from zero measured on a device’s IV (dV/dI at the programming currents range) are due to the total sum of all resistors in series between the probes, including contact resistance 1.0E+7
Resistance (Ohms)
Current (A)
1E-3
5E-4
dV/dI
1.0E+6
1.0E+5
1.0E+4
Vth
Rset m
0E+0 0.0
0.5
1.0
1.5
1.0E+3 0.0E+0
Device Voltage (V) Device I,15C cool Device I,40C cool Device I,60C,cool
Rrs,sat
Irs,sat
5.0E-4
1.0E-3
Current (A)
Device I 22C Device I,50C Device I,76C
R,15C cool R,50C
1
R. 22C R,60C,cool
R,40C cool R,76C
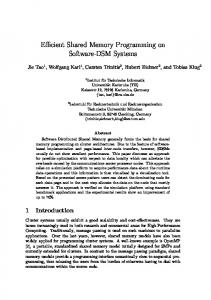
Fig.1 RIVs of typical OUM device for a break-down layer (BDL) device with 225 alloy and Carbon contacts. With known contact material resistivity and device geometry, dV/dI often coincides with calculated values of the contact resistance and its value doesn’t depend on chalcogenide (GST) thickness and temperature. Some variations that do occur can be lumped into an interface resistivity change. Fig.1 shows typical resistance-current and current-voltage characteristics (RIVs) of an OUM device at different temperatures. These devices are of the “break-down type” which we described previously [11]. We use the data presented for introductory purposes and to establish some definitions. The current value corresponding to the reset resistance (Rrs) saturation (red line) is Irs,sat, and the value of resistance at the RI curve minima (dashed line) shows the set resistance (Rset) which is a low electrical field measurement of the sum all of the resistors between the probes: Rset and the contact resistance, dV/dI. We define Rchalc,min as Rset,min - dV/dI, where dV/dI is measured from the slope of the I-V curve from about 50 to 100% of the reset current (due to possible non-linearity). In optical memory the programming energy is delivered directly to the phase change media through its surface by a laser beam. In electrical memory devices it is delivered by an electrical signal through metallic or semi-metallic contacts [12,13,15]. S-NDC enhances the role of inhomogeneities [15,16]. The rest of this paper describes the relationship between these parameters and programming speed. 2. EXPERIMENTS Four different type devices were used in the following experiments. The structure of the legacy ECD breakdown type and the offset pore type were reported previously [4]. In addition, we also report on data from more recent Ovonyx processed devices made by e-beam lithography and with break-down layers. Measurement Method for RESET SPEED We typically measure reset speed by applying optimized SET pulses and vary the width of optimized RESET pulses as shown in Figure 2a. The optimized amplitudes are obtained from RIVs measured on similar devices. The data are collected by varying the reset pulse width (10ns - 500ns) with its amplitude as a parameter. The low field device resistance is measured with a small DC bias after each pulse. Finally, RESET SPEED is defined as a ratio of Ireset at which Rrst on Rrst vs. Wreset falls below 20ns to Irs,sat from Fig.2b. In other words, we define reset speed as the ratio of Irs at which Rrs vs. Wrs crosses the demarcation line Wrs=20ns to Irs,sat (Fig.1). The lower this number, the faster is the reset speed.
b)
RESET
FIX SET
a)
Resistance (Ohms)
1E+6
1E+5
1E+4 Rset
1E+3 1.0E-8
1.0E-7
1.0E-6
Reset Pulse Width (sec)
Fig.2 a) Reset speed test scheme. Fixed are: set pulse (width and amplitude) and reset pulse amplitude, b) Example of Rrst vs. reset pulse width with different reset amplitude. Universal Measurement Method for SET SPEED We describe the SET SPEED method schematically in Figure 3a. A fixed reset amplitude and pulse width is applied with a fixed amplitude and increasing SET PULSE width. Since the device starts out SET, the target value for a set resistance, Rset,target, is reached almost immediately. Next the RESET amplitude is increased (RESET pulse width remains fixed through out the test) and it takes wider and wider set pulses to SET the device because it is being reset more and more. The target SET resistance is determined as: Rset,target = 10^ {log(Rset) + [log(Rrs/Rset)]/6 }. The SET-PW required to set below the Rset-target is plotted vs. Irs together with the RI curve and is shown in Figure 5b.Saturated values of Rrst are determined from the device RIVs, and thus Irst,sat and Irs,sat + 20% “over-reset” are determined. Fig.3 Set speed test scheme (a) and example of raw data (b)
2
Ip rogra m
1.E+7
Ip rogra m
Resistance (Ohms)
1.E+6
1.E+5
b)
1.E+4
196
183
170
157
144
131
118
92
105
79
66
53
40
27
1
14
1.E+3
Ip rogra m
a)
RSTAmplitude VARAITION
Iprogra m
SETPulse Width VARIATION
Se t
Etc
Re a d
Re a d
Se t
Re se t
Re a d
Re a d
Re se t
Num ber of pulses
Etc
Set c riteria rea c hed
3. RESULTS and DISCUSSION
1.6E+3
2.5E+6
1.4E+3
2.0E+6 Rset -dV/dI (Ohms)
Resistance (Ohms)
We now present results of an experimental study of phase change kinetics from amorphous to crystalline transitions for various GeSbTe film thicknesses, ranging from 13 to 100 nm. First we show that the reset resistance of a pore device can be calculated from the geometry presented by an up side down cone with truncated top. Its resistance is given by: R = (ρ*d)/(π∗r(r+d/tgα)), where r is the radius of bottom contact, d is the GST thickness and α is related to spreading and is taken to be 45o. Fig.4 a, shows experimental data and the scaling of Rreset,sat with GST thickness. As can be seen, Rrst,sat fits the above expression with a pore diameter of 2r = 2000 Angstrom. Scaling of the threshold voltage of switching of reset devices with GST thickness [14] also verified that the whole thickness of the device was involved in the phase transition. On the other hand, set resistance after subtraction of dV/dI doesn’t scale with thickness of GST. This suggests the presence of higher low-field resistivity layer independent on GST thickness.
1.5E+6 1.0E+6 5.0E+5 0.0E+0 0.0E+0 2.0E-6 4.0E-6 6.0E-6 8.0E-6 1.0E-5 1.2E-5
1.0E+3 8.0E+2 6.0E+2 4.0E+2 2.0E+2
GST Thickness (cm) Rrs,0.15 Rrs,0.25 Rrs,sat.experiment
1.2E+3
0.0E+0 0.0E+0
Rrs,0.2 Rrs,0.3
2.0E-6
4.0E-6
6.0E-6
8.0E-6
1.0E-5
1.2E-5
GST Thickness (cm)
Fig.4 Calculated and experimental Rrs,sat and Rset – dV/dI vs. GST thickness We now turn to the “time to crystallize,” as defined by the set pulse width needed to set the device to a target level from a given starting RESET resistance, which is shown in Fig.5. Starting with a nearly SET device the required set pulse width rises almost exponentially: Wset = Wset,min.exp(GRrs), (where G is characteristic conductance) with some intermediate saturation and finally vertically at seemingly the same Rrs. The rise in SET pulse width is seen when the remaining volume fraction of crystallites in the device decreases. We believe the vertical rise in pulse width appears at reset resistance corresponding to the loss of nuclei, e.g. no remaining crystallites.
3
1.E-5
1E+6
3.5E-6
Wset (sec)
Wset (sec)
3.0E-6
1.E-6
1.E-7
2.5E-6
1E+5
2.0E-6 1.5E-6 1E+4
1.0E-6 5.0E-7
1.E-8 1.E+3
1.E+4
1.E+5
0.0E+0 1E+3 0.0E+ 1.0E- 2.0E- 3.0E0 3 3 3
1.E+6
Reset Resistance (Ohms)
Reset Resistance (Ohms)
Previously we reported [14] that Wset,min scales with chalcogenide thickness and this allowed us to suggest that crystallization front propagates through the bulk of GST between contacts along the current path with approximate speed of 600cm/sec. So on one hand Rchalc,min doesn’t scale with GST thickness and on the other hand crystalline material seems to propagate from one contact to another. These two observations taken together suggest that the region mostly responsible for Rset is located at one of contacts. We believe the dominant component of Rset is located at the top electrode interface and crystalline material serves as a virtual contact to it. The effective area of the virtual contact to this interface will depend on low-field resistance of interface and Rset,target. Higher interface resistance larger is the volume fraction of crystalline material. Lower Rset,target also demands higher volume fraction of crystalline material. These volume fractions will be
Reset Current 20ns (A) Wset-to-5K (sec)
Wset-to-5K (sec)
Rrs
a) b) Fig.5 Set pulse width dependence on reset resistance (a) and on programming current (b). BDL device with C-C contacts higher than in a case with no resistive interface present. Thus the presence of a resistive interface reduces shunting effect of crystalline “needles” on the amorphous dome. Contact material, device geometry, and alloy effects. Figures 6a and 6b and Figures 7a nd 7b show reset and set resistance vs. corresponding pulse width and amplitude for two different types of devices made with the same chalcogenide alloy but with different geometries and different contact materials. The inserts show the devices schematically with materials and geometry of contacts. Comparing these two figures we note the dramatic difference in the RESET characteristics between the two device types. In the BDL devices Rrst shows no dependence on reset pulse width and varies ONLY with the reset pulse amplitude. In another words BDL device demonstrates that in the range of pulse width 30ns – 10ms only the pulse power programs the device into a reset state and defines the Rrst value. ALUMINUM SiNx (ILD)
CARBON METAL
a)
Resistance (Ohms)
SILICON SUBSTRATE
BREAKDOWN LAYER
1.0E+6 1.0E+5
b) 1.0E+4 1.0E+3 1.0E+2 1.0E-8
1.0E-6
1.0E-4
1.0E-2
Resistance (Ohms)
METAL CARBON CHALCOGENIDE SiNx
1.E+6 1.E+5 1.E+4 1.E+3 1.E+2 1.E-7
Reset,2.2mA Reset,1.36mA Reset,1.15mA
1.E-5
Set Pulse Width (sec)
Reset Pulse Width (sec) Reset,2.6mA Reset,1.6mA set 600ns, 1mA
1.E-6
Reset,1.8mA Reset,1.3mA Reset 1.25mA
R R R R
4
set,0.3mA set,0.57mA set,0.85mA set 1 1mA
R R R R
set,0.4mA set,0.66mA set,0.94mA set 1 2mA
R R R R
set,0.48mA set,0.75mA set,1mA set 1 3mA
Figure 6 a) Reset resistance vs. Pulse width for different reset current for a break-down device with C-C contacts, and b) Set resistance vs. set pulse width and amplitude (Iset) at fixed reset In the lateral offset device the RESET data is completely different. Here, a certain pulse width time for a full Rrst level is easily seen and depends on the amplitude of the pulse AND the pulse width. With high enough programming current, RESET speed on both type of devices is similar. Set behavior of these two groups is also distinct and is very similar if set current was chosen to be on the left-hand side of RI Ith